. 2016 May 3;113(18):4982-7.
doi: 10.1073/pnas.1521241113. Epub 2016 Apr 18.

Hysteresis in DNA compaction by Dps is described by an Ising model

Affiliations

Hysteresis in DNA compaction by Dps is described by an Ising model

Natalia N Vtyurina et al. Proc Natl Acad Sci U S A. .

Abstract

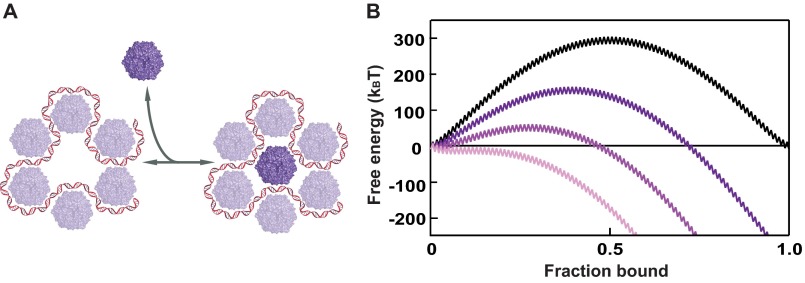
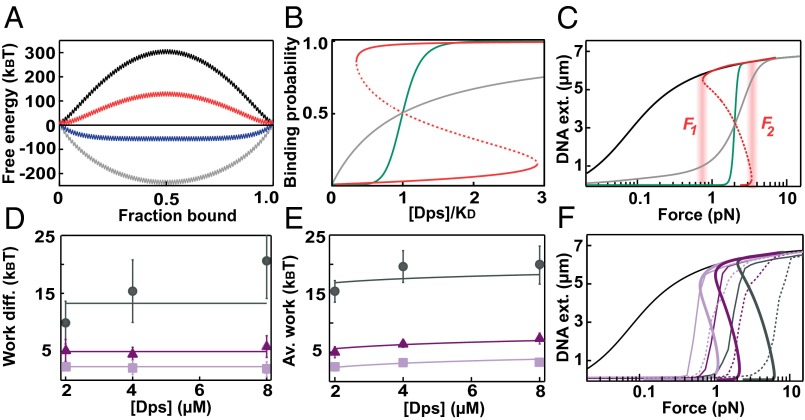
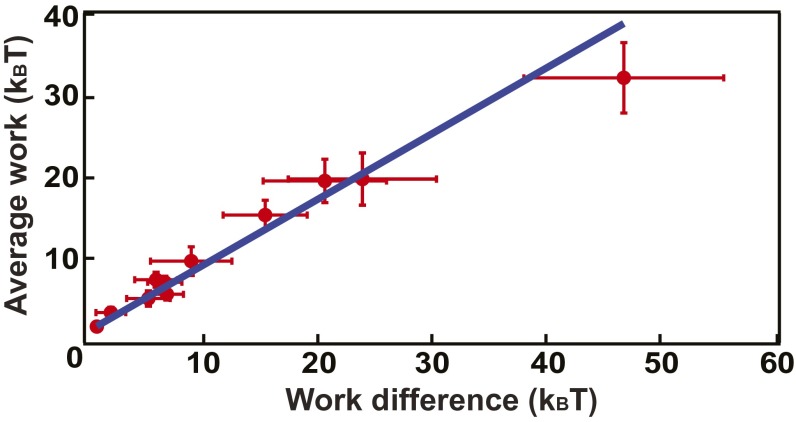
In all organisms, DNA molecules are tightly compacted into a dynamic 3D nucleoprotein complex. In bacteria, this compaction is governed by the family of nucleoid-associated proteins (NAPs). Under conditions of stress and starvation, an NAP called Dps (DNA-binding protein from starved cells) becomes highly up-regulated and can massively reorganize the bacterial chromosome. Although static structures of Dps-DNA complexes have been documented, little is known about the dynamics of their assembly. Here, we use fluorescence microscopy and magnetic-tweezers measurements to resolve the process of DNA compaction by Dps. Real-time in vitro studies demonstrated a highly cooperative process of Dps binding characterized by an abrupt collapse of the DNA extension, even under applied tension. Surprisingly, we also discovered a reproducible hysteresis in the process of compaction and decompaction of the Dps-DNA complex. This hysteresis is extremely stable over hour-long timescales despite the rapid binding and dissociation rates of Dps. A modified Ising model is successfully applied to fit these kinetic features. We find that long-lived hysteresis arises naturally as a consequence of protein cooperativity in large complexes and provides a useful mechanism for cells to adopt unique epigenetic states.

Keywords: DNA condensation; Dps; Ising model; cooperativity; hysteresis.


Conflict of interest statement

The authors declare no conflict of interest.

Figures

Fig. S1.
Fig. S1.
Spherical Dps dodecamers bind to dsDNA. (A) Dps 12-mers form a shell-like structure 8–9 nm in diameter (13). Fluorescent dye is attached to a cysteine residue (red) facing a 4- to 5-nm internal cavity. (B) Cartoon of the fluorescence assay showing an immobilized DNA molecule labeled with YOYO-1 (green stars) and diffusing Dps dodecamers labeled with Cy5 (red stars). (C) Cartoon of the magnetic tweezers assay showing a DNA molecule attached by one end to a microscope coverslip and by the other end to a magnetic bead. A pair of small permanent magnets controls the magnetic field.
Fig. 1.
Fig. 1.
DNA compaction by Dps observed with fluorescence. (A) Fluorescent images show a single DNA molecule (green) in the presence of 0.2 µM Dps undergoing thermal fluctuations in position (0–720 s). When Dps (red) binds to the DNA, these molecules colocalize into an immobile Dps–DNA complex (900–1,620 s). (B) Three example traces show the abrupt decrease in DNA fluctuations (green) and the sharp increase in the maximum fluorescence intensity of Dps (red) upon compaction. (C) Individual records (N=14), time-shifted so that collapse occurred at t = 0, were averaged. The majority of Dps (red) bound and compacted the DNA (green) in less than 6 s. (D) Average DNA fluctuations (green) and Dps intensity (red) of a set of molecules (N=53) were recorded under five successive buffer conditions: DNA in reaction buffer without Dps (0–120 s), addition of 0.75 µM Dps (120–240 s), flushing with reaction buffer to remove Dps (240–360 s), addition of 3 mM MgCl2 (360–480 s), and flushing with reaction buffer to remove MgCl2 (480–600 s).
Fig. S2.
Fig. S2.
Dps–DNA gel shift assay fit to Hill equation. (A) Different amounts of Dps monomers were incubated with 40 pM of 20.6-kbp DNA, allowing binding, run on an agarose gel, and then stained with SYBR Gold (Thermo Fisher Scientific). The amounts of bound DNA were monitored by the fluorescence at the position on the agarose gel corresponding to nonbound DNA (lines) and bound DNA (wells). Through comparison with a reference DNA sample incubated without Dps, the bound DNA fraction was determined and calibrated from 0 to 100%. (B) The amounts of bound DNA (yellow circles) were fit with a Hill equation (25) (green line). The effective dissociation constant KD = 0.63 ± 0.17 µM and cooperativity coefficient NH = 2.20 ± 0.53 (n = 2, mean, SD) were determined.
Fig. S3.
Fig. S3.
DNA compaction by Dps observed with fluorescence in real time. (A) Fourteen normalized traces show the abrupt decrease in DNA positional fluctuations (green) and the sharp increase in the maximum fluorescence intensity of Dps (red) that define DNA compaction. Compaction occurred rapidly after a variable wait time of 200 ± 230 s (mean ± SD). (B) Three normalized example traces time-shifted so that collapse in DNA positional fluctuations (green) and increase in Dps maximum fluorescence intensities (red) occurred at t = 0 (Fig. 1B; traces 1, 3, and 7 from A). (C) Average DNA fluctuations (green) and Dps intensity (red) of a set of molecules (N=23) were recorded under three successive buffer conditions: DNA in reaction buffer (pH 7.3) without Dps (0–60 s), addition of 0.45 µM Dps (60–660 s), and flushing with reaction buffer at pH 8.1 to remove Dps (660–1,000 s).
Fig. 2.
Fig. 2.
DNA force-extension cycles show hysteresis. (A) Force-extension curves for a DNA tether without Dps (black) and for three DNA tethers in the presence of 8 µM Dps (blue, orange, and green). The WLC DNA extension (gray) is plotted for comparison (20). Solid lines correspond to decreasing force and dashed lines to increasing force. (B) Average DNA extension (N=11, mean, SEM) in the absence (black) and presence (red) of 8 µM Dps. Solid lines correspond to decreasing force and dashed lines to increasing force. Hysteresis is demonstrated by the 5-pN gap between critical forces F1 and F2. (C) Average DNA extensions (mean, SEM) in the absence (black) and presence of 2 µM Dps at different pulling rates. The data were collected over 24 min (green), 95 min (red), and 190 min (blue). Solid lines correspond to decreasing force and dashed lines to increasing force. (D) DNA extension was measured in the presence of 8 µM Dps (red) while the force (blue) was rapidly shifted in and out of the critical range.
Fig. S4.
Fig. S4.
Hysteresis in Dps–DNA complexes is stable over many timescales. (A) Extension of a single DNA molecule (blue) plotted as a function of time as the force is decreased near the critical force F1. Reversible fluctuations in the extension were limited to less than 100 nm (Inset). The WLC DNA extension (gray) is also plotted at each force. (B) Extension of the same DNA molecule (blue) plotted while the force is increased near the critical force F2. The WLC DNA extension (gray) is also plotted at each force.
Fig. 3.
Fig. 3.
Buffer conditions affect DNA–Dps stability. Decreasing and increasing force-extension curves are represented by solid and dashed lines, respectively. Bare DNA curves shown in black. Mean and SE were generated from 10 to 20 molecules per curve. (A) Effects of Dps concentration: 2 µM (light blue), 4 µM (dark blue) and 8 µM (dark gray) (50 mM NaCl, pH 7.3). (B) Effects of NaCl concentration: 50 mM (dark gray), 100 mM (dark purple), and 150 mM (light purple) (8 µM Dps, pH 7.3). (C) Effects of MgCl2: 0 (dark gray) and 2 mM (orange) (8 µM Dps, 50 mM NaCl, pH 7.3). (D) Effects of PEG: 0 (light green) and 5% (wt/vol; dark green) (0.5 µM Dps, 50 mM NaCl, pH 7.3).
Fig. S5.
Fig. S5.
pH affects stability of Dps–DNA complexes. Force-extension cycles in the buffer at different pH levels: pH 6.9 (dark pink), 7.3 (pink), and 8.1 (light pink) (2 µM Dps, 100 mM NaCl, and 50 mM Hepes-KOH). Decreasing and increasing force records are represented by solid and dashed lines, respectively. Force-extension curves are compared with the force-extension curve without Dps (black). Decreasing and increasing force records are represented by solid and dashed lines, respectively. Each curve is generated from the mean of 10–20 molecules and the bars correspond to SEs in the mean.
Fig. S6.
Fig. S6.
Kinetic interpretation of the hysteresis. (A) A cartoon representation of the possible interactions between a Dps dodecamer (dark purple) and neighboring Dps (light purple) and DNA. (B) The global free energy curves Gglobal as a function of the number of bound Dps dodecamers at different forces (Eq. S19): (F1+F2)/2 (black), (2F1+F2)/3 (dark purple), (5F1+F2)/6 (purple), and F1 (light purple).
Fig. 4.
Fig. 4.
An Ising model describes hysteresis. (A) Plots of ΔGglobal (Eq. S17) demonstrate that high cooperativity creates two local equilibria: I = 0 (gray), I=4 (blue), I=8 (red), and I=12 (black). (B) The probability binding DNA as a function of Dps concentration in the case of: no cooperativity (gray), Hill cooperativity (NH=8, green), and Ising cooperativity (I=8, red) (Eqs. S3S5). (C) Force-extension predictions for DNA with different binding models: no binding (black), noncooperative (gray), Hill (green), and Ising (red) (Eqs. S6S8). (D) Work difference as a function of Dps concentration for different NaCl concentrations (mean, SD): 50 mM (dark gray circles), 100 mM (dark purple triangles), and 150 mM (light purple squares). These values were fit to Eq. 2 (solid lines). (E) Average work as a function of Dps concentration for different NaCl concentrations (mean, SD): 50 mM (dark gray circles), 100 mM (dark purple triangles), and 150 mM (light purple squares). These values were fit to Eq. 3 (solid lines). (F) Ising model force-extension curves (bold solid lines) are superimposed on the experimental data (thin solid and dashed lines) for different NaCl concentrations: 50 mM (dark gray), 100 mM (dark purple), and 150 mM (light purple) at 8 µM Dps.
Fig. S7.
Fig. S7.
Correlation between work difference and average work. Work difference (Wdiff) and average work (Wave) performed by Dps dodecamers to bind DNA were derived at various buffer conditions. These values are plotted against each other (red) and a linear regression was applied (blue). The two variables exhibit a strong correlation (Pearson’s r = 0.89). Bars correspond to SDs, as shown in Table S1.
Fig. S8.
Fig. S8.
Hysteresis in other cooperative models. (A) The MWC model is characterized by the three parameters C, L, and KT (Eq. S20). The model predicts a sharp barrier in the global free energy for large N. The strength of the cooperativity is set by C=KR/KT : C=1 (gray), C=e4 (blue), C=e8 (red), and C=e12 (black). N=360. (B) The global free energy is estimated for the CS model using a Markov chain Monte Carlo algorithm on a 3 × 3 × 3 lattice (open circles). For comparison we plot our mean-field approximation for N=27 (solid circles). I=0 (gray), I=4 (blue), I=8 (red), and I=12 (black).
Fig. S9.
Fig. S9.
Fluorescent labeling of Dps mutant T79C does not affect the binding affinity of Dps for DNA. Force-extension curves recorded in the presence of 2 µM Dps mutant T79C (red) are compared with force-extension curves recorded with 2 µM wild-type Dps (blue) in a buffer of 100 mM NaCl, pH 7.3. The DNA force-extension curve without Dps (black) is shown as well. Decreasing and increasing force records are represented by solid and dashed lines, respectively. Each curve is generated from the mean of 5–10 molecules and the bars correspond to SEs in the mean.

References

    1. Smith DE, Perkins TT, Chu S. Dynamical scaling of DNA diffusion coefficients. Macromolecules. 1996;29(4):1372–1373.
    1. Dillon SC, Dorman CJ. Bacterial nucleoid-associated proteins, nucleoid structure and gene expression. Nat Rev Microbiol. 2010;8(3):185–195. - PubMed
    1. Dorman CJ. Function of nucleoid-associated proteins in chromosome structuring and transcriptional regulation. J Mol Microbiol Biotechnol. 2014;24(5-6):316–331. - PubMed
    1. Almirón M, Link AJ, Furlong D, Kolter R. A novel DNA-binding protein with regulatory and protective roles in starved Escherichia coli. Genes Dev. 1992;6(12B):2646–2654. - PubMed
    1. Ali Azam T, Iwata A, Nishimura A, Ueda S, Ishihama A. Growth phase-dependent variation in protein composition of the Escherichia coli nucleoid. J Bacteriol. 1999;181(20):6361–6370. - PMC - PubMed

Publication types

MeSH terms

LinkOut - more resources