. 2016 May 3;113(18):4976-81.
doi: 10.1073/pnas.1603992113. Epub 2016 Apr 18.

Controllability analysis of the directed human protein interaction network identifies disease genes and drug targets

Affiliations

Controllability analysis of the directed human protein interaction network identifies disease genes and drug targets

Arunachalam Vinayagam et al. Proc Natl Acad Sci U S A. .

Abstract

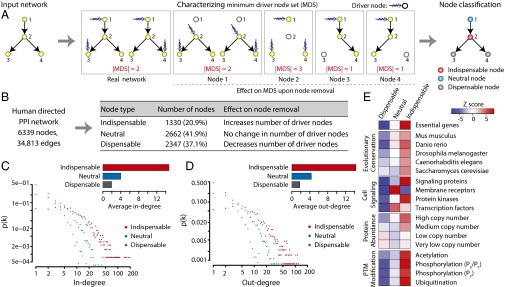
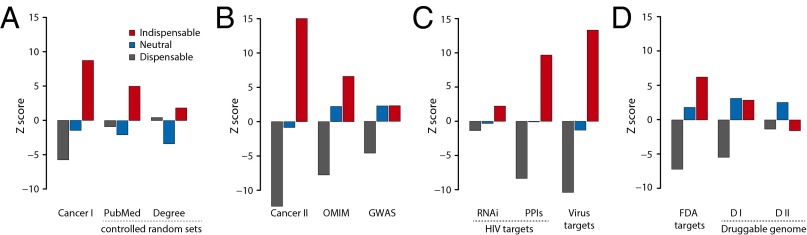
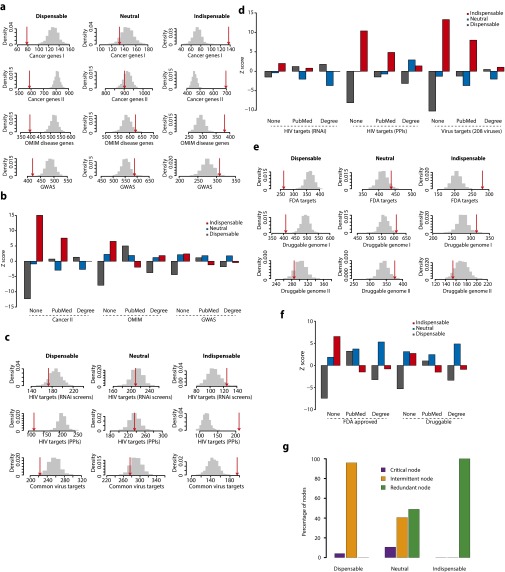
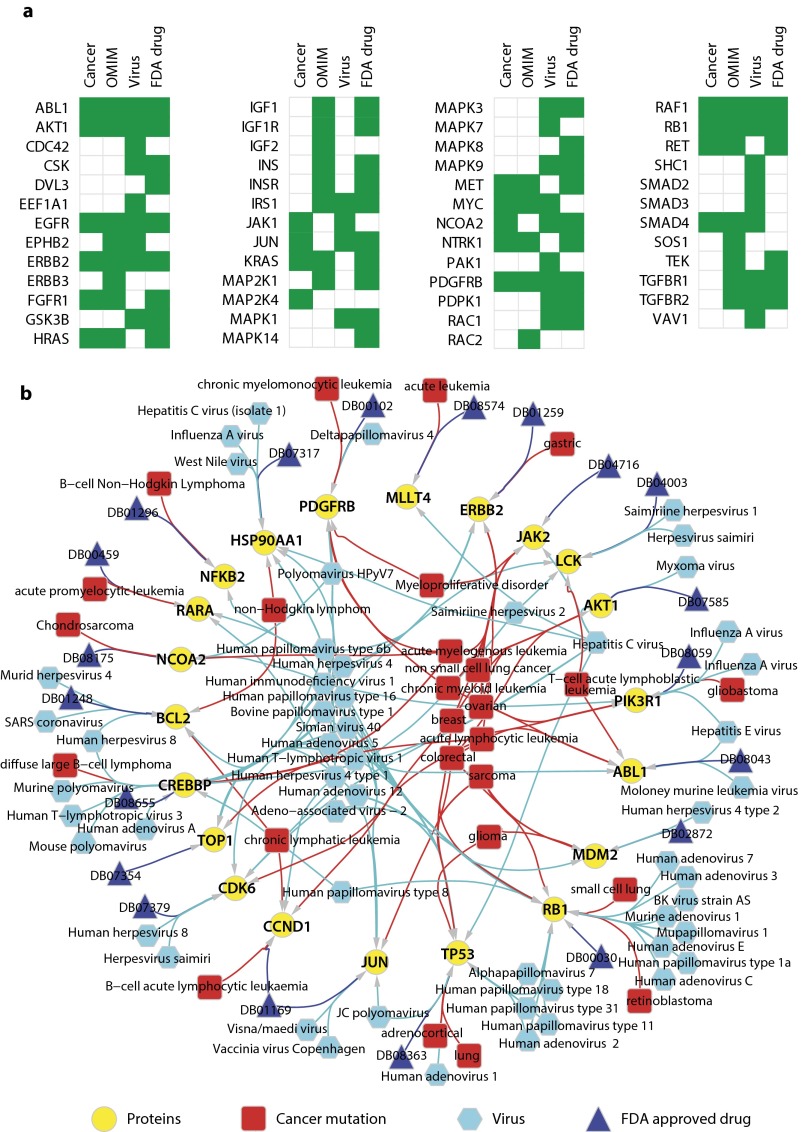
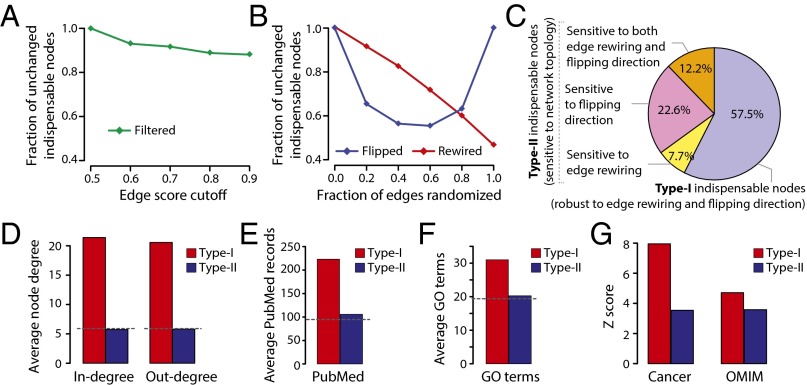
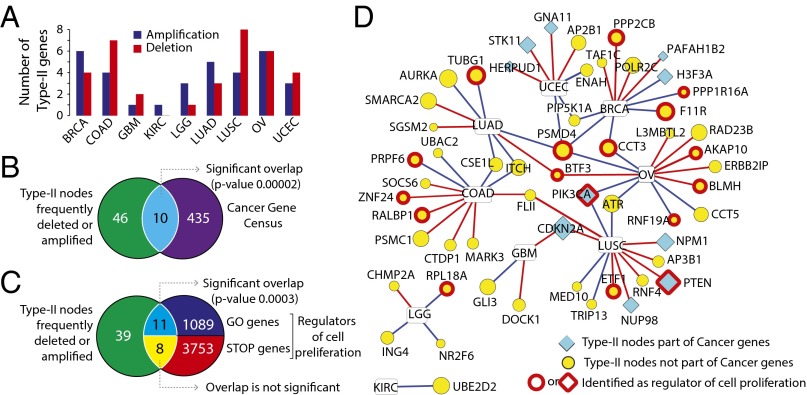
The protein-protein interaction (PPI) network is crucial for cellular information processing and decision-making. With suitable inputs, PPI networks drive the cells to diverse functional outcomes such as cell proliferation or cell death. Here, we characterize the structural controllability of a large directed human PPI network comprising 6,339 proteins and 34,813 interactions. This network allows us to classify proteins as "indispensable," "neutral," or "dispensable," which correlates to increasing, no effect, or decreasing the number of driver nodes in the network upon removal of that protein. We find that 21% of the proteins in the PPI network are indispensable. Interestingly, these indispensable proteins are the primary targets of disease-causing mutations, human viruses, and drugs, suggesting that altering a network's control property is critical for the transition between healthy and disease states. Furthermore, analyzing copy number alterations data from 1,547 cancer patients reveals that 56 genes that are frequently amplified or deleted in nine different cancers are indispensable. Among the 56 genes, 46 of them have not been previously associated with cancer. This suggests that controllability analysis is very useful in identifying novel disease genes and potential drug targets.

Keywords: controllability; disease genes; drug targets; network biology; protein–protein interaction network.


Conflict of interest statement

The authors declare no conflict of interest.

Figures

Fig. 1.
Fig. 1.
Characterizing the controllability of human directed PPI network. (A) Schematic representation of the node classification using controllability framework. (B) Identification of indispensable, neutral, and dispensable nodes in human directed PPI network. (C) In-degree distribution and average in-degree for three different node types. (D) Out-degree distribution and average out-degree for three different node types. (E) Distinct enrichment profiles of indispensable, neutral, and dispensable nodes in the context of essential genes, evolutionary conservation, cell signaling, protein abundance, and PTMs.
Fig. S1.
Fig. S1.
(A and B) Literature and annotation bias for the three node types. Bar plots show average PubMed records associated (A) and Gene Ontology terms annotated (B) for each node type. (C and D) Correlation of node degree vs. literature bias. The plots show the correlation of in-degree (C) and out-degree (D) to the number of PubMed records associated with each node in the entire network. (E) Enrichment analysis of essential genes. Numbers of essential genes overlapping with dispensable, neutral, and indispensable nodes are shown in red arrows. The essential genes are compiled from the Database of Essential Genes (DEG) (tubic.tju.edu.cn/deg) (50) and Online GEne Essentiality database (OGEE) (ogeedb.embl.de) (51). Numbers of essential genes overlapping with size-controlled random sets are shown in gray bars. (F) Enrichment analysis of conserved genes. Numbers of genes conserved in Mus musculus (mouse), Danio rerio (fish), Drosophila melanogaster (fly), Caenorhabditis elegans (worm), and Saccharomyces cerevisiae (yeast) are shown in red arrows, and their respective size-controlled random set distributions are shown in gray bars. The ortholog mapping was performed using the Drosophila RNAi Screening Center (DRSC) Integrative Ortholog Prediction Tool (DIOPT) (www.flyrnai.org/DIOPT) (52).
Fig. S2.
Fig. S2.
(A) Enrichment analysis of signaling proteins. Numbers of nodes overlapping with signaling proteins (annotated with signaling pathways in Cell Signaling Technology database www.cellsignal.com/common/content/content.jsp?id=science-pathways) (53), receptors (54), protein kinases (55, 56) (kinase.com/kinbase/index.html), and transcription factors (57) are shown in red arrows and, their respective size-controlled random set distributions in gray bars. (B) Enrichment analysis of protein abundance. Numbers of nodes overlapping with high copy numbers (>100,000 copies) (A), moderate copy numbers (5000–100,000 copies), low copy numbers (500–5,000 copies) (C), and very low copy numbers (<500 copies) are shown in red arrows, and their respective size-controlled random set distributions in gray bars. The copy number dataset was obtained from Beck et el. (58). (C) Enrichment analysis of protein PTMs. Numbers of nodes overlapping with any PTM [Acetylation, Tyrosine Phosphorylation (Phosphorylation Y), Serine/Threonine Phosphorylation (S/T), or Ubiquitination], Acetylation, Tyrosine Phosphorylation, Serine/Threonine Phosphorylation, and Ubiquitination datasets are shown in red arrows and their respective size-controlled random set distributions in gray bars. The PTM dataset was obtained from Woodsmith et al. (59).
Fig. 2.
Fig. 2.
Characterizing network controllability in transition from healthy to disease state. (A) Bar graph showing the enrichment results (z scores) of cancer genes compared with the random sets (Cancer I, cancer gene census) and the random sets controlled for literature (PubMed) or degree (Degree) bias. In the case of degree- or literature-controlled random sets, the random sets are sampled such that the average degree or average PubMed records of random sets matches the average of node type N. (B) Results from enrichment analysis of dataset corresponding to extended list of cancer genes (Cancer II), other human diseases (OMIM), and GWAS. (C) Results from enrichment analysis of the targets of HIV identified using RNAi screens (RNAi) and PPI networks (PPIs) and targets of other human virus (208 viruses). (D) Enrichment results from targets of FDA-approved drugs and druggable genome. DI, druggable genome; DII, druggable genome excluding FDA-approved targets.
Fig. S3.
Fig. S3.
(A) Enrichment analysis of disease genes. Numbers of nodes overlapping with genes causally associated with cancer (Cancer genes I, cancer gene census) (Cancer Gene Census; cancer.sanger.ac.uk/census) (17) and a list of predicted cancer genes (Cancer genes II, extended list of cancer genes) (18), annotated as disease genes in the OMIM database (omim.org) and associated with disease in GWAS (www.genome.gov/gwastudies), are shown in red arrows, and their respective size-controlled random set distributions in gray bars. (B) Enrichment analysis of disease genes using literature- and degree-controlled random sets. In the case of degree- or literature-controlled random sets, the random sets are sampled such that the average degree or average PubMed records of random sets matches the average of node type N. (C) Enrichment analysis of virus targets. Numbers of nodes overlapping with genes identified to have an adverse effect on HIV-1 replication when knocked down (RNAi screens) (–24), human proteins that directly interact with HIV proteins (HIV targets PPI) (26, 27), and human proteins that are known to physically interact with proteins from 208 viruses (common virus targets) (–29) are shown in red arrows, and their respective size-controlled random set distributions in gray bars. (D) Enrichment analysis of virus targets using literature- and degree-controlled random sets. Random sets are generated as explained in B. (E) Enrichment analysis of drug targets. Numbers of nodes overlapping with proteins that are targeted by FDA-approved drugs (31), proteins with domains or folds that could bind to drug-like molecules (druggable genome I) (32), and a subset of druggable genome I excluding the FDA-approved drug targets (druggable genome II) are shown in red arrows, and their respective size-controlled random set distributions in gray bars. (F) Enrichment analysis of drug targets using literature- and degree-controlled random sets. Random sets are generated as explained in B. (G) Characterizing indispensable, neutral, and dispensable nodes based on their roles as driver nodes. The recently developed approach is used to classify a node as critical, intermittent, or redundant if it acts as a driver node in all, some, or none of the control configurations, respectively (33). The bar graph compares the indispensable, neutral, and dispensable nodes against the critical, intermittent, and redundant node classification.
Fig. S4.
Fig. S4.
(A) Members of receptor tyrosine signaling pathways that are predicted as indispensable nodes and targeted by cancer mutations, OMIM disease, viruses, or FDA-approved drugs. RTK pathway members are as defined by the SignaLink database (60). (B) Indispensable nodes that are targeted by all three inputs (cancer mutation, viruses, and drugs). The labels of FDA drug nodes correspond to DrugBank IDs. The network was generated using Cytoscape (61).
Fig. 3.
Fig. 3.
Perturbation of network connectivity reveals two subtypes of indispensable nodes (type-I and type-II). (A) Plot showing the fraction of indispensable nodes in filtered networks that overlaps with the real network. The network filtering achieved using edge confidence score. (B) Fraction of indispensable nodes in rewired or direction-flipped overlap with the real network. (C) Identification of type-I and type-II indispensable nodes. The average node degree (D), PubMed record association (E), and Gene Ontology (GO) term annotations (F) for type-I and type-II indispensable nodes. (G) Enrichment of type-I and type-II indispensable nodes as cancer genes and OMIM disease genes.
Fig. S5.
Fig. S5.
(A and B) Robustness of node classification. (A) The fraction of indispensable, neutral, and dispensable nodes is plotted as a function of edge filtering (filtering using edge score). (B) The fraction of nodes in the filtered network sharing the same node classification as the real network (unchanged annotation) is plotted as a function of edge filtering. (C–F) Analysis of node classification in perturbed networks. (C) The fraction of indispensable, neutral, and dispensable nodes is plotted as a function of fraction of edges rewired. (D) The fraction of nodes in the rewired network sharing the same node classification as the real network (unchanged annotation) is plotted as a function of edge rewired. (E) Same as C, but the x axis corresponds to a fraction of flipped-edge directions. (F) Same as D, but the x axis corresponds to a fraction of flipped-edge directions. (G) Comparison of network properties of type-I and type-II indispensable nodes. The network betweenness centrality, closeness centrality, clustering coefficient, and neighborhood connectivity values are calculated using the NetworkAnalyzer Cytoscape plugin (62). The gray dotted line shows the average value of the network.
Fig. 4.
Fig. 4.
Applying network controllability to mine cancer genomic data. (A) Type-II genes frequently amplified or deleted in cancer patients (part of top 1% genes). The bar plot shows number of type-II genes deleted/amplified in brain lower grade glioma (LGG), kidney renal clear cell carcinoma (KIRC), lung adenocarcinoma (LUAD), lung squamous cell carcinoma (LUSC), ovarian serous cystadenocarcinoma (OV), uterine corpus endometrial carcinoma (UCEC), breast invasive carcinoma (BRCA), colon adenocarcinoma (COAD), and glioblastoma multiforme (GBM) cancers. (B) Overlap between frequently deleted/amplified type-II genes and known cancer genes. (C) Overlap between frequently deleted/amplified type-II genes and regulators of cell proliferation (STOP genes reduces cell proliferation and GO genes increases cell proliferation). The P values show the significance of overlap calculated based on 1000 random sets. (D) Network representation of 56 type-II genes frequently deleted (red edge) or amplified (blue edge) in nine different cancer types. The node size corresponds to the number of PubMed records associated with the gene.
Fig. S6.
Fig. S6.
Enrichment analysis of type-II indispensable nodes frequently amplified/deleted in cancer. Numbers of type-II indispensable nodes (frequently amplified/deleted in cancer) overlapping with genes causally associated with cancer (Cancer Gene Census) (17) (A), negative regulators of cell proliferation (STOP genes) (37) (B), and positive regulators of cell proliferation (GO genes) (37) (C) are shown in red arrows, and their respective size-controlled random set distributions in gray bars.

References

    1. Isidori A. 1995. Nonlinear Control Systems (Springer, Berlin, New York), 3rd Ed.
    1. Kalman RE. Mathematical description of linear dynamical systems. J Soc Indust Appl Math Ser A Control. 1963;1(2):152–192.
    1. Slotine JJE, Li W. 1991. Applied Nonlinear Control (Prentice Hall, Englewood Cliffs, NJ)
    1. Iglesias PA, Ingalls BP. 2010. Control Theory and Systems Biology (MIT Press, Cambridge, MA)
    1. Del Vecchio D, Murray RM. 2015. Biomolecular Feedback Systems (Princeton Univ Press, Princeton)

Publication types