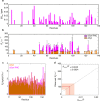
. 2016 May 3;113(18):5012-7.
doi: 10.1073/pnas.1519124113. Epub 2016 Apr 18.

Structural characterization of the interaction of α-synuclein nascent chains with the ribosomal surface and trigger factor

Affiliations

Structural characterization of the interaction of α-synuclein nascent chains with the ribosomal surface and trigger factor

Annika Deckert et al. Proc Natl Acad Sci U S A. .

Abstract

The ribosome is increasingly becoming recognized as a key hub for integrating quality control processes associated with protein biosynthesis and cotranslational folding (CTF). The molecular mechanisms by which these processes take place, however, remain largely unknown, in particular in the case of intrinsically disordered proteins (IDPs). To address this question, we studied at a residue-specific level the structure and dynamics of ribosome-nascent chain complexes (RNCs) of α-synuclein (αSyn), an IDP associated with Parkinson's disease (PD). Using solution-state nuclear magnetic resonance (NMR) spectroscopy and coarse-grained molecular dynamics (MD) simulations, we find that, although the nascent chain (NC) has a highly disordered conformation, its N-terminal region shows resonance broadening consistent with interactions involving specific regions of the ribosome surface. We also investigated the effects of the ribosome-associated molecular chaperone trigger factor (TF) on αSyn structure and dynamics using resonance broadening to define a footprint of the TF-RNC interactions. We have used these data to construct structural models that suggest specific ways by which emerging NCs can interact with the biosynthesis and quality control machinery.

Keywords: NMR spectroscopy; cotranslational folding; nascent chain; ribosome; α-synuclein.


Conflict of interest statement

The authors declare no conflict of interest.

Figures
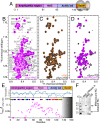
Fig. 1.
Fig. 1.
NMR characterization of the αSyn RNC. (A) Schematic of the αSyn RNC construct. (B) The 1H-15N SOFAST-HMQC spectrum of the αSyn RNC and resonance assignments; R indicates 70S background peaks. (C) Comparison of 1H-15N SOFAST-HMQC spectra of isolated αSyn with and without 1 mol eq of ribosomes. (D) Comparison of the αSyn RNC spectrum in B with αSyn in the presence of 70S in C; RNC intensities amplified. (E) Cross-peak intensities in the αSyn RNC relative to isolated αSyn in the presence of ribosomes; the gray-shaded area depicts the approximate length of the exit tunnel. A Kyte and Doolittle hydropathy plot and an amino acid classification of the αSyn protein sequence in positively charged (blue), negatively charged (red), and aromatic (green) residues is also shown. (F) Anti-SecM Western blot to probe for RNC integrity, showing tRNA-bound (∼40 kDa) and released αSyn NCs (∼20 kDa).
Fig. S1.
Fig. S1.
RNC purification and monitoring of sample stability of 15N-labeled αSyn RNCs. (A) αSyn RNC purification involves a four-stage strategy including a sucrose cushion to pellet ribosomal material, nickel affinity chromatography to selectively enrich NC occupied ribosomes using the N-terminal H6-tag, purification tag removal using a TEV protease, and a sucrose gradient ultracentrifugation step. The 70S-containing fractions (indicated by red borders) were identified using absorbance measurements at 254 nm and silver staining of SDS/PAGE. (B) Anti-SecM Western blot of samples (10 pmol) collected during RNC purification. A band shift of ∼0.6 kDa is observed in the NC following TEV cleavage to remove H6-tag (lane 1 to lane 2). (C) Ribosome occupancy determination: anti-αSyn Western blot RNC sample (10 pmol, 70S ribosome concentration) relative to αSyn protein standards. (D) Anti-SecM Western blot of the RNC sample during its NMR acquisition period. The band at ∼40 kDa is indicative of a tRNA-bound RNC species (37). (E) NC occupancy as determined by Western blot: band intensities of isolated αSyn standards (from C) plotted against concentrations, alongside the corresponding calibration used for quantitative analysis. (F) NC integrity as assessed over time. Band intensities of RNC samples loaded in D are plotted over time to monitor the integrity of the NC species over the course of NMR data acquisition. The timeframe during which the sample is deemed to be intact is highlighted in yellow. (G) The 15N-XSTE diffusion NMR measurements, at 5% and 95% gradient strengths as indicated, for an attached αSyn NC and isolated αSyn. (H) The integrated intensities of the 15N-edited 1D envelope over time (blue circles) and 15N-stimulated echo diffusion measurements (38) on the αSyn RNC at 5% (red squares) and 95% (green squares) of the maximum gradient strength. Error bars indicate the SEM derived from measurements of spectral noise. (I) Intensity ratio I95%/I5% of the αSyn RNC during NMR data acquisition (average I95%/I5% ∼0.82 ± 0.12 and D = 7.67 ± 5.56 × 10⁻¹² m2⋅s−1). The green line represents the intensity ratio measured for intact 70S ribosomes [hydrodynamic radius rh = 12.6 nm (59), diffusion coefficient D = 1.1 × 10⁻¹¹ m2⋅s−1 at 277 K in H2O]. The red line indicates the intensity ratio of isolated αSyn [rh = 2.72 nm (30), D = 5 × 10⁻¹¹ m2⋅s−1 at 277K in H2O].
Fig. S2.
Fig. S2.
NMR experiments of 70S ribosomes and isolated αSyn. NMR experiments of isolated αSyn in the presence of 70S ribosome, recorded under the same conditions as the αSyn RNC sample (277 K in Tico buffer at pH 7.0). (A) Overlay of 1H-15N SOFAST-HMQC spectrum of the αSyn RNC in magenta with the 1H-15N SOFAST-HMQC spectrum of 15N-labeled 70S ribosomes (dark gray). The ribosome spectrum was recorded to identify potential ribosomal peaks in the αSyn RNC spectrum originating from background labeling of the ribosomal protein L7/L12 (27) (dark gray). (B) The 1H-15N SOFAST HMQC spectrum of isolated αSyn with backbone assignment. Boxed area in B expanded for clarification. (C) Relative cross-peak intensities of WT αSyn (orange) in the presence and absence of 1 mol eq 70S ribosomes.
Fig. S3.
Fig. S3.
Chemical shift changes and lineshape analysis for the αSyn RNC and isolated αSyn. (A) ΔδNH chemical shift changes between the isolated αSyn protein and the αSyn RNC (ΔδNH=[ΔδH2+(ΔδN/5)2]1/2/ppm). (B) Transverse relaxation rate (R2) determined for αSyn bound to the ribosome (magenta) and αSyn in isolation (orange). R2 values were resolved by fitting the NMR resonances to Lorentzian lineshapes. Because 3JHNHA couplings were not resolved, we note that these relaxation rates are expected to contain an additional contribution of ca. 20–30 s–1 (6–10 Hz). (C) The 1H amide linewidths estimated for a rigid ribosome-associated state by averaging of 1H-1H dipolar interactions across an ensemble of all-atom models of the αSyn RNC. Calculations were repeated to both include (magenta) and exclude (orange) the effect of ribosomal protons. (D) Estimation of ribosome-bound populations of the αSyn RNC using measured linewidths of free the αSyn (Fig. 2B) and calculated bound-state linewidths (Fig. S3C), R2,obs = R2,free + pboundS2R2,rigid (black dashed line). The red line and shaded area show the mean ± SD of linewidths measured for the αSyn RNC (residues 48–124) and the associated bound-state population.
Fig. S4.
Fig. S4.
NMR spectra and relative cross-peak intensities of the αSyn charge variants. (A) Charge variants constructed to investigate the effect of electrostatics. Of the 15 Lys residues within the αSyn sequence, the first 11 (residues K6 to K60) were mutated to Glu, lowering the pI from 4.67 (WT) to 3.63 (K6–60E). Having an N-terminal hexa-histidine (H6) tag increased the pI to 5.22. (B) The 1H-15N HSQC spectrum of H6-αSyn (green) and in (C) overlaid with WT αSyn (orange). (D) The 1H-15N SOFAST-HMQC spectrum of K6–60E αSyn (blue) and in (E) overlaid with WT αSyn (orange). (F) Relative cross-peak intensities of K6–60E αSyn (blue), WT αSyn (orange, as in Fig. S2C), and H6-αSyn (green) in the presence and absence of 1 mol eq 70S ribosomes. Cross-peak intensities of the αSyn RNC relative to isolated αSyn in the presence of ribosomes (pink, as in Fig. 1E) have been plotted again for better comparison between the line broadenings observed in the N-terminal region of the RNC as well as isolated αSyn.
Fig. 2.
Fig. 2.
The 1H linewidth analysis of the αSyn RNC. (A) The 1H cross-sections through 1H-15N SOFAST-HMQC spectra (δN113.15 ppm, Fig. 1B, dashed line) of isolated αSyn and the αSyn RNC fitted to a sum of Lorentzian functions (solid lines) to determine 1H R2 rates. (B) Distribution of R2 values obtained from lineshape fitting of residues selected from V48–A124 for isolated αSyn(34 residues) and the αSyn RNC (31 residues). (C) Schematic depicting the exchange of the NC between its free and ribosome-associated states. The globally bound state consists of a population-weighted average of a locally flexible state, where residue i is highly dynamic but in close proximity to residues tethered nearby, and a locally rigid state with residue i being in direct contact with the ribosome surface. The relative proportions of these states are described by the generalized order parameter, S2.
Fig. 3.
Fig. 3.
NMR analysis of the interaction of TF with αSyn RNCs. (A) Comparison of 1H-15N SOFAST-HMQC spectra of the αSyn RNC with and without 1 mol eq TF. (B) Relative cross-peak intensities of the αSyn RNC following addition of TF. A Kyte and Doolittle hydropathy plot and an amino acid classification of the αSyn protein sequence in positively charged (blue), negatively charged (red), and aromatic (green) residues is shown. (C) Changes in the integrals of 15N-edited 1H amide envelopes of the αSyn RNC and 15N-labeled 70S ribosomes with increasing TF. (D) Changes in the integrals of 13C-edited 1H methyl envelopes with increasing TF, in the presence of αSyn RNC (6.5 μM 70S) and 70S ribosomes (5 μM 70S). Integrals have been normalized to a 10 µM sample of isolated TF scaled according to the 70S concentration (neglecting effects of the TF monomer/dimer equilibrium).
Fig. S5.
Fig. S5.
Chemical shift and peak intensity perturbations of isolated αSyn and the αSyn RNC upon addition of TF. (A) ΔδNH chemical shift changes between the αSyn RNC in the presence and absence of TF and (B) between isolated αSyn in the presence and absence of TF (ΔδNH=[ΔδH2+(ΔδN/5)2]1/2/ppm). (C) Relative cross-peak intensities between isolated αSyn in the presence of both 70S ribosomes and TF compared with αSyn+70S only (gray circles), between αSyn+TF compared with isolated αSyn at 5 μM (green circles), and 100 μM (orange circles) equivalent concentrations. (D) The 13C-edited 1D envelopes of 10 μM TF (green), in the presence of the αSyn RNC (blue) and the presence of 70S ribosomes (gray).
Fig. 4.
Fig. 4.
Structural modeling of the αSyn RNC. (A) Cross-section of the simulated αSyn RNC showing the NC ensemble (gray) with a representative NC structure highlighted (blue), ribosomal proteins (beige), and RNA (blue-gray). Observed NMR resonances (relative to isolated αSyn in the presence of 70S , Fig. 1E) are shown as spheres colored according to their relative intensity (Fig. 1E). (B) αSyn RNC model with TF monomer (light green) and substrate binding pockets (21) (dark green); the observed NC resonances are shown as spheres colored according to the relative intensity in Fig. 3B. For clarity, residues 1–31 are not shown. (C) Amide S2 order parameters determined from simulated ensembles with and without TF. (D) Cα RMSF of the αSyn RNC calculated over increasing lengths of the simulation trajectory, with and without TF. (E) Ribosome surface colored according to the distance of closest approach of the simulated NCs and (F) ribosome and TF surfaces colored as described in E. (G) Difference in ribosome surface accessibility (distance of closest approach) on TF binding. Blue regions become sterically restricted, whereas red regions represent parts of the ribosome surface that are more frequently contacted by the NC due to the steric restrictions imposed by TF on other parts of the ribosome surface. (H) Schematic diagram of ribosomal proteins in close proximity to the exit tunnel; ribosome orientation as in EG.

References

    1. Liang ST, Xu YC, Dennis P, Bremer H. mRNA composition and control of bacterial gene expression. J Bacteriol. 2000;182(11):3037–3044. - PMC - PubMed
    1. Bhushan S, et al. α-Helical nascent polypeptide chains visualized within distinct regions of the ribosomal exit tunnel. Nat Struct Mol Biol. 2010;17(3):313–317. - PubMed
    1. Lu J, Deutsch C. Secondary structure formation of a transmembrane segment in Kv channels. Biochemistry. 2005;44(23):8230–8243. - PubMed
    1. Ciryam P, Morimoto RI, Vendruscolo M, Dobson CM, O’Brien EP. In vivo translation rates can substantially delay the cotranslational folding of the Escherichia coli cytosolic proteome. Proc Natl Acad Sci USA. 2013;110(2):E132–E140. - PMC - PubMed
    1. Zhang G, Ignatova Z. Folding at the birth of the nascent chain: Coordinating translation with co-translational folding. Curr Opin Struct Biol. 2011;21(1):25–31. - PubMed

Publication types

Substances

LinkOut - more resources