. 2016 May 3;113(18):5036-40.
doi: 10.1073/pnas.1521478113. Epub 2016 Apr 18.

Dinosaurs in decline tens of millions of years before their final extinction

Affiliations

Dinosaurs in decline tens of millions of years before their final extinction

Manabu Sakamoto et al. Proc Natl Acad Sci U S A. .

Abstract

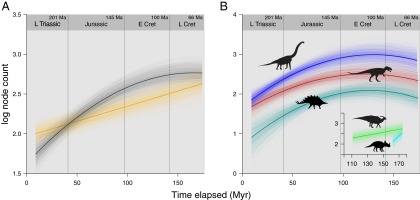
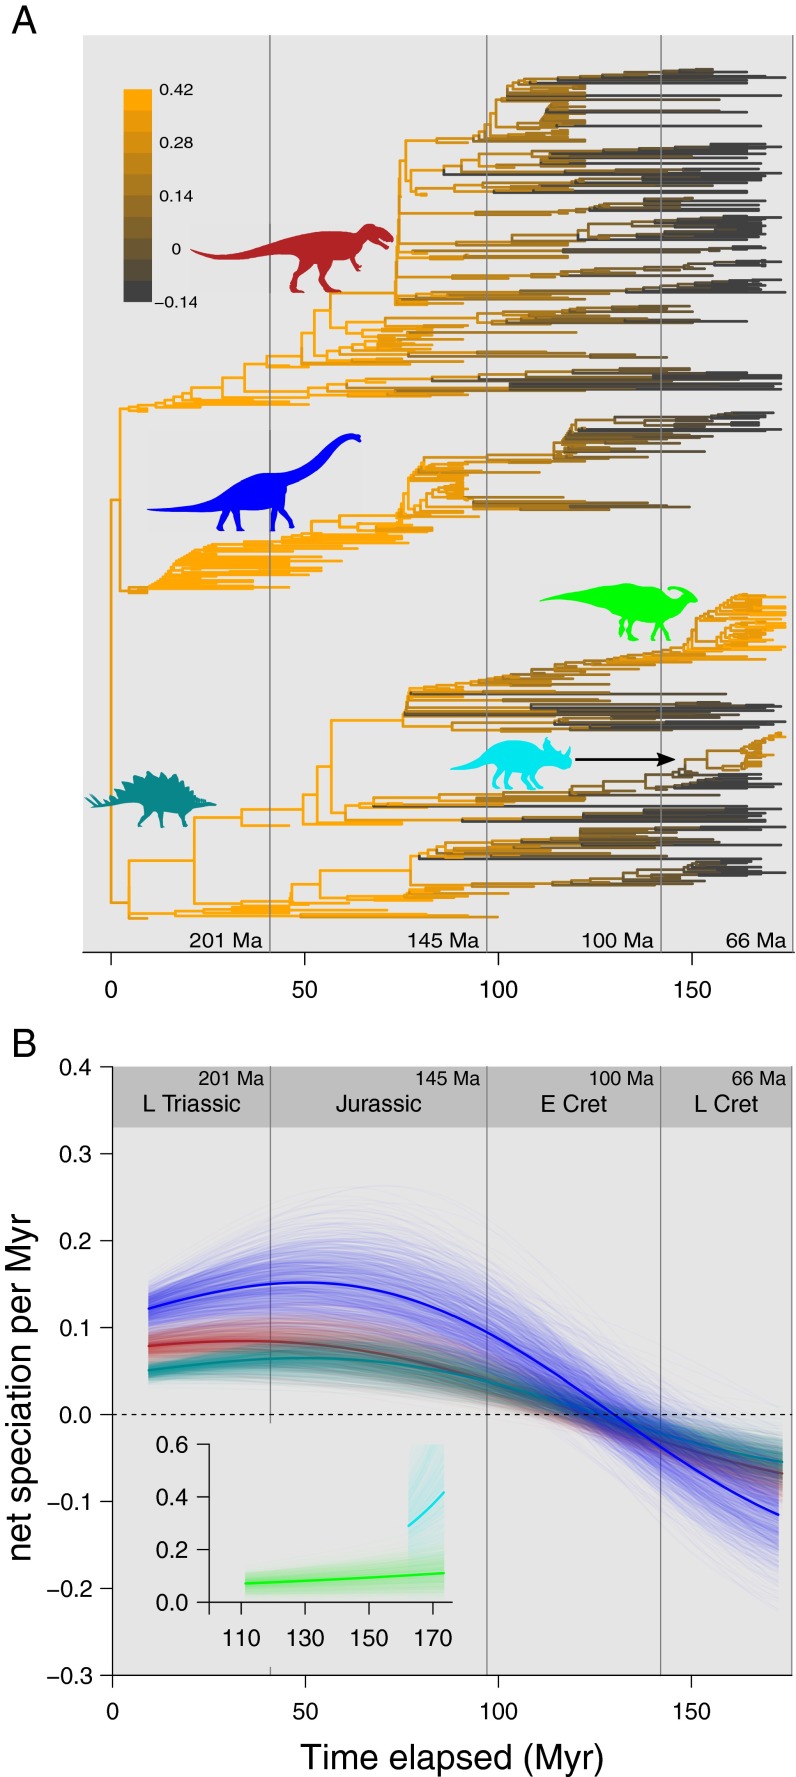
Whether dinosaurs were in a long-term decline or whether they were reigning strong right up to their final disappearance at the Cretaceous-Paleogene (K-Pg) mass extinction event 66 Mya has been debated for decades with no clear resolution. The dispute has continued unresolved because of a lack of statistical rigor and appropriate evolutionary framework. Here, for the first time to our knowledge, we apply a Bayesian phylogenetic approach to model the evolutionary dynamics of speciation and extinction through time in Mesozoic dinosaurs, properly taking account of previously ignored statistical violations. We find overwhelming support for a long-term decline across all dinosaurs and within all three dinosaurian subclades (Ornithischia, Sauropodomorpha, and Theropoda), where speciation rate slowed down through time and was ultimately exceeded by extinction rate tens of millions of years before the K-Pg boundary. The only exceptions to this general pattern are the morphologically specialized herbivores, the Hadrosauriformes and Ceratopsidae, which show rapid species proliferations throughout the Late Cretaceous instead. Our results highlight that, despite some heterogeneity in speciation dynamics, dinosaurs showed a marked reduction in their ability to replace extinct species with new ones, making them vulnerable to extinction and unable to respond quickly to and recover from the final catastrophic event.

Keywords: Bayesian methods; dinosaurs; evolution; phylogeny; speciation.


Conflict of interest statement

The authors declare no conflict of interest.

Figures

Fig. 1.
Fig. 1.
Theoretical models of speciation through time. If speciation and extinction rate were constant through time (but speciation was higher) in dinosaurian history, we would expect to see a linear increase through time in the logarithm of the number of speciation events along each path of a phylogenetic tree (model A). If speciation rate decreased through time but remained above extinction rate, then we would expect a curvilinear relationship (models B and C). Such a relationship would reach an asymptote (speciation equals extinction; model B) and eventually, turn down as extinction rate surpassed speciation during the evolutionary history of the clade (model C). The latter would correspond to a long-term pre–K-Pg demise in the case of dinosaurs.
Fig. 2.
Fig. 2.
Model predictions of speciation through time in Mesozoic dinosaurs. (A) Compared with the linear model (orange), the quadratic model displaying a speciation slowdown (dark gray) substantially improves model fit (ΔDIC > 4). (B) This pattern holds true in the three major clades [Ornithischia (green), Sauropodomorpha (blue), and Theropoda (red)] and further improves model fit. (B, Inset) Model fit significantly improves when separate model parameters are estimated for the ornithischian subclades Hadrosauriformes (light green) and Ceratopsidae (light blue) from other ornithischians, but the slowdown and downturn are not observed for the two Cretaceous ornithischian subclades. Posterior predictions (transparent lines) show the uncertainties in the model. Mean posterior values are shown as bold lines. Vertical lines indicate major stratigraphic boundaries (with their ages in millions of years ago). Silhouettes courtesy of PhyloPic.org (CC BY 3.0) and Jack Mayer Wood (Parasaurolophus), Mathew Wedel (Brachiosaurus), Andrew A. Farke (Stegosaurus and Centrosaurus), and Martin Kevil (Carcharodontosaurus). E Cret, Early Cretaceous; L Cret, Late Cretaceous; L Triassic, Late Triassic.
Fig. 3.
Fig. 3.
Net speciation per 1 My through time in Mesozoic dinosaurs. Net speciation per 1 My can be calculated from model predictions (Fig. 2B) as differences between intervals (here, per 1 My). (A) Each branch of a dinosaurian phylogeny was assigned a net speciation per 1-My value based on its temporal location and group membership and plotted on a color gradient. Earlier branches have higher net speciation per 1 My (orange), whereas later branches have lower net speciation per 1 My (dark gray), except in Hadrosauriformes and Ceratopsidae, in which net speciation per 1 My increases with time. (B) The three major dinosaur groups [Sauropodomorpha (blue), Theropods (red), and nonhadrosauriform, nonceratopsid Ornithischia (green)] show an early onset of speciation slowdown until the middle of the Early Cretaceous, when speciation rates are exceeded by extinction rate (net speciation per 1 My falls below zero; dashed horizontal line). Values above zero indicate increases in species counts, whereas those below zero indicate decreases in species counts. (B, Inset) Hadrosauriforms (light green) show a slow increase in net speciation per 1 My through time, whereas ceratopsians (light blue) show a highly variable but on average, rapid increase toward the end of the Cretaceous. Posterior predictions (transparent lines) show the uncertainties in the model. Mean posterior values are shown as bold lines. Vertical lines indicate major stratigraphic boundaries (with their ages in millions of years ago) like those in Fig. 2. Silhouettes courtesy of PhyloPic.org (CC BY 3.0) and Jack Mayer Wood (Parasaurolophus), Mathew Wedel (Brachiosaurus), Andrew A. Farke (Stegosaurus and Centrosaurus), and Martin Kevil (Carcharodontosaurus). E Cret, Early Cretaceous; L Cret, Late Cretaceous; L Triassic, Late Triassic.

References

    1. Sloan RE, Rigby JK, Jr, VAN Valen LM, Gabriel D. Gradual dinosaur extinction and simultaneous ungulate radiation in the hell creek formation. Science. 1986;232(4750):629–633. - PubMed
    1. Dodson P. Counting dinosaurs: How many kinds were there? Proc Natl Acad Sci USA. 1990;87(19):7608–7612. - PMC - PubMed
    1. Sarjeant WAS, Currie PJ. The “Great Extinction” that never happened: The demise of the dinosaurs considered. Can J Earth Sci. 2001;38(2):239–247.
    1. Fastovsky DE, et al. Shape of Mesozoic dinosaur richness. Geology. 2004;32(10):877–880.
    1. Sullivan RM. The shape of Mesozoic dinosaur richness: A reassessment. N M Museum Natural Hist Sci Bull. 2006;35:403–405.

Publication types