Comment
. 2016 May 24;113(21):E3029-38.
doi: 10.1073/pnas.1517275113. Epub 2016 Apr 18.

Fasting induces a form of autonomic synaptic plasticity that prevents hypoglycemia

Affiliations
Comment

Fasting induces a form of autonomic synaptic plasticity that prevents hypoglycemia

Manqi Wang et al. Proc Natl Acad Sci U S A. .

Abstract

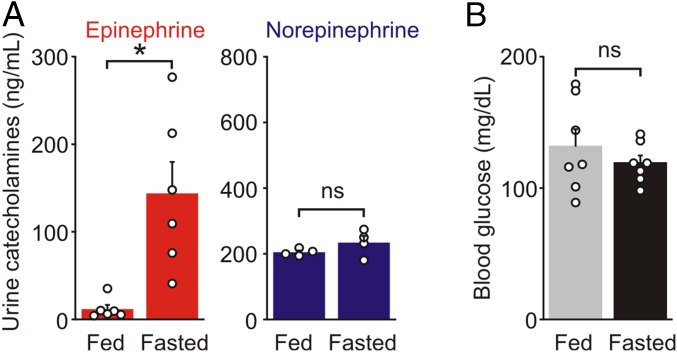
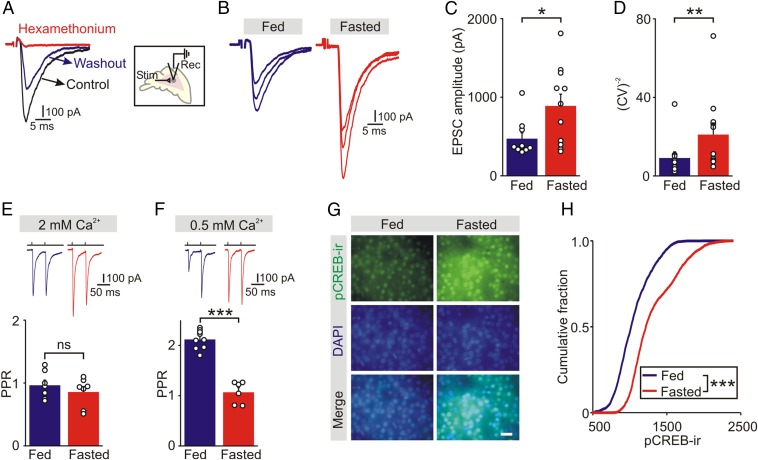
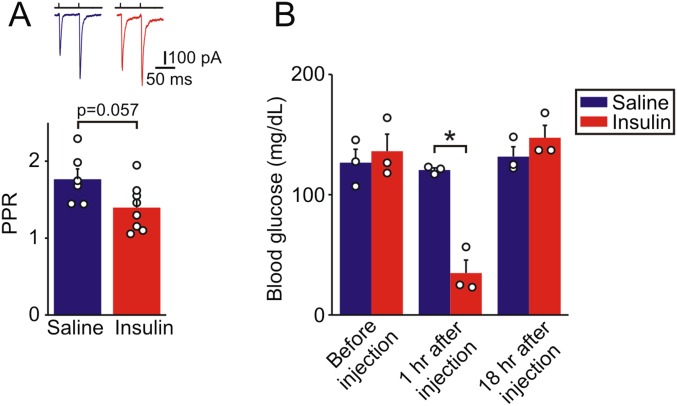
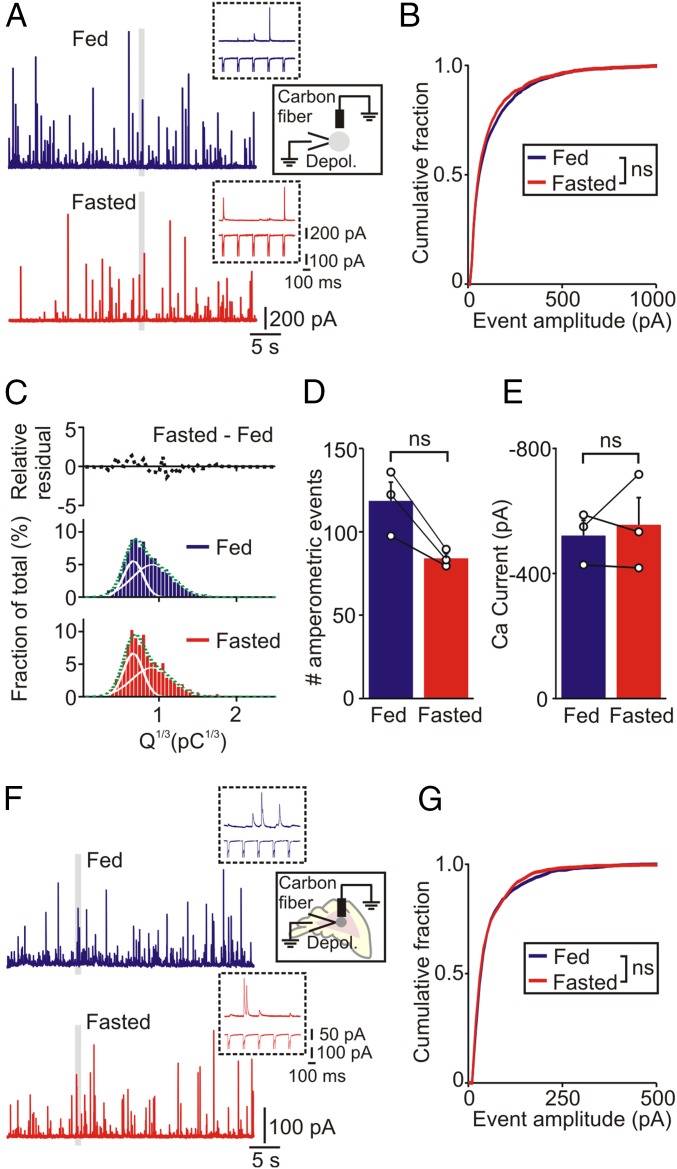
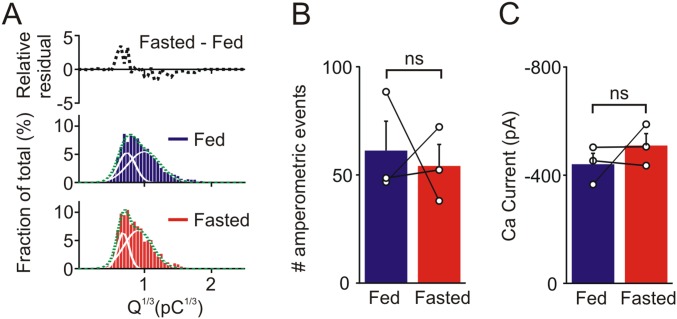
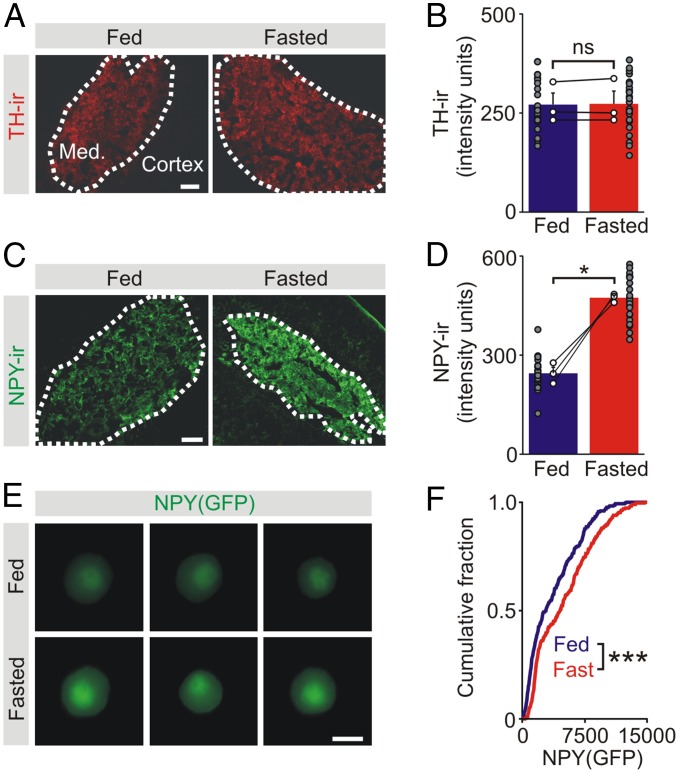
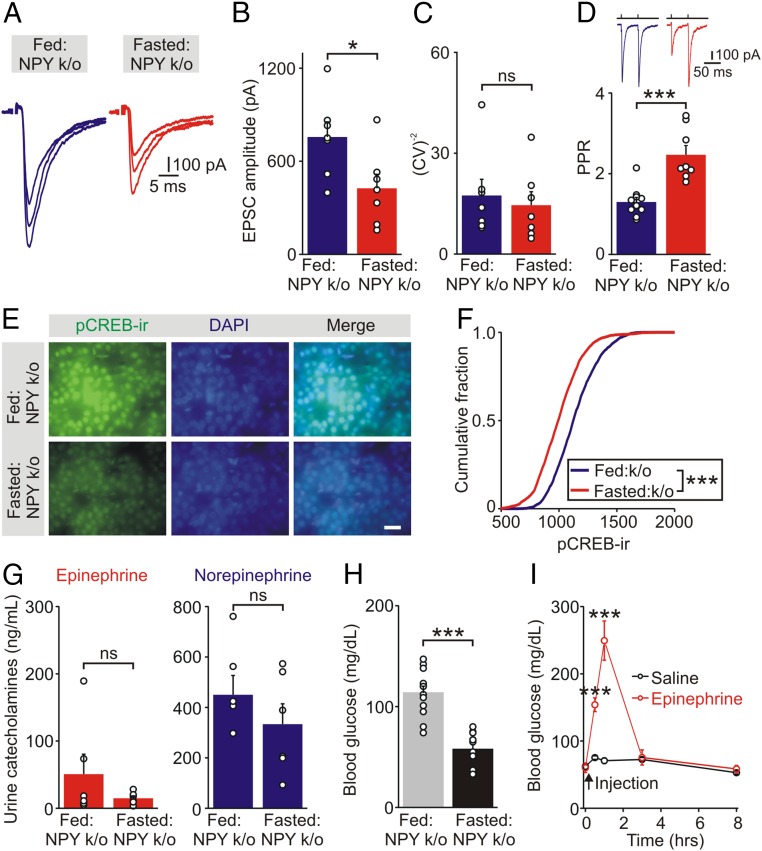
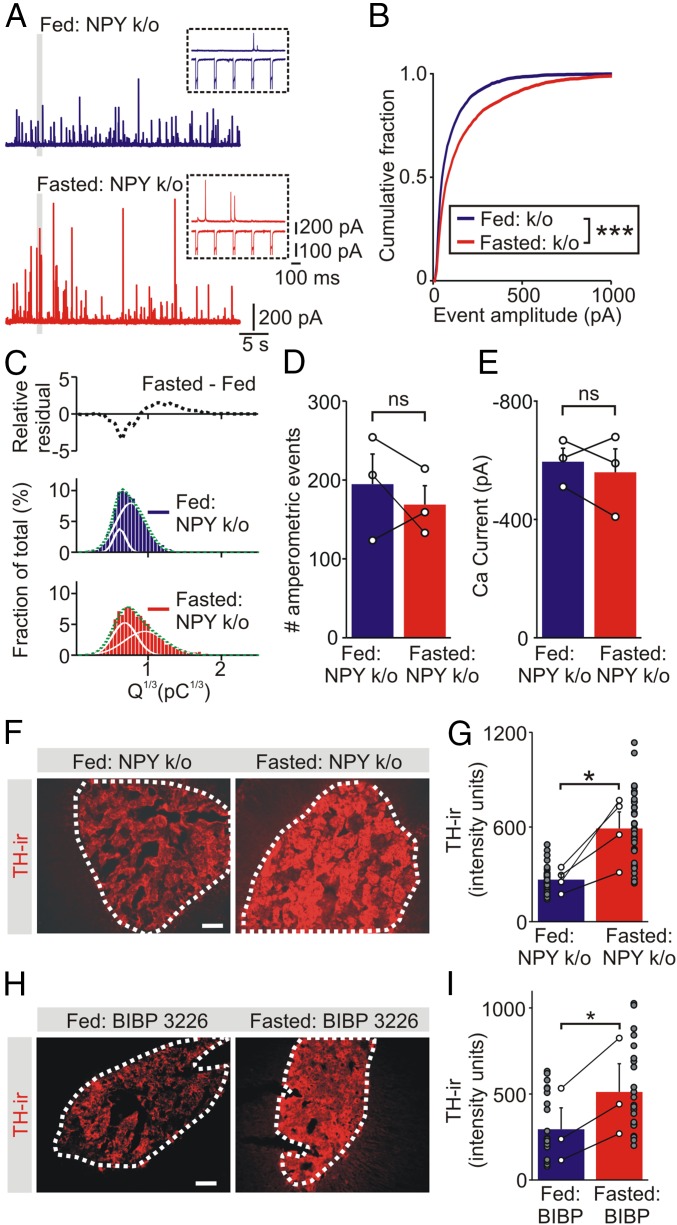
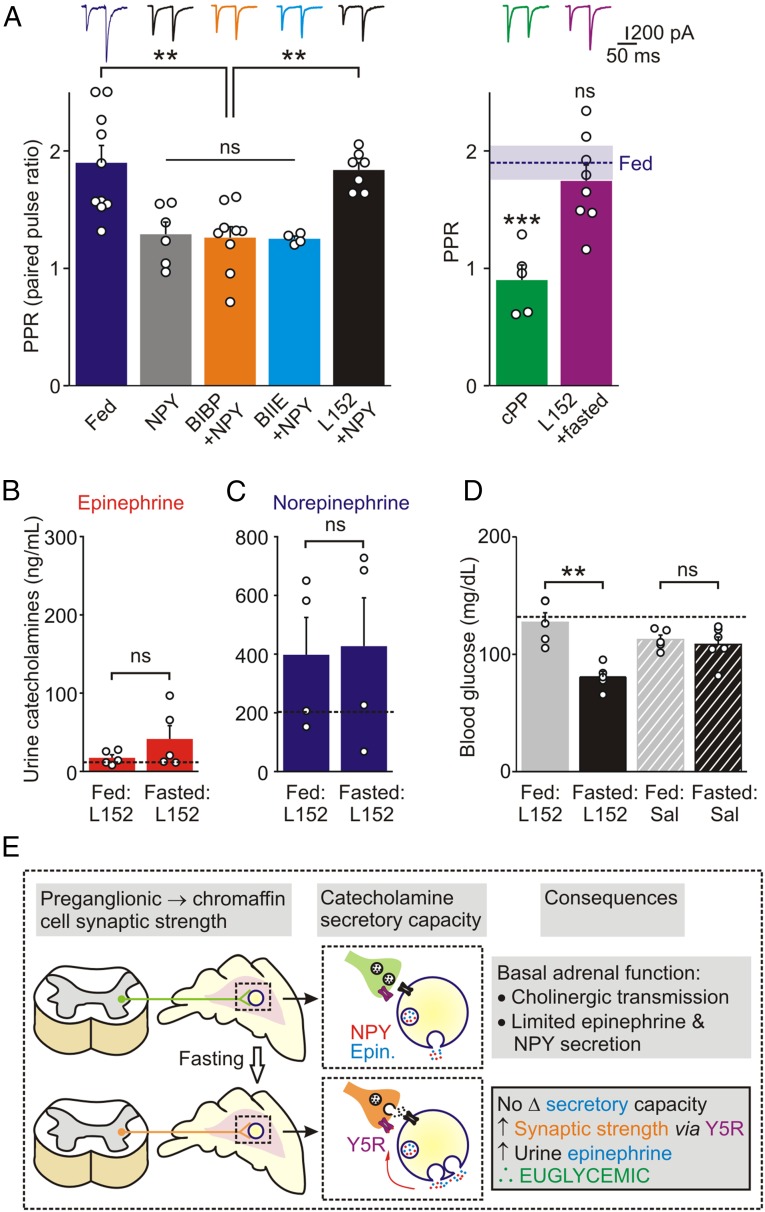
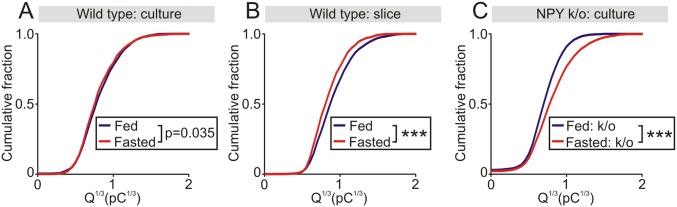
During fasting, activation of the counter-regulatory response (CRR) prevents hypoglycemia. A major effector arm is the autonomic nervous system that controls epinephrine release from adrenal chromaffin cells and, consequently, hepatic glucose production. However, whether modulation of autonomic function determines the relative strength of the CRR, and thus the ability to withstand food deprivation and maintain euglycemia, is not known. Here we show that fasting leads to altered transmission at the preganglionic → chromaffin cell synapse. The dominant effect is a presynaptic, long-lasting increase in synaptic strength. Using genetic and pharmacological approaches we show this plasticity requires neuropeptide Y, an adrenal cotransmitter and the activation of adrenal Y5 receptors. Loss of neuropeptide Y prevents a fasting-induced increase in epinephrine release and results in hypoglycemia in vivo. These findings connect plasticity within the sympathetic nervous system to a physiological output and indicate the strength of the final synapse in this descending pathway plays a decisive role in maintaining euglycemia.

Keywords: adrenal; autonomic nervous system; chromaffin cells; hypoglycemia; synaptic plasticity.


Conflict of interest statement

The authors declare no conflict of interest.

Figures

Fig. 1.
Fig. 1.
Food deprivation activates the sympatho-adrenal system. (A) Food deprivation increased urine epinephrine but did not change urine norepinephrine levels in wild-type mice (mean ± SEM, n = 4–6). (B) Blood glucose levels were not significantly different between fed and fasted littermates (mean ± SEM, n = 7). *P < 0.05; ns, not significant.
Fig. 2.
Fig. 2.
Food deprivation increases the strength of the preganglionic → chromaffin cell synapse in wild-type mice. (A) EPSCs recorded in a chromaffin cell evoked by stimulating the preganglionic nerve terminals were blocked in the presence of 100 μM hexamethonium chloride, a cholinergic antagonist, and recovered during washout. (B) Examples of evoked EPSCs recorded in adrenal slices from fed and fasted littermates. (C) Group data show that food deprivation increased the amplitude of evoked EPSCs (mean ± SEM, fed, n = 10 cells from 5 animals; fasted, n = 11 cells from 4 animals). Open symbols show the average EPSC value from each cell. (D) CV−2 of the EPSC amplitude was significantly greater in chromaffin cells from fasted compared with fed mice. (E) PPR of evoked EPSCs were similar in chromaffin cells from fed and fasted mice in ACSF containing 2 mM extracellular calcium (mean ± SEM, fed, n = 7 cells from 5 animals; fasted, n = 7 cells from three animals). (F) The PPR of EPSCs recorded in ACSF containing 0.5 mM extracellular calcium was significantly smaller in chromaffin cells from fasted compared with fed mice (mean ± SEM, fed, n = 9 cells from seven animals; fasted, n = 6 cells from 4 animals). (G) Examples of adrenal slices stained for pCREB from fed and fasted littermates. DAPI was used as a nuclear marker. (Scale bar, 20 μm.) (H) Cumulative intensity distributions of pCREB-ir in chromaffin cells from fed and fasted mice show that food deprivation led to an increase in pCREB-ir (fed: 1,845 cells; fasted: 1,820 cells; n = 3 separate experiments; Kolmogorov–Smirnov test). *P < 0.05, **P < 0.01, ***P < 0.001; ns, not significant.
Fig. S1.
Fig. S1.
Preganglionic → chromaffin cell synaptic strength following insulin-induced hypoglycemia. (A) PPR of evoked synaptic currents recorded in chromaffin cells from mice following insulin-induced hypoglycemia (n = 8 cells from 3 animals) or saline injection (n = 6 cells from 3 animals). Mice were fasted for 3 h then injected with either insulin (2.5 U/kg, i.p.) or vehicle. Food was returned 1 h after injection and mice were killed 18 h after injection. Insulin produced a decrease in PPR, although unlike fasting this did not reach statistical significance (P = 0.057), perhaps because of the transient hypoglycemia. (B) Insulin injection produced a fall in blood glucose levels compared with saline when measured 1 h after injection (121 ± 2 vs. 35 ± 11 mg/dL; mean ± SEM; P = 0.014, unpaired t test), confirming that this protocol did induce significant hypoglycemia. *P < 0.05.
Fig. 3.
Fig. 3.
Food deprivation does not alter the adrenal catecholamine secretory capacity. (A) Amperometric events evoked by a train of voltage clamp depolarizations from chromaffin cells in vitro from fed and fasted mice. Insets are excerpts from the regions indicated by the gray bars in A, showing amperometric events (Upper trace) and corresponding calcium currents (Lower trace) evoked by five depolarizations. (B) Cumulative amplitude distribution of amperometric events from fed and fasted mice (fed: 2,134 events; fasted: 1,513 events; n = 18 cells per condition from three paired experiments). (C) Cube root of event charge (from events plotted in B) fitted with two Gaussian distributions (solid lines). The relative residual distribution is the difference between the fed and fasted histograms. (D) Number of amperometric events evoked by a train of 200 voltage-clamp depolarizations and (E) amplitude of the voltage-dependent calcium current from cells from fed and fasted mice (mean ± SEM, n = 3 paired experiments, 6 cells per treatment in each experiment). (F) Amperometric events evoked by a train of voltage-clamp depolarizations (same protocol as A) from chromaffin cells in adrenal slices from fed and fasted mice. (G) Cumulative amplitude distribution of amperometric events recorded in slices from fed and fasted mice (fed: 1,239 events; fasted: 1,065 events; n = 20 cells per condition from three paired experiments). ns, not significant.
Fig. S2.
Fig. S2.
Effect of food deprivation on catecholamine secretion in adrenal slices. (A) Cube root of amperometric event charge (from events plotted in Fig. 3G) fitted with two Gaussian distributions (solid lines). The relative residual distribution is the difference between the fed and fasted histograms. (B) Number of amperometric events and (C) amplitude of the voltage-dependent calcium current from cells from fed and fasted mice (mean ± SEM, n = 3 paired experiments, 6–7 cells per treatment in each experiment). ns, not significant.
Fig. 4.
Fig. 4.
Food deprivation increases the adrenal expression of NPY but not TH. (A) TH-ir in adrenal sections from fed and fasted mice. (Scale bar, 100 μm.) (B) Group data (open symbols are mean values from each animal) shows that food deprivation did not alter the levels of TH-ir (mean ± SEM, n = 3 independent experiments). Filled symbols show TH-ir in all analyzed cryosections. (C) NPY-ir in adrenal sections from fed and fasted mice. (Scale bar, 100 μm.) (D) Group data (open symbols) shows that food deprivation increased the levels of NPY-ir (mean ± SEM, n = 3 independent experiments). Filled symbols show NPY-ir in all analyzed cryosections. (E) Examples of GFP expression in chromaffin cells from fed and fasted NPY(GFP) BAC mice. (Scale bar, 10 μm.) (F) Cumulative frequency distributions showing food deprivation led to an increase in GFP expression in chromaffin cells (300 cells for each distribution, n = 3 separate experiments; Kolmogorov–Smirnov test). *P < 0.05, ***P < 0.001; ns, not significant.
Fig. 5.
Fig. 5.
Food deprivation-induced synaptic strengthening and epinephrine secretion are both absent in NPY knockout mice. (A) EPSCs recorded in chromaffin cells in adrenal slices from fed and fasted NPY knockout mice. (B) Group data show that food deprivation reduced the amplitude of EPSCs in NPY knockout mice (mean ± SEM, n = 7 cells from 3 animals in each group). Open symbols show the average EPSC value from each cell. (C) CV−2 of the EPSC amplitude was not significantly different between fed and fasted NPY knockout mice. (D) Food deprivation significantly increased the PPR of evoked EPSCs in NPY knockout mice recorded in ACSF containing 0.5 mM extracellular calcium (mean ± SEM, fed, n = 10 cells from 4 animals; fasted, n = 8 cells from 6 animals). (E) pCREB-ir in adrenal sections from fed and fasted NPY knockout mice. (Scale bar 20 μm.) (F) Cumulative intensity distributions of pCREB-ir show that food deprivation led to a decrease in pCREB-ir in NPY knockout mice (fed: 1,798 cells; fasted: 2,140 cells; n = 3 separate experiments; Kolmogorov–Smirnov test). (G) Urine levels of epinephrine (mean ± SEM, n = 6) and norepinephrine (n = 6) were not different between fed and fasted NPY knockout mice. (H) Food deprivation resulted in hypoglycemia in NPY knockout mice (mean ± SEM, n = 12). (I) Blood glucose levels in fasted (16 h) NPY knockout mice that received either epinephrine (2 mg/kg, i.p.) or saline injection. Blood glucose levels were monitored immediately before (0 h) and 0.5, 1, 3, 8 h after injection (mean ± SEM, n = 5; one-way ANOVA). *P < 0.05, ***P < 0.001; ns, not significant.
Fig. 6.
Fig. 6.
Food deprivation increases the adrenal secretory capacity in NPY knockout mice. (A) Amperometric events evoked by a train of voltage clamp depolarizations from chromaffin cells from fed and fasted NPY knockout mice. (Right) Excerpts from the regions indicated by the gray bars showing the response to five depolarizing steps. (Upper) Amperometric recording. (Lower) ICa. (B) Cumulative amplitude distribution of amperometric events from fed and fasted NPY knockout animals (fed: 3,710 events; fasted: 3,172 events; n = 17 cells per condition from 3 paired experiments). (C) Frequency distribution of the cube root of the amperometric spike charge from fed and fasted NPY knockout mice. The relative residual is the difference between the fed and fasted histograms. (D) Amperometric event number and (E) amplitude of the voltage-dependent calcium current from the control and experimental cells (mean ± SEM, n = 3 paired experiments, 6 to 7 cells per treatment in each experiment). (F) Examples of TH-ir in adrenal sections from fed and fasted NPY knockout (k/o) mice. (G) Group data (open symbols are mean values from each animal) shows that food deprivation led to an increase in the level of TH-ir (mean ± SEM, n = 4 independent experiments). Filled symbols show TH-ir in all analyzed cryosections. (H) TH-ir in adrenal sections from a pair of fed and fasted mice injected with BIBP3226 (Y1 receptor antagonist). (I) Group data (open symbols) shows that fasting significantly increased the level of TH-ir in BIBP3226-injected animals (mean ± SEM, n = 3 independent experiments). Filled symbols show TH-ir in all analyzed cryosections. (Scale bars, 100 μm.) *P < 0.05, ***P < 0.001; ns, not significant.
Fig. 7.
Fig. 7.
Y5 receptor activation regulates synaptic strength and epinephrine secretion during food deprivation. (A) PPR of EPSC’s in chromaffin cells in adrenal slices from fed mice (n = 10 cells from 5 animals) or in slices incubated in NPY (1 μM, n = 6 cells from 5 animals) or in NPY (1 μM) plus BIBP3226 (1 μM, Y1 antagonist, n = 9 cells from 4 animals); NPY plus BIIE0246 (100 nM, Y2 antagonist, n = 4 cells from 2 animals) or NPY plus L152,804 (5 μM, Y5 antagonist, n = 7 cells from 6 animals). Only the Y5 antagonist prevented the change in PPR induced by NPY (one-way ANOVA). Incubation of slices in the Y5 agonist cPP (1 μM, n = 5 cells from 5 animals) mimicked the actions of NPY as indicated by a significant reduction in PPR compared with fed mice. The fasting-induced decrease in the PPR was reversed when adrenal slices were incubated in L152,804 (5 μM, n = 8 cells from 3 animals), indicating that constitutive activation of adrenal Y5 receptors is required for fasting-induced synaptic plasticity. The PPR (mean ± SEM) in fed mice is shown as a horizontal bar (data from the Left). (B) Food deprivation did not increase urine levels of epinephrine (n = 5) or (C) norepinephrine (n = 4) in L152,804 (Y5 antagonist) injected wild-type mice. The black dashed lines in B and C show mean values of urine catecholamines in fed wild-type mice (data from Fig. 1A). (D) Blood glucose levels were significantly decreased following food deprivation in mice injected with L152,804 (n = 5) compared with fed mice (n = 5). Injection of vehicle did not alter blood glucose levels in fed or fasted mice (n = 5 and 6, respectively). Black dashed line shows the mean value of blood glucose levels in control wild type mice (data from Fig. 1B). Values are mean ± SEM; **P < 0.01, ***P < 0.001; ns, not significant. (E) Working model of the experimental results. Food deprivation strengthens the preganglionic → chromaffin cell synapse via a presynaptic mechanism involving Y5 receptors (also shown in a presynaptic location for simplicity). Following local release NPY may act in an autocrine (shown) or paracrine manner (because of the acinar-like distribution of chromaffin cells around local blood vessels). Although fasting does not alter the catecholamine secretory capacity, the NPY-dependent synaptic strengthening is required for epinephrine release during food deprivation. Epinephrine contributes to the maintenance of euglycemia by increasing hepatic glucose production. In NPY knockout mice, synaptic strengthening is absent, epinephrine release does not occur and consequently the animals are hypoglycemic.
Fig. S3.
Fig. S3.
Effect of food deprivation on catecholamine secretion from chromaffin cells in vitro and in situ. (A) Cumulative charge distribution of amperometric events from chromaffin cells in vitro from fed and fasted mice (from the same events used to generate Fig. 3B). (B) Cumulative charge distribution of amperometric events from cells in adrenal slices (Fig. 3G). (C) Cumulative charge distribution of amperometric events from cells in vitro from NPY knockout mice (Fig. 6B). ***P < 0.001.

Comment in

Comment on

Similar articles

Cited by

References

    1. Cryer PE. Mechanisms of hypoglycemia-associated autonomic failure in diabetes. N Engl J Med. 2013;369(4):362–372. - PubMed
    1. Watts AG, Donovan CM. Sweet talk in the brain: Glucosensing, neural networks, and hypoglycemic counterregulation. Front Neuroendocrinol. 2010;31(1):32–43. - PMC - PubMed
    1. Cryer PE. Glucose counterregulation: Prevention and correction of hypoglycemia in humans. Am J Physiol. 1993;264(2 Pt 1):E149–E155. - PubMed
    1. Routh VH, Hao L, Santiago AM, Sheng Z, Zhou C. Hypothalamic glucose sensing: Making ends meet. Front Syst Neurosci. 2014;8:236. - PMC - PubMed
    1. Sivitz WI, et al. Effect of acute and antecedent hypoglycemia on sympathetic neural activity and catecholamine responsiveness in normal rats. Diabetes. 2001;50(5):1119–1125. - PubMed

Publication types

MeSH terms

LinkOut - more resources