Review
. 2016 Apr 8:7:444.
doi: 10.3389/fpls.2016.00444. eCollection 2016.

Learning from Co-expression Networks: Possibilities and Challenges

Affiliations
Review

Learning from Co-expression Networks: Possibilities and Challenges

Elise A R Serin et al. Front Plant Sci. .

Abstract

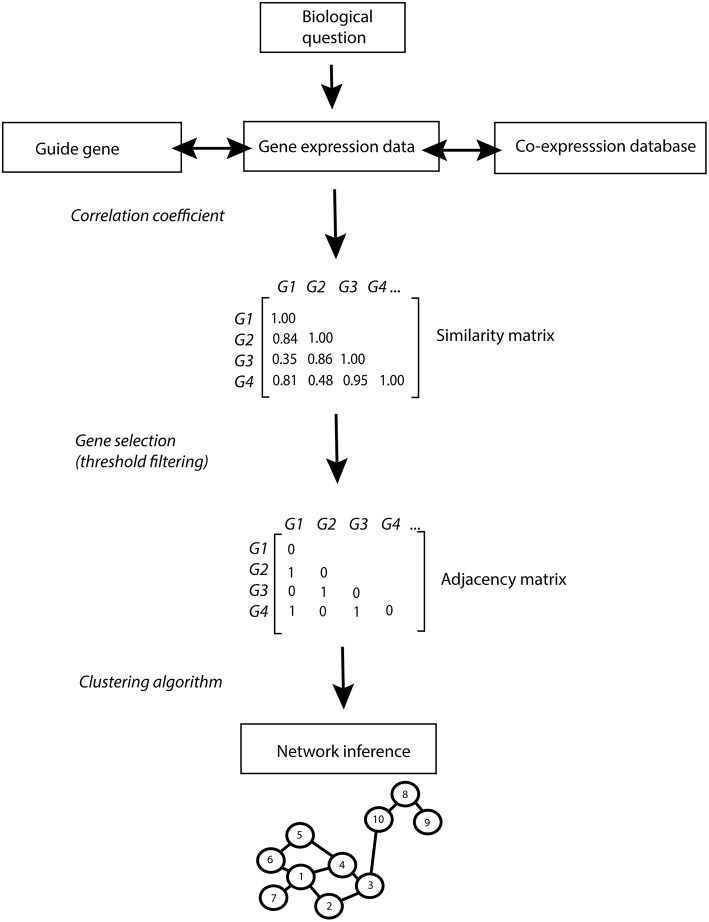
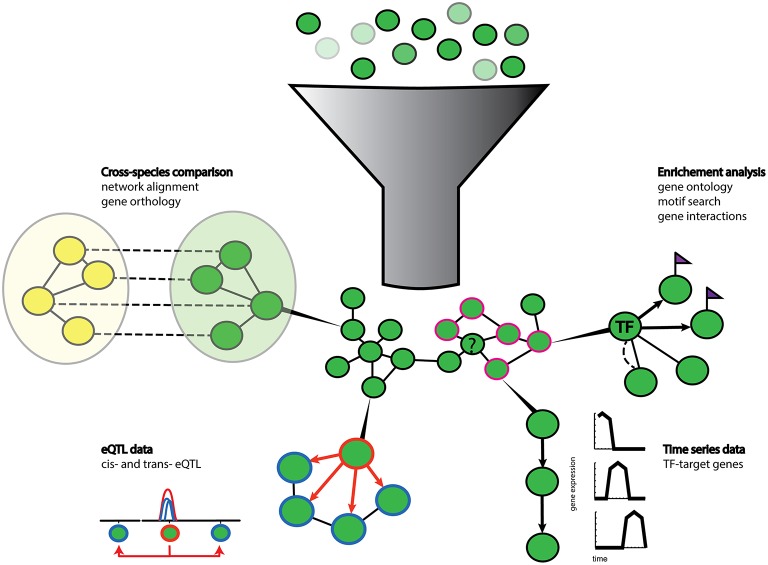
Plants are fascinating and complex organisms. A comprehensive understanding of the organization, function and evolution of plant genes is essential to disentangle important biological processes and to advance crop engineering and breeding strategies. The ultimate aim in deciphering complex biological processes is the discovery of causal genes and regulatory mechanisms controlling these processes. The recent surge of omics data has opened the door to a system-wide understanding of the flow of biological information underlying complex traits. However, dealing with the corresponding large data sets represents a challenging endeavor that calls for the development of powerful bioinformatics methods. A popular approach is the construction and analysis of gene networks. Such networks are often used for genome-wide representation of the complex functional organization of biological systems. Network based on similarity in gene expression are called (gene) co-expression networks. One of the major application of gene co-expression networks is the functional annotation of unknown genes. Constructing co-expression networks is generally straightforward. In contrast, the resulting network of connected genes can become very complex, which limits its biological interpretation. Several strategies can be employed to enhance the interpretation of the networks. A strategy in coherence with the biological question addressed needs to be established to infer reliable networks. Additional benefits can be gained from network-based strategies using prior knowledge and data integration to further enhance the elucidation of gene regulatory relationships. As a result, biological networks provide many more applications beyond the simple visualization of co-expressed genes. In this study we review the different approaches for co-expression network inference in plants. We analyse integrative genomics strategies used in recent studies that successfully identified candidate genes taking advantage of gene co-expression networks. Additionally, we discuss promising bioinformatics approaches that predict networks for specific purposes.

Keywords: co-expression; gene expression; gene networks; gene prioritization; transcriptomics.


Figures

Figure 1
Figure 1
Co-expression network inference pipeline. The biological question addressed drives the strategy for the co-expression network analysis: prior knowledge can be used to identify guide-genes and co-expression databases can be queried to investigate gene co-expression patterns across multiple conditions. Similarity in gene expression patterns is calculated using correlation coefficients (Pearson, Spearman…). A user defined threshold (in this example set at 0.8) enables the selection of genes with high co-expression scores. Significantly co-expressed genes are reported in the binary adjacency matrix as 1. A clustering algorithm is applied on the adjacency matrix to infer networks of significantly co-expressed genes. In the resulting network, significantly co-expressed genes are depicted as numbered nodes (vertices) linked by edges (links). The length of the edges is relative to the expression similarity of the connected genes, with a short edge corresponding to a high co-expression value. A “path” corresponds to the number of edges connecting two nodes (the shortest path from node 9 to 4 is 4 edges). Hubs are identified as highly connected nodes (node 1) and group of connected genes form modules (nodes 1–7). Network properties can be described by different parameters such as: •The connectivity of a network corresponds to the total number of links in the network. •The node degree corresponds to the number of connections of a node with other nodes in the network (node 4 has a node degree of 3). •The betweenness of a node corresponds to the sum of the shortest paths connecting all pair of nodes in the network, passing through that specific node. The betweenness of node 8 corresponds to the sum of the shortest path the connecting node 10–9, 3–9, 4–9 etc…).
Figure 2
Figure 2
Schematic representation of gene prioritization strategies. Gene sets of different expression values (shades of green) are used for co-expression network inference. Genes with co-expression values above a user defined threshold (dark green nodes) form nodes and edges in the network. Various additional data can then be used to enrich and extract biological relevant information from the network. Enrichment analysis tools such as gene ontology terms (pink contour nodes) can be used to functionally annotate unknown genes (question marked node) clustered in the vicinity. Prior knowledge can also help to highlight known gene-gene interactions (dotted line) and cis-regulatory motif (purple flags) can suggest local regulatory interactions (arrows) between transcription factors (TF node) and their target genes (flagged nodes). Gene regulatory relationships can also be extracted from time series data. Algorithms can extract causal regulatory relationships from shifted gene expression patterns in time series data. Co-localization of trans- and cis-eQTLs (hotspots) can also infer regulatory relationships between genes with a cis-eQTL (orange contour node) and genes with trans-eQTLs (blue contour node). Additional information can be gained from comparisons with networks of other species (yellow nodes) by orthology and network alignment (dotted lines).

References

    1. Albert R. (2005). Scale-free networks in cell biology. J. Cell Sci. 118, 4947–4957. 10.1242/jcs.02714 - DOI - PubMed
    1. Alon U. (2007). Network motifs: theory and experimental approaches. Nat. Rev. Genet. 8, 450–461. 10.1038/nrg2102 - DOI - PubMed
    1. Aoki K., Ogata Y., Shibata D. (2007). Approaches for extracting practical information from gene co-expression networks in plant biology. Plant Cell Physiol. 48, 381–390. 10.1093/pcp/pcm013 - DOI - PubMed
    1. Ashburner M., Ball C. A., Blake J. A., Bolstein D., Butler H., Cherry J. M., et al. . (2000). Gene ontology: tool for unification of biology. Nat. Genet. 25, 25–29. 10.1038/75556 - DOI - PMC - PubMed
    1. Atias O., Chor B., Chamovitz D. A. (2009). Large-scale analysis of Arabidopsis transcription reveals a basal co-regulation network. BMC Syst. Biol. 3:86. 10.1186/1752-0509-3-86 - DOI - PMC - PubMed