

Trait changes induced by species interactions in two phenotypically distinct strains of a marine dinoflagellate
- PMID: 27093044
- PMCID: PMC5113847
- DOI: 10.1038/ismej.2016.57
Trait changes induced by species interactions in two phenotypically distinct strains of a marine dinoflagellate
Abstract
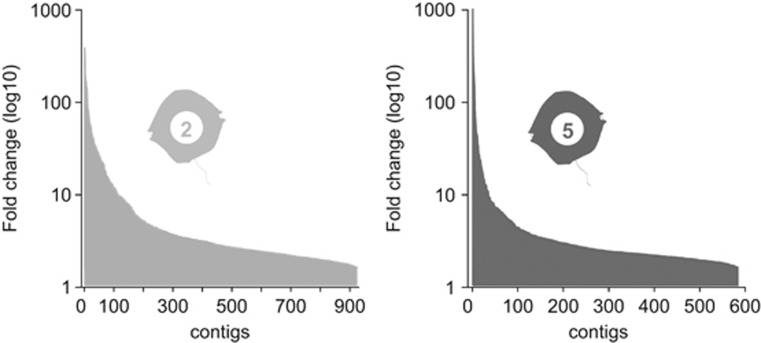
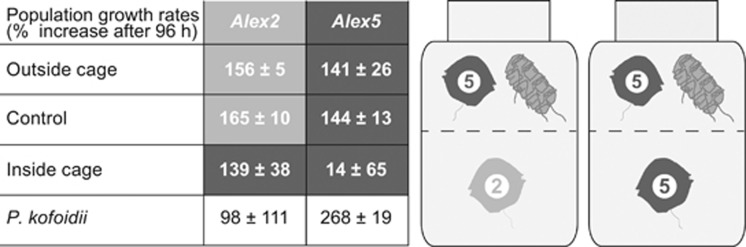
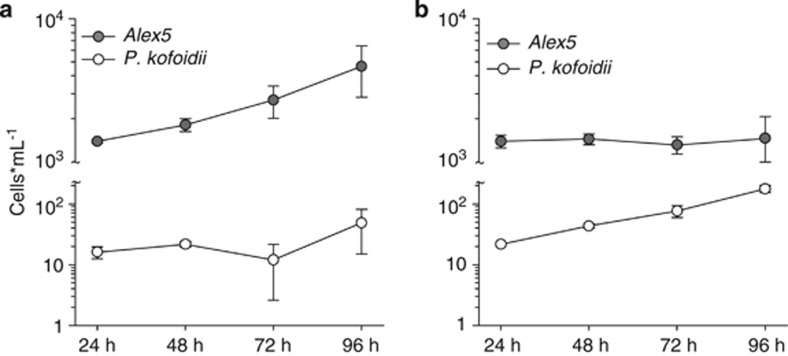
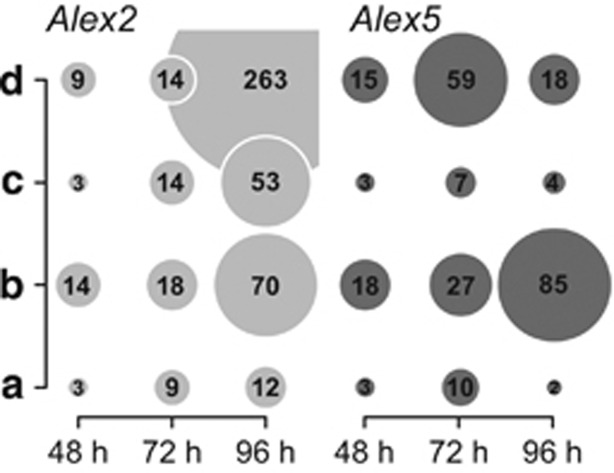
Populations of the toxigenic marine dinoflagellate Alexandrium are composed of multiple genotypes that display phenotypic variation for traits known to influence top-down processes, such as the ability to lyse co-occurring competitors and prospective grazers. We performed a detailed molecular analysis of species interactions to determine how different genotypes perceive and respond to other species. In a controlled laboratory culture study, we exposed two A. fundyense strains that differ in their capacity to produce lytic compounds to the dinoflagellate grazer Polykrikos kofoidii, and analyzed transcriptomic changes during this interaction. Approximately 5% of all analyzed genes were differentially expressed between the two Alexandrium strains under control conditions (without grazer presence) with fold-change differences that were proportionally higher than those observed in grazer treatments. Species interactions led to the genotype-specific expression of genes involved in endocytotic processes, cell cycle control and outer membrane properties, and signal transduction and gene expression regulatory processes followed similar patterns for both genotypes. The genotype-specific trait changes observed in this study exemplify the complex responses to chemically mediated species interactions within the plankton and their regulation at the gene level.
Figures
Similar articles
-
Predator cues reduce intraspecific trait variability in a marine dinoflagellate.BMC Ecol. 2017 Feb 27;17(1):8. doi: 10.1186/s12898-017-0119-y. BMC Ecol. 2017. PMID: 28241803 Free PMC article.
-
Intraspecific facilitation by allelochemical mediated grazing protection within a toxigenic dinoflagellate population.Proc Biol Sci. 2015 Jan 7;282(1798):20141268. doi: 10.1098/rspb.2014.1268. Proc Biol Sci. 2015. PMID: 25411447 Free PMC article.
-
Mixotrophy in the newly described phototrophic dinoflagellate Woloszynskia cincta from western Korean waters: feeding mechanism, prey species and effect of prey concentration.J Eukaryot Microbiol. 2011 Mar-Apr;58(2):152-70. doi: 10.1111/j.1550-7408.2011.00531.x. Epub 2011 Feb 18. J Eukaryot Microbiol. 2011. PMID: 21332876
-
Global transcriptional profiling of the toxic dinoflagellate Alexandrium fundyense using Massively Parallel Signature Sequencing.BMC Genomics. 2006 Apr 25;7:88. doi: 10.1186/1471-2164-7-88. BMC Genomics. 2006. PMID: 16638123 Free PMC article.
-
Transcriptomic profiling of Alexandrium fundyense during physical interaction with or exposure to chemical signals from the parasite Amoebophrya.Mol Ecol. 2016 Mar;25(6):1294-307. doi: 10.1111/mec.13566. Epub 2016 Feb 24. Mol Ecol. 2016. PMID: 26841307
Cited by
-
Microbial arms race: Ballistic "nematocysts" in dinoflagellates represent a new extreme in organelle complexity.Sci Adv. 2017 Mar 31;3(3):e1602552. doi: 10.1126/sciadv.1602552. eCollection 2017 Mar. Sci Adv. 2017. PMID: 28435864 Free PMC article.
-
Transcriptomic responses to grazing reveal the metabolic pathway leading to the biosynthesis of domoic acid and highlight different defense strategies in diatoms.BMC Mol Biol. 2019 Feb 26;20(1):7. doi: 10.1186/s12867-019-0124-0. BMC Mol Biol. 2019. PMID: 30808304 Free PMC article.
-
Grazer-induced transcriptomic and metabolomic response of the chain-forming diatom Skeletonema marinoi.ISME J. 2018 Jun;12(6):1594-1604. doi: 10.1038/s41396-018-0094-0. Epub 2018 Mar 29. ISME J. 2018. PMID: 29599523 Free PMC article.
-
Predator cues reduce intraspecific trait variability in a marine dinoflagellate.BMC Ecol. 2017 Feb 27;17(1):8. doi: 10.1186/s12898-017-0119-y. BMC Ecol. 2017. PMID: 28241803 Free PMC article.
-
Does periphyton turn less palatable under grazing pressure?ISME Commun. 2024 Nov 19;4(1):ycae146. doi: 10.1093/ismeco/ycae146. eCollection 2024 Jan. ISME Commun. 2024. PMID: 39759835 Free PMC article.
References
-
- Adler FR, Karban R. (1994). Defended fortresses or moving targets? Another model of inducible defenses inspired by military metaphors. Am Nat 5: 813–832.
-
- Alberts B, Johnson A, Lewis J, Raff M, Roberts K, Walter P. (2008). Molecular Biology of the Cell: Reference Edition: 1601.
-
- Alpermann TJ, Tillmann U, Beszteri B, Cembella AD, John U. (2010). Phenotypic variation and genotypic diversity in a planktonic population of the toxigenic marine dinoflagellate Alexandrium tamarense (Dinophyceae). J Phycol 46: 18–32.
-
- Amin SA, Hmelo LR, van Tol HM, Durham BP, Carlson LT, Heal KR et al. (2015). Interaction and signalling between a cosmopolitan phytoplankton and associated bacteria. Nature 522: 98–101. - PubMed
MeSH terms
LinkOut - more resources
Full Text Sources
Other Literature Sources
