. 2016 Apr 18;37(2):174-189.
doi: 10.1016/j.devcel.2016.03.023.

Polo Kinase Phosphorylates Miro to Control ER-Mitochondria Contact Sites and Mitochondrial Ca(2+) Homeostasis in Neural Stem Cell Development

Affiliations

Polo Kinase Phosphorylates Miro to Control ER-Mitochondria Contact Sites and Mitochondrial Ca(2+) Homeostasis in Neural Stem Cell Development

Seongsoo Lee et al. Dev Cell. .

Abstract

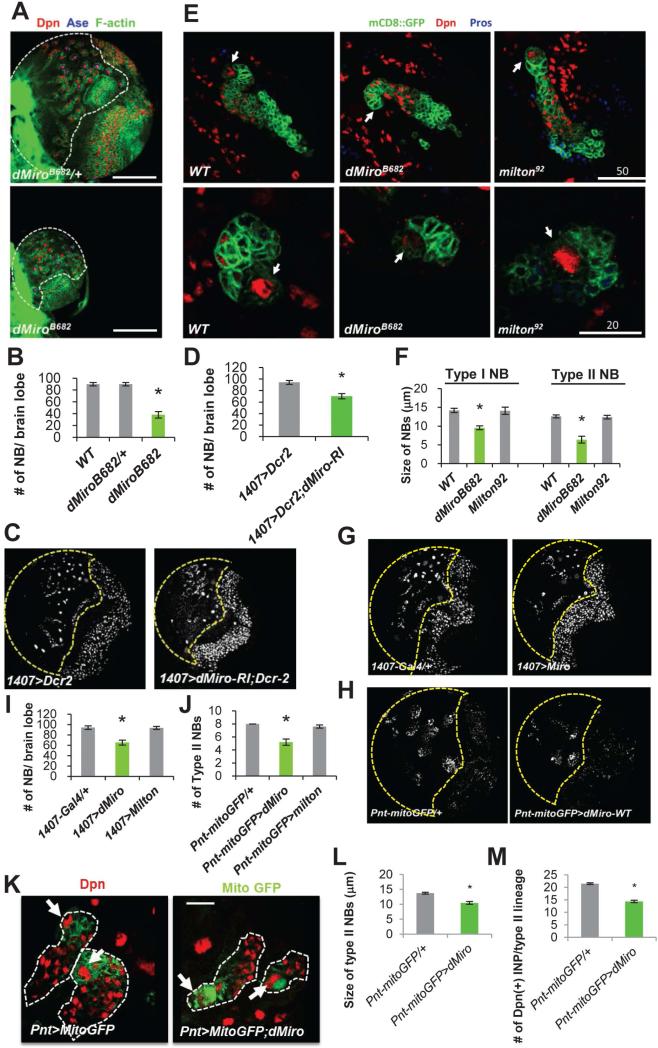
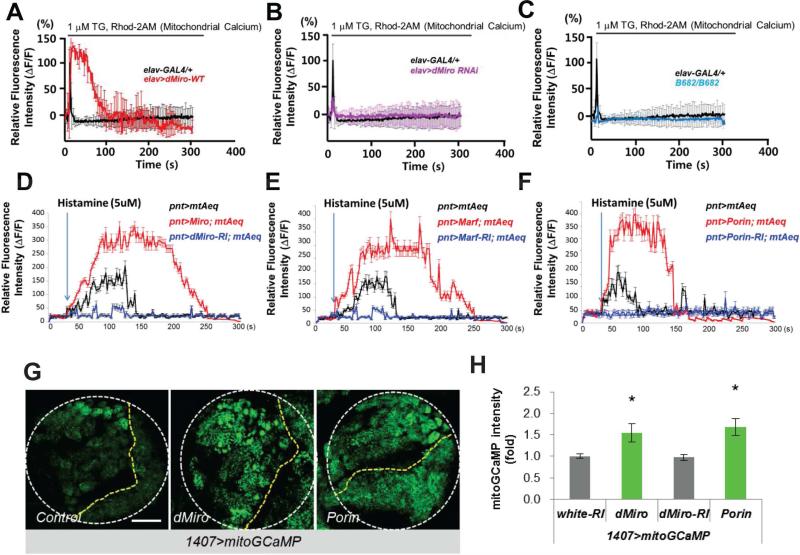
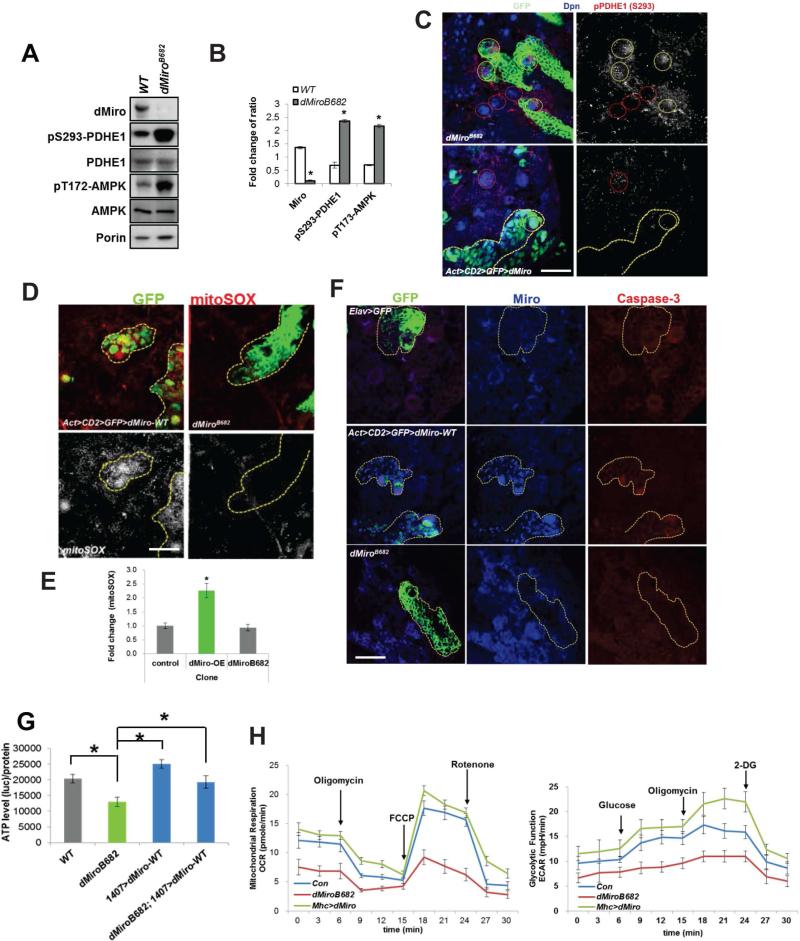
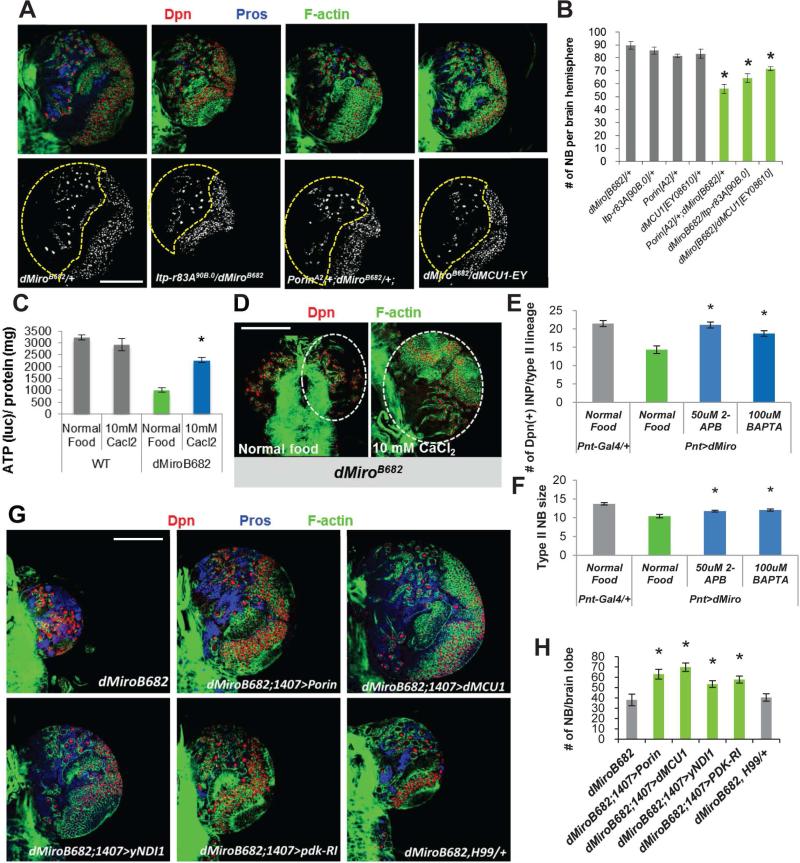
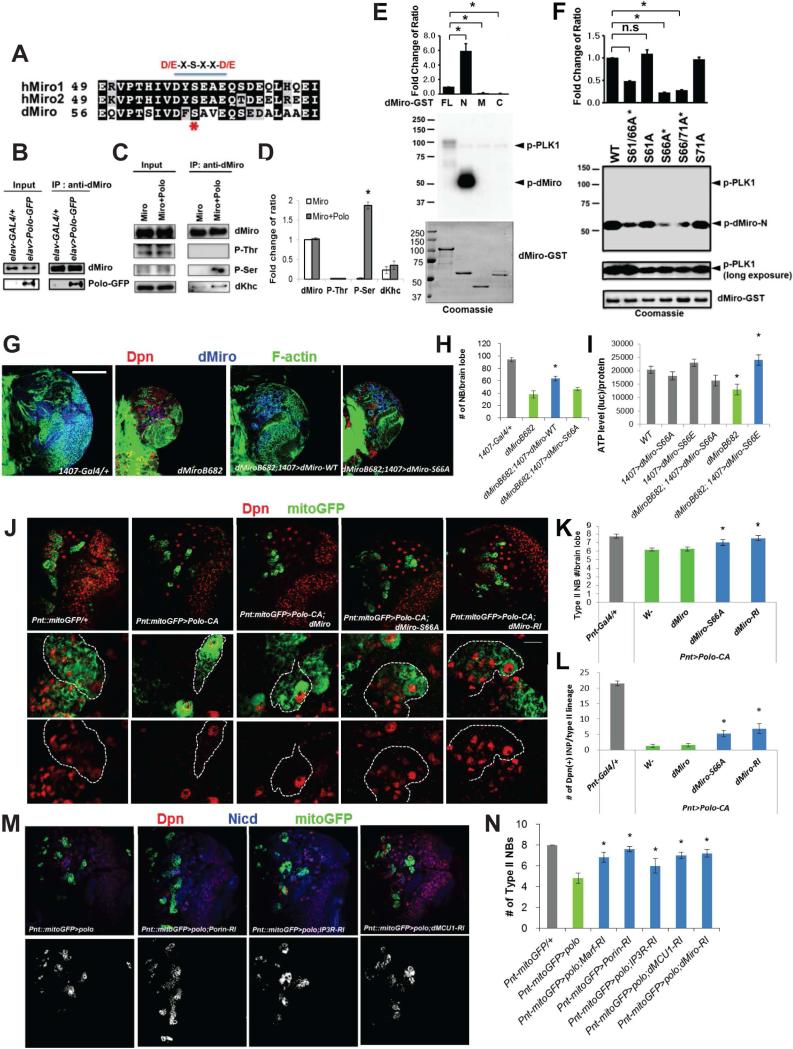
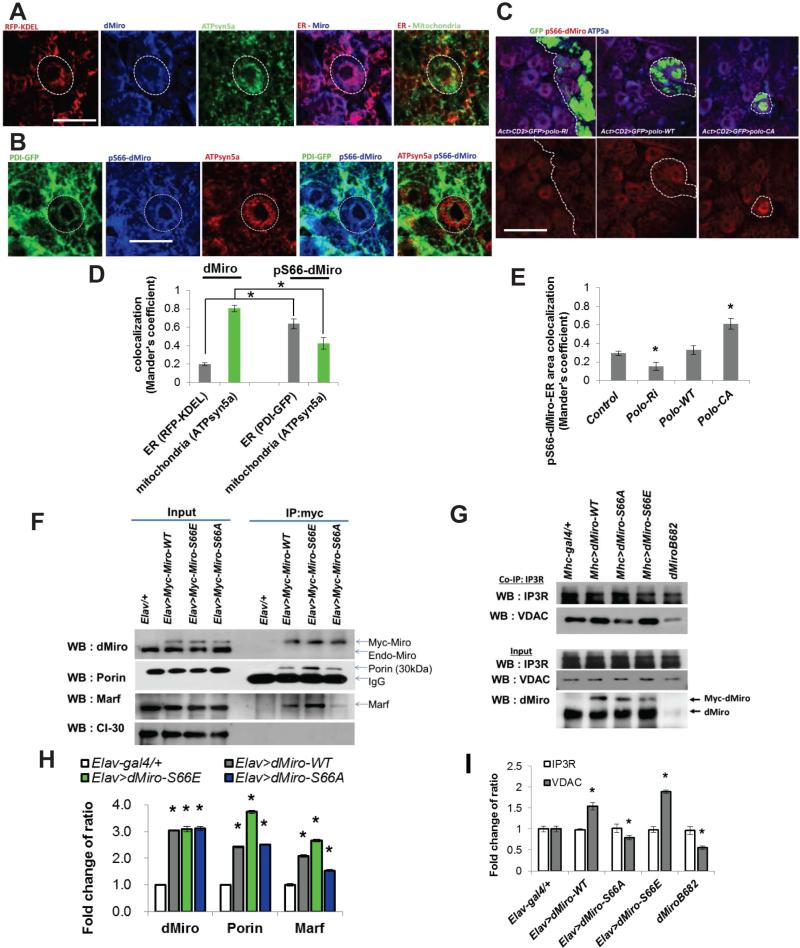
Mitochondria play central roles in buffering intracellular Ca²⁺ transients. While basal mitochondrial Ca²⁺ (Ca²⁺ mito) is needed to maintain organellar physiology, Ca²⁺ mito overload can lead to cell death. How Ca²⁺ mito homeostasis is regulated is not well understood. Here we show that Miro, a known component of the mitochondrial transport machinery, regulates Drosophila neural stem cell (NSC) development through Ca²⁺ mito homeostasis control, independent of its role in mitochondrial transport. Miro interacts with Ca²⁺ transporters at the ER-mitochondria contact site (ERMCS). Its inactivation causes Ca²⁺ mito depletion and metabolic impairment, whereas its overexpression results in Ca²⁺ mito overload, mitochondrial morphology change, and apoptotic response. Both conditions impaired NSC lineage progression. Ca²⁺ mito homeostasis is influenced by Polo-mediated phosphorylation of a conserved residue in Miro, which positively regulates Miro localization to, and the integrity of, ERMCS. Our results elucidate a regulatory mechanism underlying Ca²⁺ mito homeostasis and how its dysregulation may affect NSC metabolism/development and contribute to disease.


Figures

Figure 1
Figure 1. Regulation of NB Behavior by Miro
(A, B) Reduction of NB number and brain size in dMiroB682 null mutant. Larval brains of dMiroB682 heterozygous and homozygous animals were immunostained for pan-NB marker Dpn, type I NB marker Ase, and actin. The central brain area is outlined with white dashed line. (C, D) Reduction of NB number by NB-specific knockdown of dMiro. Control (1407>Dcr2) and dMiro RNAi (1407>Dcr2,dMiro-RI) larval brains were immunostained for Dpn. (E) MARCM analysis of NB lineages in the dMiroB682 and milton92 backgrounds. Brains were stained for Dpn and Pros, a differentiation marker. NB clones are marked with GFP. Upper: Type II NBs, Lower: Type I NBs. Primary NBs are indicated with arrows. Note that the primary NB in the dMiroB682 type II NB clone is losing Dpn expression. (F) Quantification of the size of NBs from E. (G, H) Effects on NB number by pan-NB (1407-Gal4) or type II NB-specific (Pnt-Gal4) dMiro OE. Brains were stained for Dpn. The central brain area is outlined with yellow dashed line. (I, J) Quantification of total NB (I) or type II NB (J) number from G and H, respectively. (K-M) Effects of dMiro OE on type II NB size (L) and IP number (M). The type II NB lineages are outlined with white dashed line. Primary NBs are marked with arrows. Error bar: SEM; *, p<0.05 versus control in Student's t-tests. n = 5. Scale bars, 100 μm (A, C, G); 20 μm (K). See also Figure S1.
Figure 2
Figure 2. Regulation of Ca2+mito by Miro
(A-C) Effects of pan-neuronal elav-Gal4 driven dMiro OE (A) or dMiro RNAi (B), or dMiroB682 null mutation (C), on TG-stimulated Rhod-2 AM fluorescence in primary cultured fly neurons. The traces show mean response of cells present in the microscope field and are representative of more than 3 experiments. (D-F) Effects of OE or RNAi of Miro (D), Marf (E), or Porin (F) on mitochondrial Ca2+ in type II NB lineages as monitored using mito-AEQ. The traces show mean response of 10 dissected larval brains present in the microtiter plate and are representative of more than 3 tests. (G, H) Imaging of basal Ca2+mito using mito-GCaMP in larval brains without (control) or with Miro or Porin OE. White circle outline larval brain, yellow lines separate central brain (left) from the rest of brain. Images are representative of more than 5 samples. H, quantification of mito-GCaMP intensity in NBs from G. Error bar: SEM; *, p<0.05 versus control in Student's t-tests. Scale bars, 100 μm (G). See also Figure S2.
Figure 3
Figure 3. Miro-Mediated Ca2+mito Homeostasis Regulates Mitochondrial Activity
(A, B) Western blot (WB) analysis showing increased p-PDHE1 and p-AMPK in dMiro mutant. PDHE1, Porin, and actin serve as controls. Normalized protein levels are shown as the ratio of dMiro/Porin, pS293-PDHE1/PDHE1 and pT713-AMPK/AMPK from A. (C-F) Immunostaining of p-PDHE1 (C), mito-SOX (D, E), or activated caspase 3 (F) in dMiro mutant MARCM clones (yellow-outlined in upper panels) or dMiro-OE Flip-out clones (yellow-outlined in lower panels). NBs within clones are marked with white circles and control NBs outside of the clones are marked with red circles in C. (G) Effect of dMiro-WT OE on ATP level in dMiro mutant larval brain. (H) Real-time changes in OCR and Glycolytic rate (ECAR) were measured in control, dMiro-WT-OE (Mhc>dMiro-WT) and dMiro mutant animals using the Seahorse Bioscience XF Analyzer. Error bar: SEM; *, p<0.05 versus control in Student's t-tests. Scale bars, 50 μm (C), 20 μm (D, E). See also Figure S3.
Figure 4
Figure 4. Functional Interaction between Miro and Ca2+ Transporter at the ERMCS
(A, B) Transheterozygotes between dMiro and IP3R (Itp-r83A), Porin, or dMCU mutants resulted in reduction of NB number. Larval brains were immunostained for Dpn, Pros, and F-actin (cell cortex). Central brain area is outlined with dashed line. (C, D) Effects of CaCl2 feeding in rescuing brain ATP level (C) and brain size (D) of dMiro mutant. Larval brains were immunostained for Dpn and F-actin. Brain lobes are outlined. (E, F) Quantification of the effects of 2-APB and BAPTA feeding in rescuing the reduced IP number (E) and NB size (F) caused by dMiro OE. (G, H) Genetic interactions showing rescue of NB number in dMiro mutant by the OE of Porin, dMCU, yNDI1, or PDK-RNAi, but not the H99 heterozygous background. Larval brains were immunostained for Dpn, Pros, and F-actin. H, quantification of number of NBs shown in G. Error bar: SEM; *, p<0.05 in Student's t-tests. Scale bars, 100 μm. See also Figure S4.
Figure 5
Figure 5. Regulation of Miro Function by Polo-Mediated Phosphorylation at Serine 66
(A) Comparison of candidate Polo/PLK phosphorylation motifs at the N-terminus of Miro. The consensus D/E-X-S-X-X-D/E motif is underlined, and S66 indicated by asterisk. (B) Polo-GFP is present in dMiro IP prepared from fly brain extracts. (C, D) Increased dMiro phosphorylation at Ser but not Thr residue(s) after Polo co-expression in fly brain. D, quantification of normalized phospho-Ser intensity from C. (E, F) In vitro kinase assays showing phosphorylation of dMiro-N by PLK1 (E), and the strong effect of S66A mutation in blocking PLK1 effect (F). Bar graph shows quantification of normalized phospho-dMiro signal (top). GST-dMiro proteins were visualized by autoradiography (middle panels) or Coomassie blue staining (bottom panels). (G, H) Rescue of brain size (G) and NB number (H) in dMiro mutant by dMiro-WT but not -S66A. Larval brains were immunostained for Dpn, Pros, and F-actin. (I) Rescue of reduced brain ATP level in dMiro mutant by dMiro-S66E, but not -S66A. (J-L) Rescue of type II NB number (J, K) or IP number (J, L) in Polo-CA OE animals by dMiro-S66A or dMiro-RNAi. Larval brains were immunostained for Dpn and GFP. Dashed lines mark type II NB lineages. (M, N) Rescue of type II NB number in Polo OE animals by RNAi of ERMCS components. Larval brains were immunostained for Dpn, GFP and NICD (cell membrane). N, quantification of number of NBs in M. Error bar: SEM; *, p<0.05 in Student's t-tests. Scale bars, 100 μm (G, upper panel of J, M ), 20 μm (lower panel of J). See also Figure S5.
Figure 6
Figure 6. Phosphorylation of Miro Regulates the Integrity of ERMCS
(A, B) Immunostaining showing localization of p-S66-Miro to ERMCS of larval brain NBs. Circles mark the NBs of interest. Larval brains were stained for the indicated antibodies. (C) Effects of Polo on p-S66-Miro immunosignal in Flip-out NB clones with Polo overexpressed or knocked down by RNAi. Clones are marked with GFP. (D, E) Quantification of dMiro and p-dMiro colocalization with ER and mitochondria shown in A and B (D) or p-dMiro colocalization with ER shown in C (E), using Mander's coefficient. (F, H) Co-IP assays showing the effects of S66A and S66E mutations on Miro interaction with Porin and Marf. H, quantification of proteins pulled down by co-IP in F. (G, I) Co-IP assays showing the effects of dMiro mutation or OE of Miro variants on IP3R-VDAC interaction. I, quantification of proteins pulled down by co-IP in G. Error bar: SEM; *, p<0.05 in Student's t-tests. Scale bars, 20 μm. See also Figure S6.
Figure 7
Figure 7. Regulation of Ca2+mito by Miro in Mammalian Cells
(A, B) Immunostaining showing that the PLK inhibitor BI2536 blocked histamine-induced hMiro1 recruitment to perinuclear ER area in HeLa cells. B, quantification of Miro-Calnexin colocalization using Mander's coefficient. (C, D) Effects of dMiro variants on Rhod-2 AM fluorescence in HeLa cells. D, quantification of Rhod-2 signals. RU360 treatment serves as control. (E) Effects of pharmacological intervention of ER-mitochondrial Ca2+ transfer (RU360, 2-APB) or Ca2+ availability (BAPTA) on hMiro1-induced mitochondrial morphology change visualized with mitochondria-localized hMiro. Bar graph shows quantification of mitochondrial aggregation. (F, G) Co-IP assay showing effect of PLK inhibition on IP3R-VDAC interaction in HeLa cells. G, quantification of signal intensity change shown in F. (H) Effects of hMiro1-WT and hMiro1-S59A transfection on mammalian NSC (ReNcell CX) proliferation monitored over a 72h time course. Error bar: SEM; *, p<0.05 in Student's t-tests. Scale bars, 100 μm. See also Figure S7.

Similar articles

Cited by

References

    1. Babic M, Russo GJ, Wellington AJ, Sangston RM, Gonzalez M, Zinsmaier KE. Miro's N-Terminal GTPase Domain Is Required for Transport of Mitochondria into Axons and Dendrites. J Neurosci. 2015;35:5754–5771. - PMC - PubMed
    1. Bahadorani S, Cho J, Lo T, Contreras H, Lawal HO, Krantz DE, Bradley TJ, Walker DW. Neuronal expression of a single-subunit yeast NADH-ubiquinone oxidoreductase (Ndi1) extends Drosophila lifespan. Aging Cell. 2010;9:191–202. - PMC - PubMed
    1. Bayraktar OA, Doe CQ. Combinatorial temporal patterning in progenitors expands neural diversity. Nature. 2013;498:449–455. - PMC - PubMed
    1. Bello B, Reichert H, Hirth F. The brain tumor gene negatively regulates neural progenitor cell proliferation in the larval central brain of Drosophila. Development. 2006;133:2639–2648. - PubMed
    1. Boone JQ, Doe CQ. Identification of Drosophila type II neuroblast lineages containing transit amplifying ganglion mother cells. Dev Neurobiol. 2008;68:1185–1195. - PMC - PubMed

Publication types

MeSH terms

LinkOut - more resources