

The timescales of global surface-ocean connectivity
- PMID: 27093522
- PMCID: PMC4838858
- DOI: 10.1038/ncomms11239
The timescales of global surface-ocean connectivity
Abstract
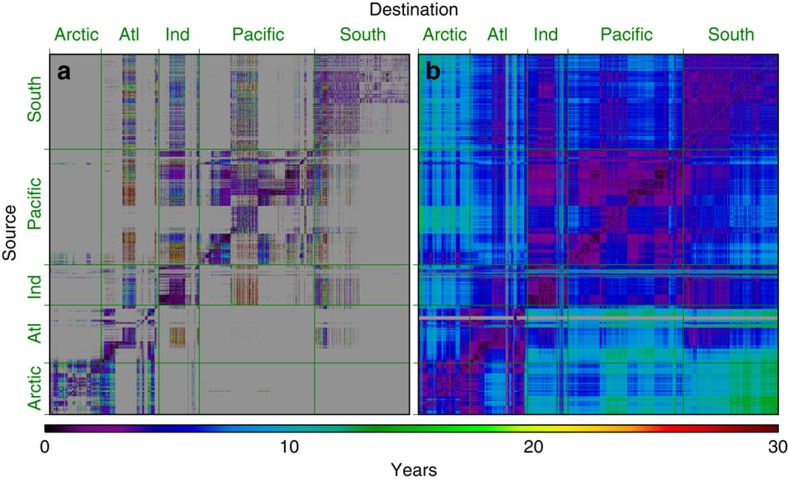
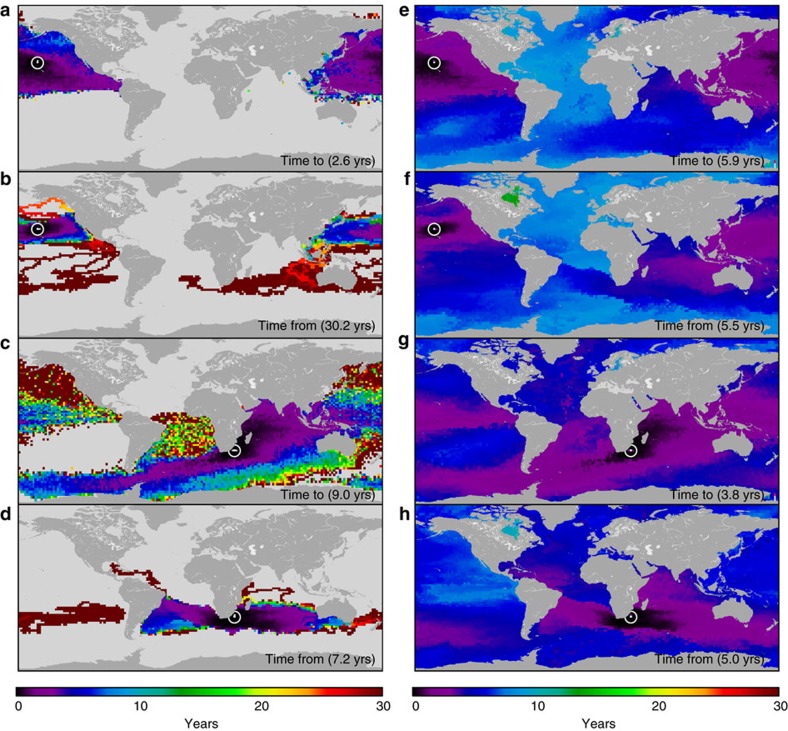
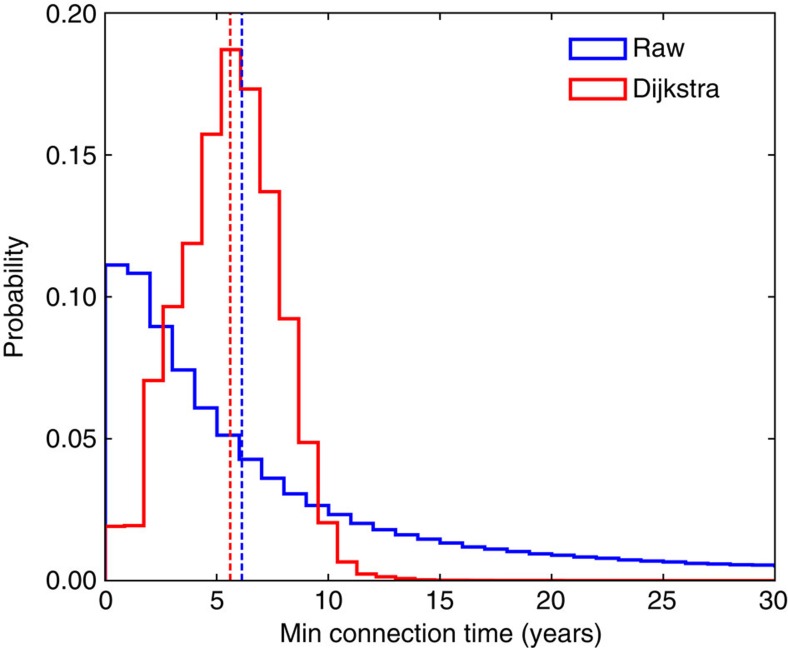
Planktonic communities are shaped through a balance of local evolutionary adaptation and ecological succession driven in large part by migration. The timescales over which these processes operate are still largely unresolved. Here we use Lagrangian particle tracking and network theory to quantify the timescale over which surface currents connect different regions of the global ocean. We find that the fastest path between two patches--each randomly located anywhere in the surface ocean--is, on average, less than a decade. These results suggest that marine planktonic communities may keep pace with climate change--increasing temperatures, ocean acidification and changes in stratification over decadal timescales--through the advection of resilient types.
Figures
References
-
- Baas-Becking L. Geobiologie of Inleiding tot de Milieukunde ed Van Stockum W. P., Zoon The Hague (1934).
-
- Fenchel T. & Finlay B. J. The ubiquity of small species: patterns of local and global diversity. Bioscience 54, 777–784 (2004).
-
- De Wit R. & Bouvier T. 'Everything is everywhere, but, the environment selects'; what did Baas Becking and Beijerinck really say? Environ. Microbiol. 8, 755–758 (2006). - PubMed
-
- McGillicuddy D. J. et al.. Eddy/wind interactions stimulate extraordinary mid-ocean plankton blooms. Science 316, 1021–1026 (2007). - PubMed
-
- Thomas M. K., Kremer C. T., Klausmeier C. A. & Litchman E. A global pattern of thermal adaptation in marine phytoplankton. Science 338, 1085–1088 (2012). - PubMed
Publication types
LinkOut - more resources
Full Text Sources
Other Literature Sources
Molecular Biology Databases
