. 2016 Apr 19;11(4):e0153863.
doi: 10.1371/journal.pone.0153863. eCollection 2016.

Cytochrome P450 1A2 Metabolizes 17β-Estradiol to Suppress Hepatocellular Carcinoma

Affiliations

Cytochrome P450 1A2 Metabolizes 17β-Estradiol to Suppress Hepatocellular Carcinoma

Jianwai Ren et al. PLoS One. .

Abstract

Hepatocellular carcinoma (HCC) occurs more frequently in men than in women. It is commonly agreed that estrogen plays important roles in suppressing HCC development, however, the underlying mechanism remains largely unknown. Since estrogen is mainly metabolized in liver and its metabolites affect cell proliferation, we sought to investigate if the liver-specific cytochrome P450 1A2 (CYP1A2) mediated the inhibitory effect of estrogen on HCC. In this study, the expression of estrogen-metabolizing enzyme CYP1A2 was determined in HCC tissues and cell lines. Cell proliferation and apoptosis were assessed in cells with or without CYP1A2 overexpression. The levels of 17β-estradiol (E2) and its metabolite 2-methoxyestradiol (2-ME) were determined. A xenograft tumor model in mice was established to confirm the findings. It was found that CYP1A2 expression was greatly repressed in HCC. E2 suppressed HCC cell proliferation and xenograft tumor development by inducing apoptosis. The inhibitory effect was significantly enhanced in cells with CYP1A2 overexpression, which effectively conversed E2 to the cytotoxic 2-ME. E2 in combination with sorafenib showed an additive effect on HCC. The anti-HCC effect of E2 was not associated with estrogen receptors ERα and ERβ as well as tumor suppressor P53 but enhanced by the approved anti-HCC drug sorafenib. In addition, HDAC inhibitors greatly induced CYP1A2 promoter activities in cancer cells, especially liver cancer cells, but not in non-tumorigenic cells. Collectively, CYP1A2 metabolizes E2 to generate the potent anti-tumor agent 2-ME in HCC. The reduction of CYP1A2 significantly disrupts this metabolic pathway, contributing the progression and growth of HCC and the gender disparity of this malignancy.


Conflict of interest statement

Competing Interests: The authors have declared that no competing interests exist.

Figures

Fig 1
Fig 1. Estrogen suppresses proliferation of liver cancer cells.
In A–E HCC cells were seeded at 5x10³ cells/per well of 96-well plates and grown for 24 hours. The cells were treated as indicated and analyzed for proliferation rate by MTT. Each column represents mean±s.d. of data obtained from four replicate wells. Consistent results were obtained in three independent experiments. (A) E2 inhibited proliferation of HCC cells. The cells were treated with E2 of the indicated concentrations for 48 hours before MTT assay. The proliferation rate of individual cell line is expressed as the value of treated cells versus that of the untreated cells (= 100%). (B) 2-ME inhibited Hep3B cell growth in a dose-dependent manner. Hep3B was treated with 2-ME of the indicated concentrations for 48 hours before MTT assay. The proliferation rate is expressed as the value of treated Hep3B cells versus that of the untreated Hep3B cells (= 100%). (C) Inhibitory effect of E2 is not influenced by P53. Hep3B cells were transfected with wt p53 DNA or empty vector control. Inset shows the expression of p53 in the transfected cells. The proliferation rate is expressed as the value of treated cells versus that of the untreated cells of the same transfection (= 100%). (D) The Hep3B cells were treated with fulvestrant of indicated concentrations supplemented with or without 30μM E2 for 48 hours before MTT assay. E2 inhibited the HCC cell proliferation in a way basically independent of the increasing doses of fulvestrant. (E) E2 additively enhanced the effect of sorafenib in suppressing the growth of Hep3B cells. (F) E2 and 2-ME induced apoptosis in Hep3B cells. The cells were treated with E2 or ME2 for 48 hours before being harvested for PI staining. Apoptotic cells were identified as the sub-G1 peak of the DNA content profiles.
Fig 2
Fig 2. Expression of ERα, ERβ, GPR30, CYP1A2, CYP3A4 and COMT in HCC.
Total RNA was extracted from 12 pairs of human HCC samples (tumorous (T) and adjacent non-tumorous (N) tissues) and human HCC cell lines. Among the tissue samples, HCC1, 3, 5, 7 and 10 were obtained from female patients, the rest were obtained from male patients (S1 Table). The mRNA levels of ERα (A), ERβ (B), GPR30 (C), CYP1A2 (D), CYP3A4 (E) and COMT (F) were analyzed by RT-qPCR. The expression levels were normalized with β-Actin mRNA levels. The data are expressed as fold changes relative to the expression level in the tumor of HCC1. Each column represents the mean ± s.d. of four technical replicates.
Fig 3
Fig 3. Effects of gene overexpression on E2-mediated inhibition of cell proliferation.
(A) Growth rate of the transfected cells. Hep3B cells were transfected with vector control or ERα, ERβ, GPR30, CYP1A2, CYP3A4, COMT plasmid DNAs, respectively, and grown for 24 hours. Then the cells were seeded at 5x10³ cells/per well of 96-well plates and grown for 24 hours, at which time MTT was performed with one set of the cells (Day0). MTT for another set of the cells was performed 48 hours later (Day2). The growth ratios of the cells are expressed as the value of Day2 cells versus that of the Day0 cells of the same transfection (= 100%). (B) Hep3B cells were transfected and reseeded as mentioned in (A). Afterwards the cells were treated as indicated for 48 hours and analyzed for proliferation rate by MTT. The proliferation rate is expressed as the value of treated cells versus that of the untreated cells of same transfection (= 100%). Each column represents mean±s.d. of data obtained from four replicate wells. Consistent results were obtained in three independent experiments. (C) CYP1A2 mediates E2-inhibition of cell proliferation in 293T cells. The proliferation rate is expressed as the value of treated cells versus that of the untreated cells of same transfection (= 100%) Consistent results were obtained in three independent experiments. (D) CYP1A2 stable Hep3B cells migrated slowly under E2 treatment. Hep3B stable cells overexpressing CYP1A2 or empty vector were grown to confluence and a 2mm-thin wound gap was generated by scratching with a rubber policeman (Day0). The cells were then grown in medium supplemented with or without 1 μM E2 for 10 days (Day10) before microscopic images were taken. The lines indicate the wound edges. Consistent results were obtained in three independent experiments. (E) Hep3B cells were co-transfected with siRNA against CYP1A2 (siCYP1A2) or COMT (siCOMT) and CYP1A2-expressing plasmids and grown for 24 hours. Then the cells were seeded at 5x10³ cells/per well of 96-well plates and grown for 24 hours. Afterwards the cells were treated as indicated for 48 hours and analyzed for proliferation rate by MTT. The proliferation rate is expressed as the value of treated cells versus that of the untreated cells of same transfection (= 100%). Each column represents mean±s.d. of data obtained from four replicate wells. Consistent results were obtained in three independent experiments. (E) Hep3B cells were transfected with CYP1A2 and grown for 24 hours. Then the cells were grown in 10μM E2 supplemented medium for another 24 hours. Afterwards the cells were harvested and lysed in PBS by sonication. Concentrations of E2 and 2-ME were measured with respective EIA kits mentioned in Materials and Methods. The values represent the relative concentrations normalized against the protein concentration in the same sample. Each column represents mean±s.d. of data obtained from three independent assays.
Fig 4
Fig 4. CYP1A2 enhanced the inhibitory effect of E2 on xenograft tumors.
Empty vector control and CYP1A2-overexpressing Hep3B stable cells were generated and nine clones of each cell line were combined in culture and used in vivo animal experiments. 1 x 10⁷ Hep3B cells with CYP1A2 or empty vector were subcutaneously injected into 4-week old male BALB/c nude mice. Two days later, the mice were intraperitoneally injected with E2 (50 μg/kg) or vehicle control (0.02% DMSO in PBS) once daily for 10 days. Afterwards the mice were maintained for about four weeks before the tumors were collected for analysis. Weights of the tumors were indicated under the tumor images. Three independent xenograft assays were performed. (A) Xenograft tumor-carrying mice and the tumors in each experiment. (B) E2 suppressed the growth of CYP1A2-overexpressing tumors more potently. Mass ratio is expressed as the value of the weight of E2-treated tumors versus the vehicle-treated tumors of each stable cell line (vector or CYP1A2). Each column represents mean±s.d. of data obtained from the three independent xenograft assays. *p<0.05 when compared to vector stable cells.
Fig 5
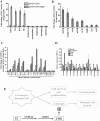
Fig 5. The expression of CYP1A2 was regulated by HDAC inhibitors.
(A) CYP1A2 promoter is activated by HDAC inhibitors. Hep3B cells were transfected with luciferase reporter plasmids and then treated for 24 hours with the drugs of the following concentrations before being harvested for Luc assays: 2μM SAHA, 1μM TSA, 5mM sodium butyrate (NaB), 5mM VPA, 0.2μg/ml doxorubicin, 2μM camptothecin, 5μM decitabine, 5μM zebularine, and 10μM etoposide. The concentrations were determined in preliminary cell proliferation assays in which the drugs caused obvious changes in cell growth. The data are expressed as fold changes of luc reading relative to that of vehicle-treated cells of same transfection (control). Each column represents the mean ± s.d. of three independent experiments. (B) Inductive effect of HDAC inhibitor on CYP1A2 promoter is higher in cancer cells. Tumorigenic (Hep3B, PCL/PRF/5, Huh7, H1299, MCF7) or non-tumorigenic (MIHA, LO2, 293T) cells were transfected with CYP1A2 promoter-luciferase reporter plasmids and treated with 2μM SAHA for 24 hours before being harvested for Luc assays. The data are expressed as fold changes of luc reading relative to that of vehicle-treated cells (control). Each column represents the mean ± s.d. of three independent experiments. (C) Different HDAC inhibitors exert different effects on CYP1A2 promoter activity. The data are expressed as fold changes of luc reading relative to that of vehicle-treated cells (control). Concentrations of the drugs were determined by referring to the reported Half Maximal Inhibitory Concentrations (IC50) of the inhibitors against various HDAC proteins. (D) Expression levels of “classical” HDAC genes in HCC cells and non-tumorigenic cells. The expression levels were normalized with β-Actin mRNA levels. Each column represents the mean ± s.d. of four technical replicates. (E) Hypothesis on how E2 contributes to the clearance of carcinogen-damaged cells and consequently suppresses carcinogenesis.

Similar articles

Cited by

References

    1. Jemal A, Bray F, Center MM, Ferlay J, Ward E, Forman D. Global cancer statistics. CA Cancer J Clin. 2011;61: 69–90. 10.3322/caac.20107 - DOI - PubMed
    1. Park SJ, Jeong SY, Kim HJ. Y chromosome loss and other genomic alterations in hepatocellular carcinoma cell lines analyzed by CGH and CGH array. Cancer Genet Cytogenet. 2006;166: 56–64. - PubMed
    1. Liu J, Wang ZM, Zhen SF, Wu XP, Ma DX, Li ZH, et al. Aberration of X chromosome in liver neoplasm detected by fluorescence in situ hybridization. Hepatobiliary Pancreat Dis Int. 2004;3: 110–114 - PubMed
    1. Boniol M, Autier P. Prevalence of main cancer lifestyle risk factors in Europe in 2000. Eur J Cancer. 2010;46: 2534–2544. 10.1016/j.ejca.2010.07.049 - DOI - PubMed
    1. Ruggieri A, Barbati C, Malorni W. Cellular and molecular mechanisms involved in hepatocellular carcinoma gender disparity. Int J Cancer. 2010;127: 499–504. 10.1002/ijc.25298 - DOI - PubMed

Publication types

MeSH terms