

Change in Image Quality According to the 3D Locations of a CBCT Phantom
- PMID: 27093639
- PMCID: PMC4836729
- DOI: 10.1371/journal.pone.0153884
Change in Image Quality According to the 3D Locations of a CBCT Phantom
Abstract
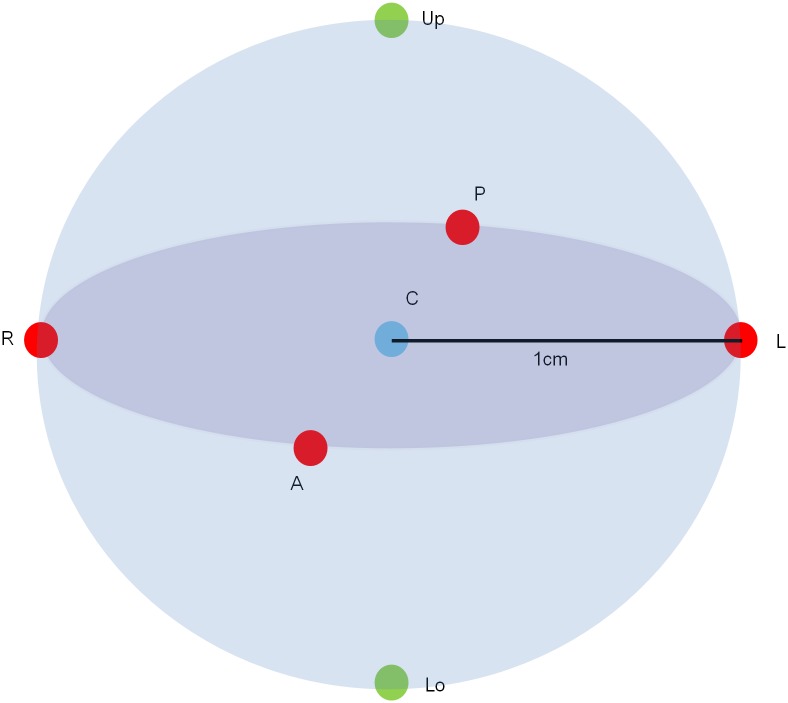
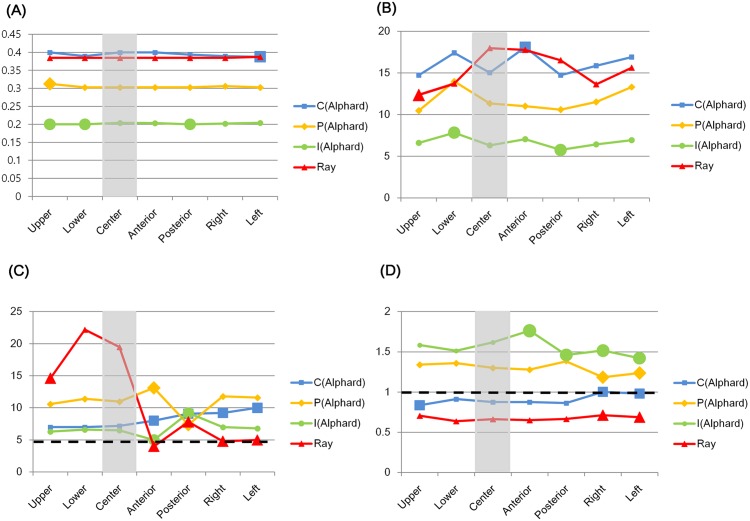
A patient's position changes in every CBCT scan despite patient alignment protocols. However, there have been studies to determine image quality differences when an object is located at the center of the field of view (FOV). To evaluate changes in the image quality of the CBCT scan according to different object positions, the image quality indexes of the Alphard 3030 (Alphard Roentgen Ind., Ltd., Kyoto, Japan) and the Rayscan Symphony (RAY Ind., Ltd., Suwon, Korea) were measured using the Quart DVT_AP phantom at the center of the FOV and 6 peripheral positions under four types of exposure conditions. Anterior, posterior, right, left, upper, and lower positions 1 cm offset from the center of the FOV were used for the peripheral positions. We evaluated and compared the voxel size, homogeneity, contrast to noise ratio (CNR), and the 10% point of the modulation transfer function (MTF10%) of the center and periphery. Because the voxel size, which is determined by the Nyquist frequency, was within tolerance, other image quality indexes were not influenced by the voxel size. For the CNR, homogeneity, and MTF10%, there were peripheral positions which showed considerable differences with statistical significance. The average difference between the center and periphery was up to 31.27% (CNR), 70.49% (homogeneity), and 13.64% (MTF10%). Homogeneity was under tolerance at some of the peripheral locations. Because the CNR, homogeneity, and MTF10% were significantly affected by positional changes of the phantom, an object's position can influence the interpretation of follow up CBCT images. Therefore, efforts to locate the object in the same position are important.
Conflict of interest statement
Figures


Similar articles
-
Panoramic cone beam computed tomography.Med Phys. 2012 May;39(5):2930-46. doi: 10.1118/1.4704640. Med Phys. 2012. PMID: 22559664
-
Long-term Inter-protocol kV CBCT image quality assessment for a ring-gantry linac via automated QA approach.Biomed Phys Eng Express. 2020 Jan 20;6(1):015025. doi: 10.1088/2057-1976/ab693a. Biomed Phys Eng Express. 2020. PMID: 33438613 Free PMC article.
-
Combining scatter reduction and correction to improve image quality in cone-beam computed tomography (CBCT).Med Phys. 2010 Nov;37(11):5634-44. doi: 10.1118/1.3497272. Med Phys. 2010. PMID: 21158275
-
Reduction of scatter-induced image noise in cone beam computed tomography: effect of field of view size and position.Oral Surg Oral Med Oral Pathol Oral Radiol. 2016 Feb;121(2):188-95. doi: 10.1016/j.oooo.2015.10.017. Epub 2015 Oct 20. Oral Surg Oral Med Oral Pathol Oral Radiol. 2016. PMID: 26792756
-
Contrast-to-noise ratio difference in small field of view cone beam computed tomography machines.J Oral Sci. 2012 Sep;54(3):227-32. doi: 10.2334/josnusd.54.227. J Oral Sci. 2012. PMID: 23047033
Cited by
-
Effect of Spatial Position in the Field of View on Dimensional Changes in Cone Beam Computed Tomography.J Dent (Tehran). 2017 Sep;14(5):282-291. J Dent (Tehran). 2017. PMID: 29296114 Free PMC article.
-
Contrast-to-noise ratios of different dental restorative materials: an in-vitro cone beam computed tomography study.Eur Oral Res. 2020 Jan 1;54(1):36-41. doi: 10.26650/eor.20200079. Eur Oral Res. 2020. PMID: 32518909 Free PMC article.
-
Accuracy evaluation of 3D printed interim prosthesis fabrication using a CBCT scanning based digital model.PLoS One. 2020 Oct 16;15(10):e0240508. doi: 10.1371/journal.pone.0240508. eCollection 2020. PLoS One. 2020. PMID: 33064731 Free PMC article.
-
Quantitative assessment of variation in CBCT image technical parameters related to CBCT detector lateral-offset position.Dentomaxillofac Radiol. 2020 Feb;49(2):20190077. doi: 10.1259/dmfr.20190077. Epub 2019 Sep 6. Dentomaxillofac Radiol. 2020. PMID: 31469317 Free PMC article.
-
Assessment of cone-beam CT technical image quality indicators and radiation dose for optimal STL model used in visual surgical planning.Dentomaxillofac Radiol. 2024 Sep 1;53(6):423-433. doi: 10.1093/dmfr/twae026. Dentomaxillofac Radiol. 2024. PMID: 38913866 Free PMC article.
References
-
- Radiation Protection: Cone Beam CT for Dental and Maxillofacial Radiology. Evidence Based Guidelines. 2011.
-
- Sicherung der Bildqualität in röntgendiagnostischen Betrieben—Teil 161: Abnahmeprüfung nach RöV an zahnmedizinischen Röntgeneinrichtungen zur digitalen Volumentomographie, DIN Report Nr 6868–161 (DIN, Berlin, 2013).
MeSH terms
LinkOut - more resources
Full Text Sources
Other Literature Sources
