. 2016 Apr 19;11(4):e0153196.
doi: 10.1371/journal.pone.0153196. eCollection 2016.

Association between Polycystic Ovary Syndrome and Gut Microbiota

Affiliations

Association between Polycystic Ovary Syndrome and Gut Microbiota

Yanjie Guo et al. PLoS One. .

Abstract

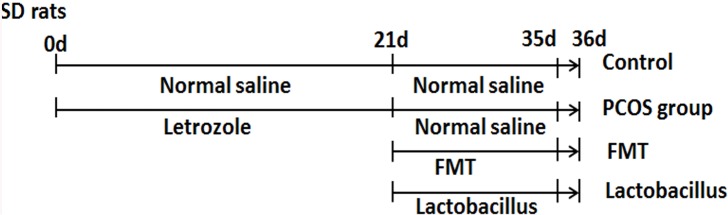
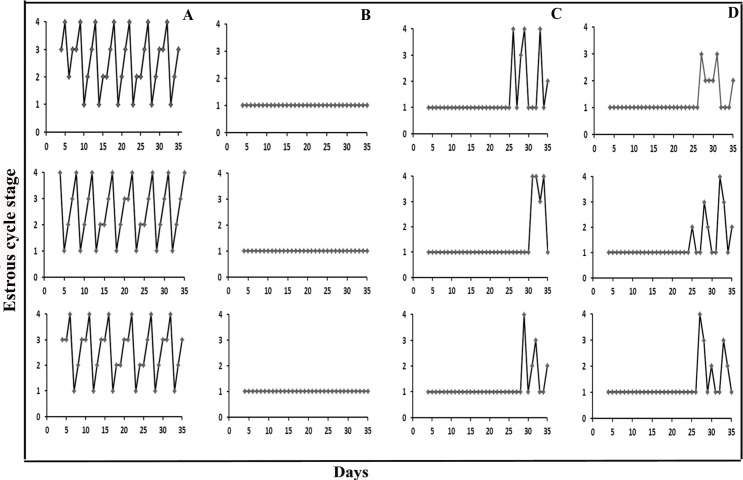
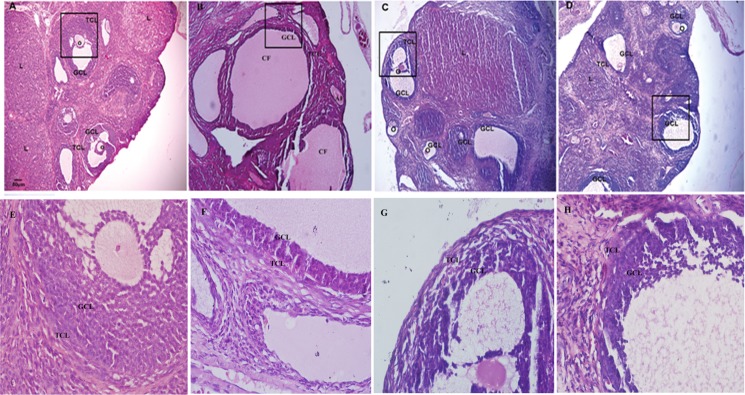
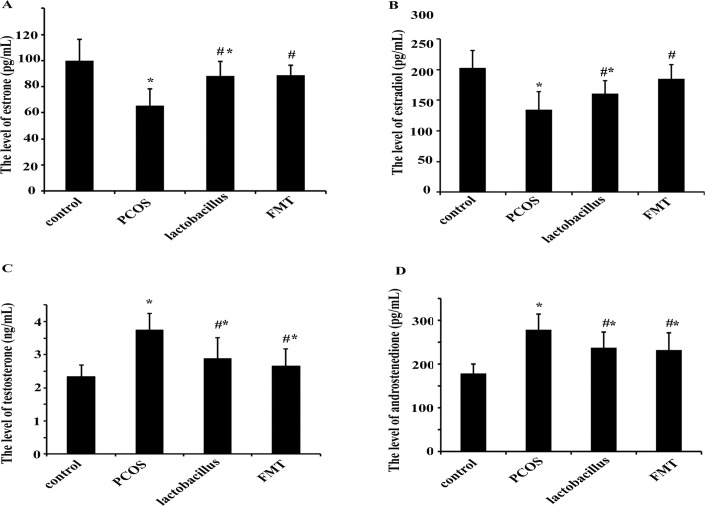
Polycystic ovary syndrome (PCOS) is the most frequent endocrinopathy in women of reproductive age. It is difficult to treat PCOS because of its complex etiology and pathogenesis. Here, we characterized the roles of gut microbiota on the pathogenesis and treatments in letrozole (a nonsteroidal aromatase inhibitor) induced PCOS rat model. Changes in estrous cycles, hormonal levels, ovarian morphology and gut microbiota by PCR-DGGE and real-time PCR were determined. The results showed that PCOS rats displayed abnormal estrous cycles with increasing androgen biosynthesis and exhibited multiple large cysts with diminished granulosa layers in ovarian tissues. Meanwhile, the composition of gut microbiota in letrozole-treated rats was different from that in the controls. Lactobacillus, Ruminococcus and Clostridium were lower while Prevotella was higher in PCOS rats when compared with control rats. After treating PCOS rats with Lactobacillus and fecal microbiota transplantation (FMT) from healthy rats, it was found that the estrous cycles were improved in all 8 rats in FMT group, and in 6 of the 8 rats in Lactobacillus transplantation group with decreasing androgen biosynthesis. Their ovarian morphologies normalized. The composition of gut microbiota restored in both FMT and Lactobacillus treated groups with increasing of Lactobacillus and Clostridium, and decreasing of Prevotella. These results indicated that dysbiosis of gut microbiota was associated with the pathogenesis of PCOS. Microbiota interventions through FMT and Lactobacillus transplantation were beneficial for the treatments of PCOS rats.


Conflict of interest statement

Competing Interests: The authors have declared that no competing interests exist.

Figures

Fig 1
Fig 1. Time lines of the animal experiments.
To establish the PCOS rat model, SD rats were treated with letrozole at a concentration of 1 mg/kg once daily for 21 days. After that, PCOS FMT group was treated with 2×10⁹ fecal microbiota once daily, PCOS Lactobacillus transplantation group was treated with 2×10⁹ Lactobacillus once daily, PCOS group and control group were treated with normal saline for 14 days. On day 21, all rat fecal samples were collected. On day 36, all rat blood samples, ovarian tissue samples and fecal samples were collected.
Fig 2
Fig 2. Microbiota profiles in PCOS rats.
(A) DGGE profiles in the fecal microbiota of control group and PCOS group (control group: C1-C6; PCOS group: P1-P6). Arrows 1–7 were the bands selected for sequence. (B) Cluster analysis of the DGGE profiles. The dendrogram was constructed using UPGMA method. (C) Principal component analysis (PCA) of fecal microbiota based on DGGE fingerprints. Samples grouped in a solid circle represented fecal microbiota of PCOS group.
Fig 3
Fig 3. Estrous cycle changes in three representative rats from each group.
Cycle stages are as follows: 1, diestrus; 2, proestrus; 3, estrus and 4, metestrus. Groups are as follows: (A) Control group; (B) PCOS group; (C) PCOS Lactobacillus transplantation group; (D) PCOS FMT group.
Fig 4
Fig 4. Morphological changes of ovarian tissues.
(A) Sections of ovary from the control group had normal appearance. (B) PCOS group showed cystic degenerating follicles with thin granulosa layers. (C) PCOS Lactobacillus transplantation group showed increased granulosa layers. (D) PCOS FMT group showed increased granulosa layers and formation of corpora lutea. The larger boxed area in A, B, C, D was shown at higher magnification (400×) in E, F, G, H, respectively. GLC: granular cell layer, TCL: theca cell layer, O: oocyte, L: luteum, AF: atretic follicle. Magnification (100×), scale bar, 50 μm.
Fig 5
Fig 5. Comparisons of serum sex steroids at 36 days.
The concentrations of estrone (A), estradiol (B), androstenedione (C) and testosterone (D) in the serum were quantified with ELISA kit. These data were shown as Mean±sem. * p < 0.05 versus control group, # p < 0.05 versus PCOS group.

References

    1. Norman RJ, Dewailly D, Legro RS, Hickey TE. Polycystic ovary syndrome. Lancet. 2007;370(9588):685–97. 10.1016/S0140-6736(07)61345-2 . - DOI - PubMed
    1. Homburg R. Polycystic ovary syndrome. Best Pract Res Clin Obstet Gynaecol. 2008;22(2):261–74. 10.1016/j.bpobgyn.2007.07.009 . - DOI - PubMed
    1. Dokras A. Cardiovascular disease risk in women with PCOS. Steroids. 2013;78(8):773–6. 10.1016/j.steroids.2013.04.009 . - DOI - PubMed
    1. Hsu MI. Changes in the PCOS phenotype with age. Steroids. 2013;78(8):761–6. 10.1016/j.steroids.2013.04.005 . - DOI - PubMed
    1. Lim SS, Norman RJ, Davies MJ, Moran LJ. The effect of obesity on polycystic ovary syndrome: a systematic review and meta-analysis. Obes Rev. 2013;14(2):95–109. 10.1111/j.1467-789X.2012.01053.x . - DOI - PubMed