Review
. 2016 Oct 15:568:749-769.
doi: 10.1016/j.scitotenv.2016.03.071. Epub 2016 Apr 17.

Avian mercury exposure and toxicological risk across western North America: A synthesis

Affiliations
Review

Avian mercury exposure and toxicological risk across western North America: A synthesis

Joshua T Ackerman et al. Sci Total Environ. .

Abstract

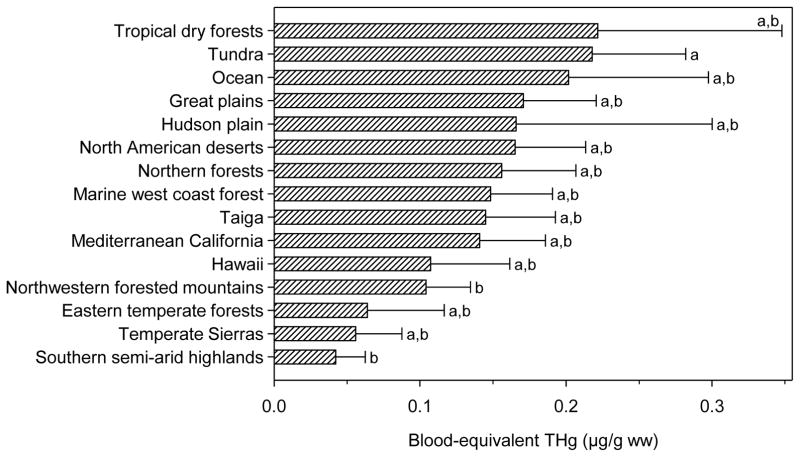
Methylmercury contamination of the environment is an important issue globally, and birds are useful bioindicators for mercury monitoring programs. The available data on mercury contamination of birds in western North America were synthesized. Original data from multiple databases were obtained and a literature review was conducted to obtain additional mercury concentrations. In total, 29219 original bird mercury concentrations from 225 species were compiled, and an additional 1712 mean mercury concentrations, representing 19998 individuals and 176 species, from 200 publications were obtained. To make mercury data comparable across bird tissues, published equations of tissue mercury correlations were used to convert all mercury concentrations into blood-equivalent mercury concentrations. Blood-equivalent mercury concentrations differed among species, foraging guilds, habitat types, locations, and ecoregions. Piscivores and carnivores exhibited the greatest mercury concentrations, whereas herbivores and granivores exhibited the lowest mercury concentrations. Bird mercury concentrations were greatest in ocean and salt marsh habitats and lowest in terrestrial habitats. Bird mercury concentrations were above toxicity benchmarks in many areas throughout western North America, and multiple hotspots were identified. Additionally, published toxicity benchmarks established in multiple tissues were summarized and translated into a common blood-equivalent mercury concentration. Overall, 66% of birds sampled in western North American exceeded a blood-equivalent mercury concentration of 0.2 μg/g wet weight (ww; above background levels), which is the lowest-observed effect level, 28% exceeded 1.0 μg/g ww (moderate risk), 8% exceeded 3.0 μg/g ww (high risk), and 4% exceeded 4.0 μg/g ww (severe risk). Mercury monitoring programs should sample bird tissues, such as adult blood and eggs, that are most-easily translated into tissues with well-developed toxicity benchmarks and that are directly relevant to bird reproduction. Results indicate that mercury contamination of birds is prevalent in many areas throughout western North America, and large-scale ecological attributes are important factors influencing bird mercury concentrations.

Keywords: Bioaccumulation; Birds; Eggs; Mercury; Toxicity Benchmarks.


Figures

Figure 1
Figure 1
Blood-equivalent total mercury (THg) concentrations in birds across western North America using original data (n=27,629 individual samples). All individual data points are shown, with lower THg concentrations as larger symbols in the background and higher THg concentrations as smaller symbols in the foreground.
Figure 2
Figure 2
Mean blood-equivalent total mercury (THg) concentrations in birds across western North America based on data derived from a literature review (n=1,712 means, representing n=19,998 individual samples). All mean data points are shown, with lower mean THg concentrations as larger symbols in the background and higher mean THg concentrations as smaller symbols in the foreground.
Figure 3
Figure 3
Least squares (LS) mean ± standard error blood-equivalent total mercury (THg) concentrations in birds among (A) foraging guilds and (B) habitats in western North America using original data at the individual level (black-filled bars; n=27,629 individual samples) and mean data derived from a literature review (hatched bars; n=1,712 means, representing n=19,998 individual samples). LS mean blood-equivalent THg concentrations were estimated separately for each dataset from models with foraging guild, habitat, and ecoregion as fixed effects, and grid cell, year, and species as random effects. Different letters next to bars denote significant (p<0.05) differences between means for the raw dataset (capital letters) and literature-review dataset (lower case letters).
Figure 4
Figure 4
Least squares (LS) mean ± standard error blood-equivalent total mercury (THg) concentrations among bird species in western North America using original data at the individual level. Only species with sample sizes 60 are displayed; see Figures S2–S7 for a complete listing of species by taxanomic order. LS mean blood-equivalent THg concentrations were estimated from a model with species as a fixed effect, and grid cell and year as random effects.
Figure 5
Figure 5
Blood-equivalent total mercury (THg) concentrations in birds across western North America using raw data (n=27,629 individual samples). Each grid cell is 100 km × 100 km. (A) The large map on the opposite page displays grid cells by their percentile of least squares (LS) mean THg concentration relative to the entire dataset, such that 20% of all grid cells are represented by each color. LS mean THg concentrations were estimated from a model with grid cell as a fixed effect, and species and year as random effects. (B) Displays the sample size in each grid cell. (C) Displays the coefficient of variation (as a percentage) for the model-estimated LS mean THg concentration in each grid cell. The three maps can be used in combination to evaluate the confidence in the estimated blood-equivalent THg concentration in individual grid cells. The darker graduations indicate (B) smaller sample sizes and (C) greater coefficients of variation which denote lower confidence in the model-estimated LS mean THg concentrations in those grid cells.
Figure 5
Figure 5
Blood-equivalent total mercury (THg) concentrations in birds across western North America using raw data (n=27,629 individual samples). Each grid cell is 100 km × 100 km. (A) The large map on the opposite page displays grid cells by their percentile of least squares (LS) mean THg concentration relative to the entire dataset, such that 20% of all grid cells are represented by each color. LS mean THg concentrations were estimated from a model with grid cell as a fixed effect, and species and year as random effects. (B) Displays the sample size in each grid cell. (C) Displays the coefficient of variation (as a percentage) for the model-estimated LS mean THg concentration in each grid cell. The three maps can be used in combination to evaluate the confidence in the estimated blood-equivalent THg concentration in individual grid cells. The darker graduations indicate (B) smaller sample sizes and (C) greater coefficients of variation which denote lower confidence in the model-estimated LS mean THg concentrations in those grid cells.
Figure 6
Figure 6
Bird blood-equivalent total mercury (THg) concentrations in (A) piscivores (n=10,243 individual samples), (B) insectivores (n=8,464 individual samples), and (C) omnivores (n=6,685 individual samples) across western North America using raw data. Each grid cell is 100 km × 100 km. Maps display grid cells by their percentile of least squares (LS) mean THg concentration relative to the entire dataset, such that 20% of all grid cells in each foraging guild are represented by each color. LS mean THg concentrations in each foraging guild were estimated from a model with grid cell as a fixed effect, and species and year as random effects.
Figure 7
Figure 7
Least squares (LS) mean ± standard error blood-equivalent total mercury (THg) concentrations in birds among ecoregions in western North America using data derived from a literature review (n=1,712 means, representing n=19,998 individual samples). LS mean blood-equivalent THg concentrations were estimated from a model with foraging guild, habitat, and ecoregion as fixed effects, and grid cell, year, and species as random effects. Different lowercase letters next to bars denote significant (p<0.05) differences between means. Literature-derived bird THg concentrations were available for 15 of the possible 17 ecoregions in western North America.
Figure 8
Figure 8
Blood-equivalent total mercury (THg) concentrations in birds across western North America based on data derived from a literature review (n=1,712 means, representing n=19,998 individual samples). Each grid cell is 100 km × 100 km. (A) The large map on the opposite page displays grid cells by their percentile of least squares (LS) mean THg concentration relative to the entire dataset, such that 20% of all grid cells are represented by each color. LS mean THg concentrations were estimated from a model with grid cell as a fixed effect, and species and year as random effects. (B) Displays the effective sample size in each grid cell. (C) Displays the coefficient of variation (as a percentage) for the model-estimated LS mean THg concentration in each grid cell. The three maps can be used in combination to evaluate the confidence in the estimated blood-equivalent THg concentration in individual grid cells. The darker graduations indicate (B) smaller sample sizes and (C) greater coefficients of variation which denote lower confidence in the model-estimated LS mean THg concentrations in those grid cells.
Figure 8
Figure 8
Blood-equivalent total mercury (THg) concentrations in birds across western North America based on data derived from a literature review (n=1,712 means, representing n=19,998 individual samples). Each grid cell is 100 km × 100 km. (A) The large map on the opposite page displays grid cells by their percentile of least squares (LS) mean THg concentration relative to the entire dataset, such that 20% of all grid cells are represented by each color. LS mean THg concentrations were estimated from a model with grid cell as a fixed effect, and species and year as random effects. (B) Displays the effective sample size in each grid cell. (C) Displays the coefficient of variation (as a percentage) for the model-estimated LS mean THg concentration in each grid cell. The three maps can be used in combination to evaluate the confidence in the estimated blood-equivalent THg concentration in individual grid cells. The darker graduations indicate (B) smaller sample sizes and (C) greater coefficients of variation which denote lower confidence in the model-estimated LS mean THg concentrations in those grid cells.
Figure 9
Figure 9
Blood-equivalent total mercury (THg) concentrations in birds across western North America using raw data (grid cells not hatched: n=27,629 individual samples) and mean data derived from a literature review (hatched grid cells: n=1,712 means, representing n=19,998 individual samples). Each grid cell is 100 km × 100 km. The map displays grid cells by their percentile of least squares (LS) mean THg concentration relative to the entire dataset, such that 20% of grid cells are represented by each color for each dataset. However, when grid cells had an estimated THg concentration using both the raw and literature-review datasets, priority was given to the raw data and the literature-derived estimate for that grid cell was excluded. LS mean THg concentrations were estimated separately for each dataset from models with grid cell as a fixed effect, and species and year as random effects. Red grid cells that are outlined in black indicate hotspots that were well sampled (>15 samples) and had relatively low coefficients of variation (<25%).
Figure 10
Figure 10
Percentage of individual birds sampled in western North America that are at risk to methylmercury contamination based on blood-equivalent total mercury concentrations using raw data. Only species with 60 samples are included; see Table S9 for all species. Risk categories are: <0.2 μg/g ww (blue; below any known effect levels), 0.2 to <1.0 μg/g ww (yellow; low risk), 1.0 to <3.0 μg/g ww (orange; moderate risk), 3.0 to <4.0 μg/g ww (red; high risk), and 4.0 μg/g ww (dark red; severe risk). Brackets on the right indicate groups of species where some individuals have blood-equivalent total mercury concentrations over the specified toxicity benchmark.

Similar articles

Cited by

References

    1. Ackerman JT, Eagles-Smith CA. Integrating toxicity risk in bird eggs and chicks: using chick down feathers to estimate mercury concentrations in eggs. Environ Sci Technol. 2009;43:2166–2172. - PubMed
    1. Ackerman JT, Eagles-Smith CA, Herzog MP. Bird mercury concentrations change rapidly as chicks age: toxicological risk is highest at hatching and fledging. Environ Sci Technol. 2011;45:5418–5425. doi: 10.1021/es200647g. - DOI - PubMed
    1. Ackerman JT, Eagles-Smith CA, Herzog MP, Hartman CA. Maternal transfer of contaminants in birds: mercury and selenium concentrations in parents and their eggs. Environ Pollut. 2016a;210:145–154. - PubMed
    1. Ackerman JT, Eagles-Smith CA, Herzog MP, Yee JL, Hartman CA. Egg laying sequence influences egg mercury concentrations and egg size in three bird species: implications for contaminant monitoring programs. Environ Toxicol Chem. 2016b In Press. - PubMed
    1. Ackerman JT, Eagles-Smith CA, Takekawa JY, Bluso JD, Adelsbach TL. Mercury concentrations in blood and feathers of prebreeding Forster’s terns in relation to space use of San Francisco Bay, California, USA, habitats. Environ Toxicol Chem. 2008;27:897–908. doi: 10.1897/07-230.1. - DOI - PubMed

MeSH terms

Substances

LinkOut - more resources