. 2016 Apr 20:6:24493.
doi: 10.1038/srep24493.

Osmotin attenuates LPS-induced neuroinflammation and memory impairments via the TLR4/NFκB signaling pathway

Affiliations

Osmotin attenuates LPS-induced neuroinflammation and memory impairments via the TLR4/NFκB signaling pathway

Haroon Badshah et al. Sci Rep. .

Abstract

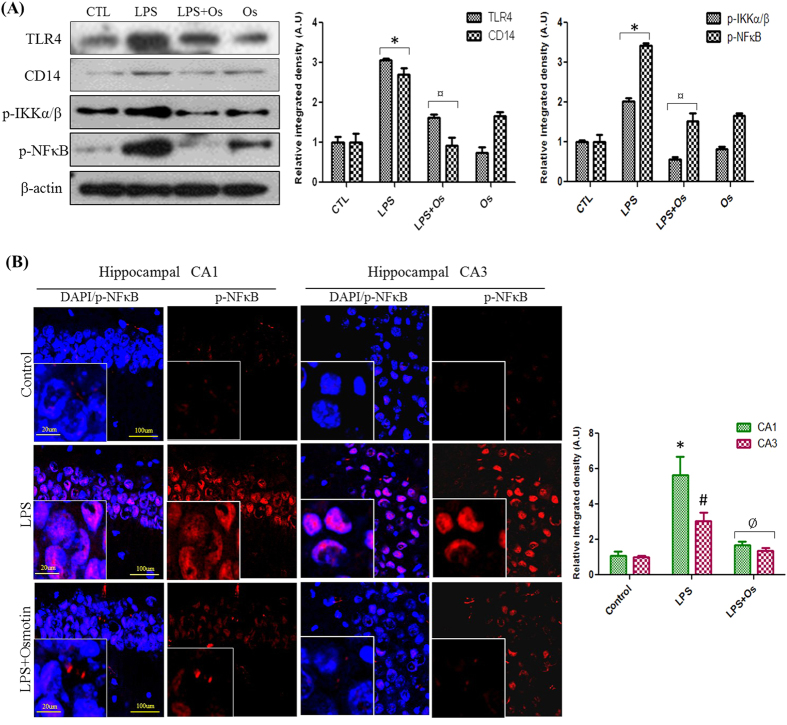
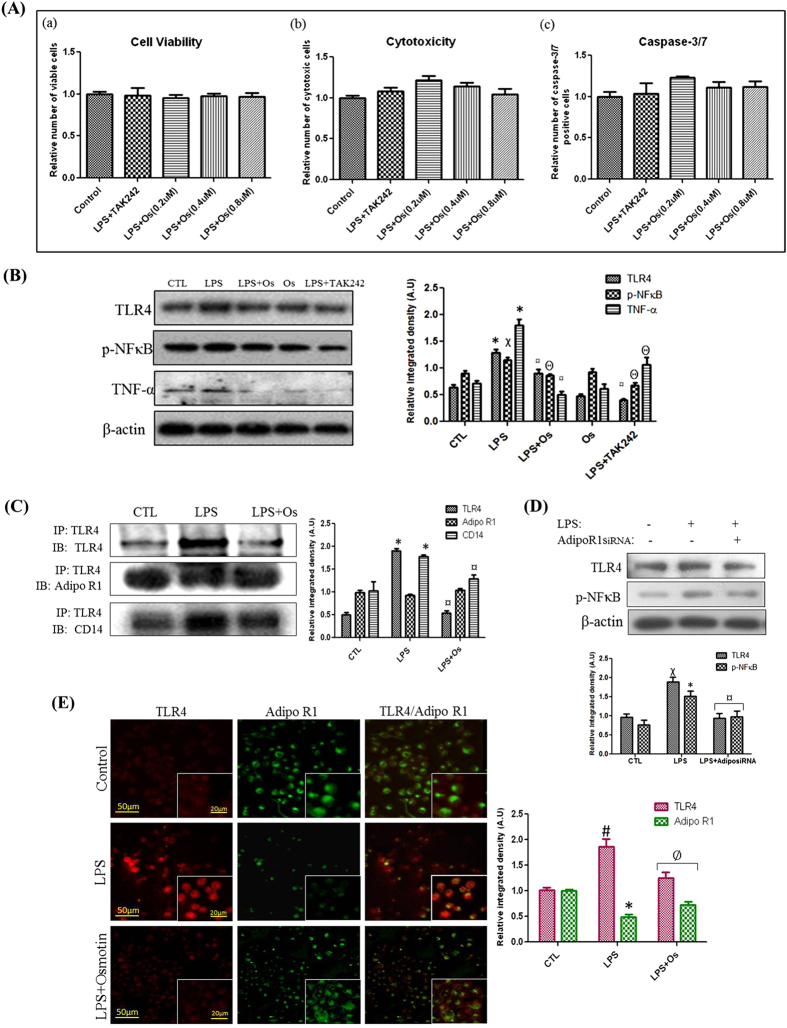
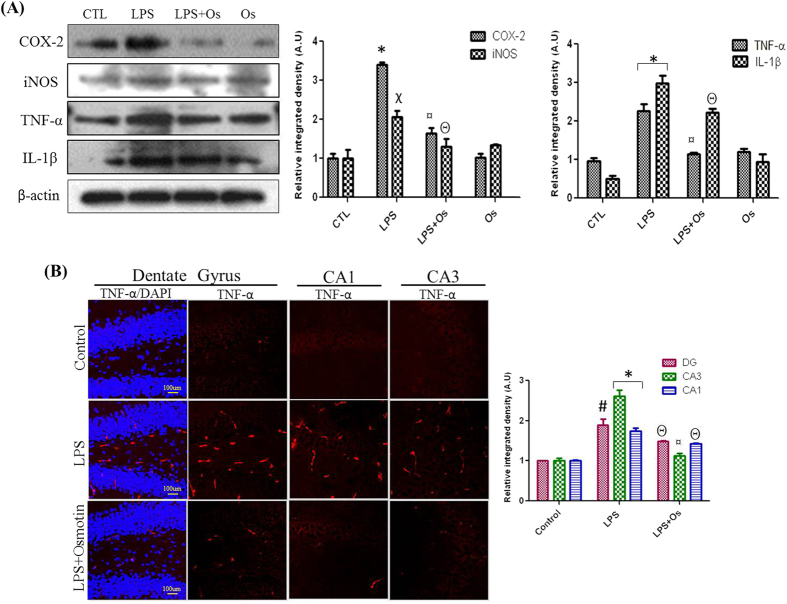
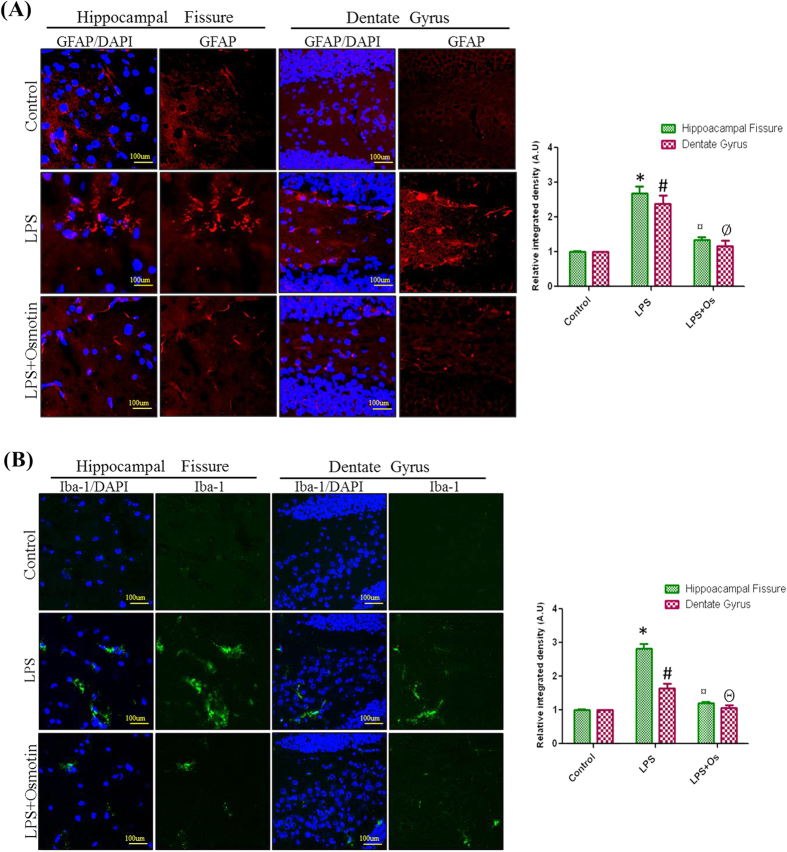
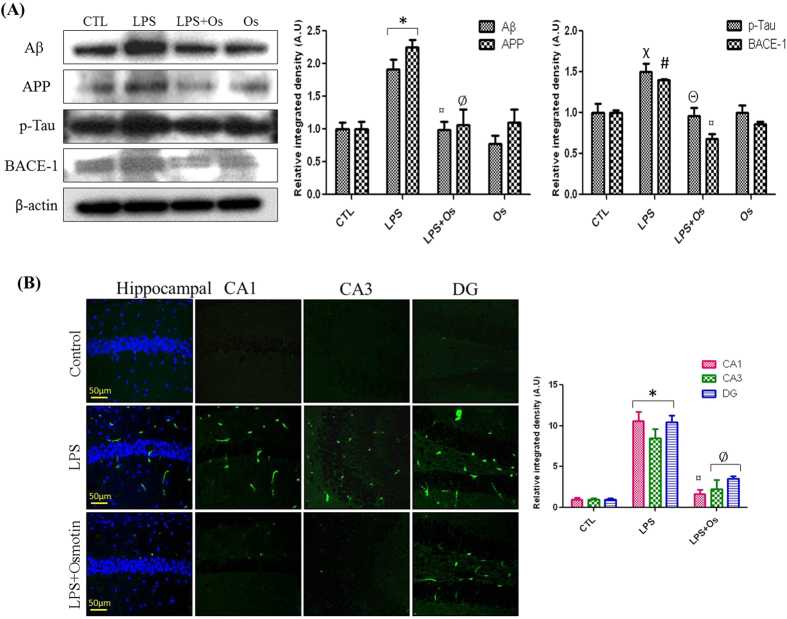
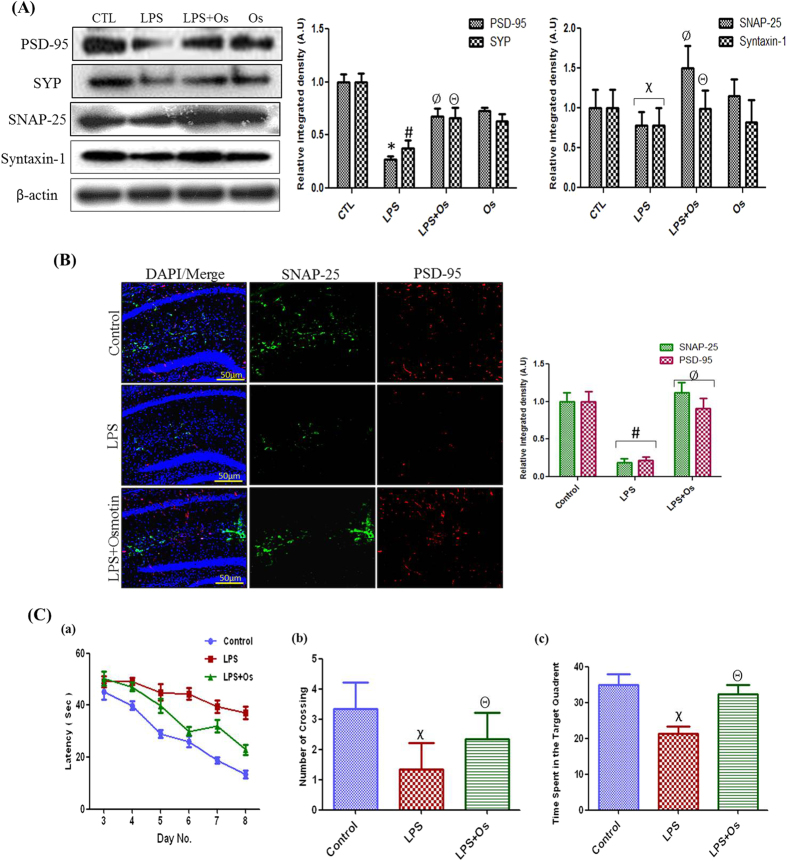
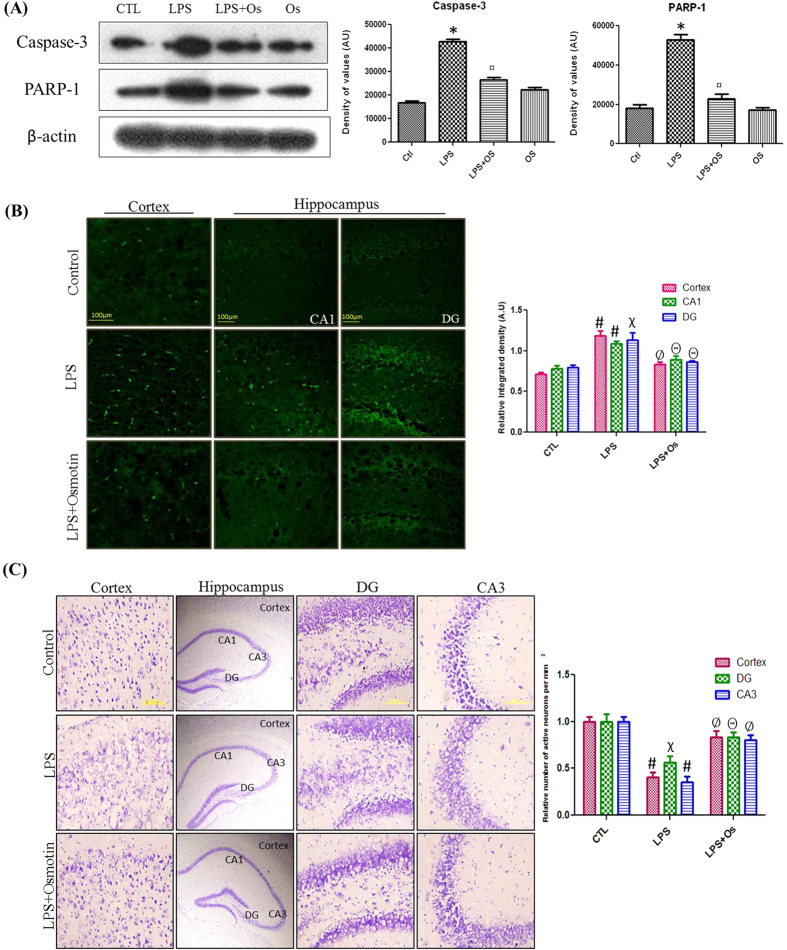
Toll-like receptor 4 (TLR4) signaling in the brain mediates autoimmune responses and induces neuroinflammation that results in neurodegenerative diseases, such as Alzheimer's disease (AD). The plant hormone osmotin inhibited lipopolysaccharide (LPS)-induced TLR4 downstream signaling, including activation of TLR4, CD14, IKKα/β, and NFκB, and the release of inflammatory mediators, such as COX-2, TNF-α, iNOS, and IL-1β. Immunoprecipitation demonstrated colocalization of TLR4 and AdipoR1 receptors in BV2 microglial cells, which suggests that osmotin binds to AdipoR1 and inhibits downstream TLR4 signaling. Furthermore, osmotin treatment reversed LPS-induced behavioral and memory disturbances and attenuated LPS-induced increases in the expression of AD markers, such as Aβ, APP, BACE-1, and p-Tau. Osmotin improved synaptic functionality via enhancing the activity of pre- and post-synaptic markers, like PSD-95, SNAP-25, and syntaxin-1. Osmotin also prevented LPS-induced apoptotic neurodegeneration via inhibition of PARP-1 and caspase-3. Overall, our studies demonstrated that osmotin prevented neuroinflammation-associated memory impairment and neurodegeneration and suggest AdipoR1 as a therapeutic target for the treatment of neuroinflammation and neurological disorders, such as AD.


Figures

Figure 1
Figure 1
Osmotin prevents LPS-induced neuroinflammatory processes via inhibition of the TLR4-NFκB pathway (A) Shown are representative Western blots probed with TLR4, CD14, p-IKKα/β, and p-NFκB antibodies from the hippocampus of adult mice. The density values are expressed in arbitrary units as the mean ± SEM of the indicated proteins (n = 5 animals per group). (B) Shown are representative photomicrographs of immunofluorescence analyses of p-NFκB-positive cells in the experimental groups. Images are representative stains obtained in sections prepared from at least 5 animals per group. All of the panels representing the CA1, CA3, and DG regions of the hippocampus show p-NFκB-stained brain tissue at a magnification of 10× objective field (scale bar = 100 μm) and magnification of 40× objective field (scale bar = 20 μm). Symbol representation for the treatment groups and level of significance are described in the data analysis section of the Materials and Methods.
Figure 2
Figure 2
Anti-inflammatory mechanism of osmotin against LPS-induced neuroinflammation in BV2 microglial cells (A) Shown are representative histograms for (a) Cell Viability, (b) Cytotoxicity, and (c) Caspase-3/7 assays performed under experimental conditions as mentioned in the Materials and Methods section. (B) Shown are representative Western blots probed with TLR4, p-NFκB, and TNF-α antibodies in microglial cells. (C) Shown are immunoprecipitation results followed by representative immunoblots as mentioned in the Materials and Methods section. AdipoR1 colocalizes with the TLR4/CD14 signaling complex in microglial cells. (D) Shown are representative Western blots probed with TLR4 and p-NFκB antibodies in microglial cells. AdipoR1 siRNA transfection significantly inhibited LPS-induced inflammation. The density values are expressed in arbitrary units as the mean ± SEM for the indicated proteins (n = 5 per group). (E) The immunofluorescence images indicate localization of TLR4 (red panels), AdipoR1 (green panels) and merged TLR4 and AdipoR1 (merge panels). The images are representative of staining obtained in sections prepared from at least 5 animals per group (low magnification = 10x, scale bar: low zoom = 50 μm and high zoom = 20 μm). Symbols for treatment groups and levels of significance are mentioned in the data analysis section of the Materials and Methods.
Figure 3
Figure 3
Osmotin inhibits LPS-induced COX-2, iNOS, TNF-α and IL-1β expression (A) Shown are representative western blots probed with antibodies of COX-2, iNOS, TNF-α and IL-1β in the hippocampus of adult mice. The protein bands were quantified using sigma gel software. The density values are expressed in arbitrary units as the mean ± SEM for the indicated proteins (n = 5 animals per group). (B) Showed are representative photomicrographs of immunofluorescence analysis of Tnfα positive cells in the experimental groups. Images are representative of staining obtained in sections prepared from at least 5 animals per group. Panels representing DG, CA1 and CA3 region of hippocampus showed TNF-α stained brain tissue at magnification 10× objective field, scale bar= 100 µm. Symbols for treatment groups and level of significance are mentioned in data analysis section of material methods.
Figure 4
Figure 4. Effect of osmotin on LPS-induced activation of astrocytes and microglia in the hippocampus of adult mice.
Shown are representative photomicrographs of immunofluorescence analyses of (A) astrocytes (GFAP-positive cells) and (B) microglia (Iba-1-positive cells) in the experimental groups. Images are representative of staining obtained in sections prepared from at least 5 animals per group. Panels representing the hippocampal fissure and DG region of the hippocampus show GFAP and Iba-1 stained brain tissue, respectively, at a magnification of 10x objective field, scale bar = 100 μm. Symbols for the treatment groups and levels of significance are mentioned in the data analysis section of the Materials and Methods.
Figure 5
Figure 5. Osmotin inhibits LPS-induced protein expression of Aβ, APP, BACE-1, and p-Tau.
(A) Shown are representative Western blots probed with Aβ, APP, BACE-1, and p-Tau antibodies in the hippocampus of adult mice. The density values are expressed in arbitrary units as the mean ± SEM for the indicated proteins (n = 5 animals per group). (B) Shown are representative photomicrographs of immunofluorescence analyses of Aβ-positive cells in the experimental groups. Images are representative of staining obtained in sections prepared from at least 5 animals per group. All of the panels representing the CA1, CA3, and DG regions of the hippocampus show Aβ-stained brain tissue at a magnification of 10x objective field, scale bar = 50 μm. Symbols for treatment groups and levels of significance are mentioned in the data analysis section of the Materials and Methods.
Figure 6
Figure 6. Effect of osmotin on LPS-induced synaptic dysfunction and memory impairment.
(A) Shown are representative Western blots probed with PSD-95, SNAP-25, SYP, and syntaxin-1 antibodies in the hippocampus of adult mice. The density values are expressed in arbitrary units as the mean ± SEM for the indicated proteins (n = 5 animals per group). (B) Shown are representative photomicrographs of immunofluorescence analysis of PSD-95- and SNAP-25-positive cells in the experimental groups. Images are representative of staining obtained in sections prepared from at least 5 animals per group. All of the panels representing the hippocampus show PSD-95- and SNAP-25-stained brain tissue at a magnification of 10x objective field, scale bar = 50 μm. Symbols for treatment groups and level of significance are mentioned in the data analysis section of the Materials and Methods. (C) Behavioral studies show osmotin improves memory impairment in LPS-treated mice (n = 5 per group). (a) Average escape latency time for experimental mice to reach the hidden platform from day 3 to day 8. (b) The number of crossings at the hidden platform during the probe test of the Morris water maze experiment. (c) Time spent in the platform quadrant, where the hidden platform was placed during the trial session. Symbols for treatment groups and levels of significance are mentioned in the data analysis section of the Materials and Methods.
Figure 7
Figure 7
Osmotin attenuated LPS-induced apoptotic neurodegeneration in the hippocampus of adult mice (A) Shown are representative Western blots probed with caspase-3 and PARP-1 antibodies in the hippocampus of adult mice. The density values are expressed in arbitrary units as the mean ± SEM for the indicated proteins (n = 5 animals per group). Shown are representative photomicrographs of (B) FJB staining (magnification 40× objective field, scale bar = 100 μm) and (C) Nissl staining (magnification 20× objective field, scale bar = 200 μm) for dead and damaged neurons. Images are representative of staining obtained in sections prepared from at least 5 animals per group. Symbols for treatment groups and level of significance are mentioned in the data analysis section of the Materials and Methods.

References

    1. Badshah H. et al. Protective effect of lupeol against lipopolysaccharide-induced neuroinflammation via the p38/c-Jun N-terminal kinase pathway in the adult mouse brain J. Neuroimmune Pharmacol. 11, 48–60 (2016). - PubMed
    1. Parajuli B. et al. GM-CSF increase LPS-induced production of proinflammatory mediators via upregulation of TLR4 and CD14 in murine microglia. J. Neuroinflammation 9, 268 (2012). - PMC - PubMed
    1. Font-Nieves M. et al. Induction of COX-2 enzyme and down-regulation of COX-1 expression by lipopolysaccharide (LPS) control prostaglandin E2 production in astrocytes. J. Biol. Chem. 287, 6564–68 (2012). - PMC - PubMed
    1. Rosi S. et al. Memantine protects against LPS-induced neuroinflammation, restores behaviourally-induced gene expression and spatial learning in the rat. Neuroscience 142, 1303–15 (2006). - PubMed
    1. Okun E., Griffioen K. J. & Mattson M. P. Toll-like receptor signaling in neural plasticity and disease. Trends Neurosci. 34, 269–81 (2011). - PMC - PubMed

Publication types

MeSH terms