

A novel accelerometry-based algorithm for the detection of step durations over short episodes of gait in healthy elderly
- PMID: 27093956
- PMCID: PMC4837611
- DOI: 10.1186/s12984-016-0145-6
A novel accelerometry-based algorithm for the detection of step durations over short episodes of gait in healthy elderly
Abstract
Background: The assessment of short episodes of gait is clinically relevant and easily implemented, especially given limited space and time requirements. BFS (body-fixed-sensors) are small, lightweight and easy to wear sensors, which allow the assessment of gait at relative low cost and with low interference. Thus, the assessment with BFS of short episodes of gait, extracted from dailylife physical activity or measured in a standardised and supervised setting, may add value in the study of gait quality of the elderly. The aim of this study was to evaluate the accuracy of a novel algorithm based on acceleration signals recorded at different human locations (lower back and heels) for the detection of step durations over short episodes of gait in healthy elderly subjects.
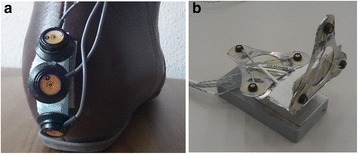
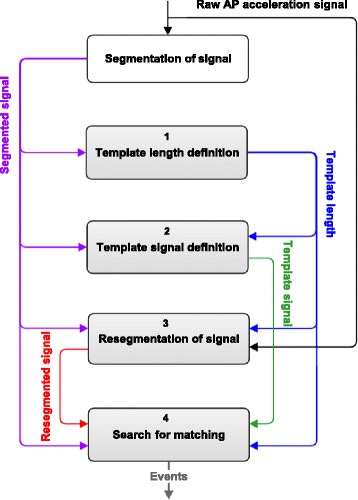
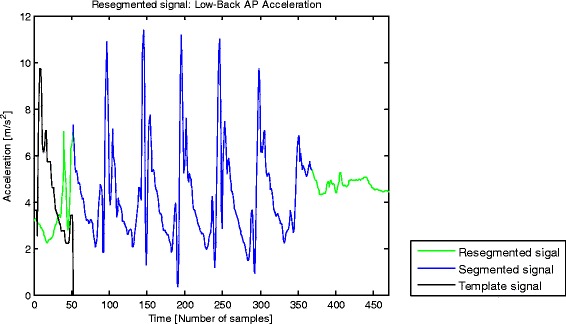
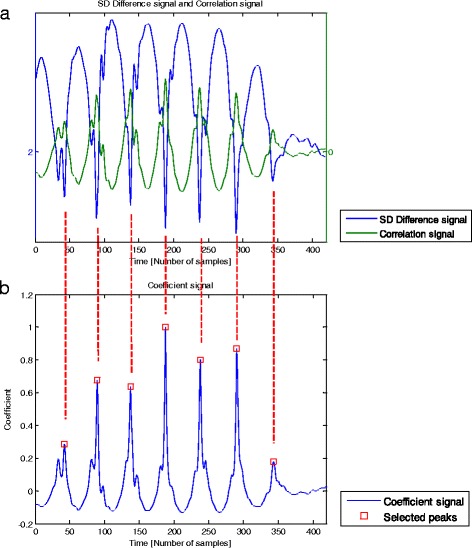
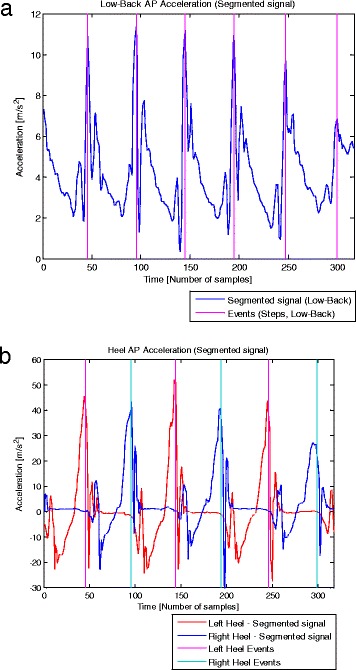
Methods: Twenty healthy elderly subjects (73.7 ± 7.9 years old) walked twice a distance of 5 m, wearing a BFS on the lower back, and on the outside of each heel. Moreover, an optoelectronic three-dimensional (3D) motion tracking system was used to detect step durations. A novel algorithm is presented for the detection of step durations from low-back and heel acceleration signals separately. The accuracy of the algorithm was assessed by comparing absolute differences in step duration between the three methods: step detection from the optoelectronic 3D motion tracking system, step detection from the application of the novel algorithm to low-back accelerations, and step detection from the application of the novel algorithm to heel accelerations.
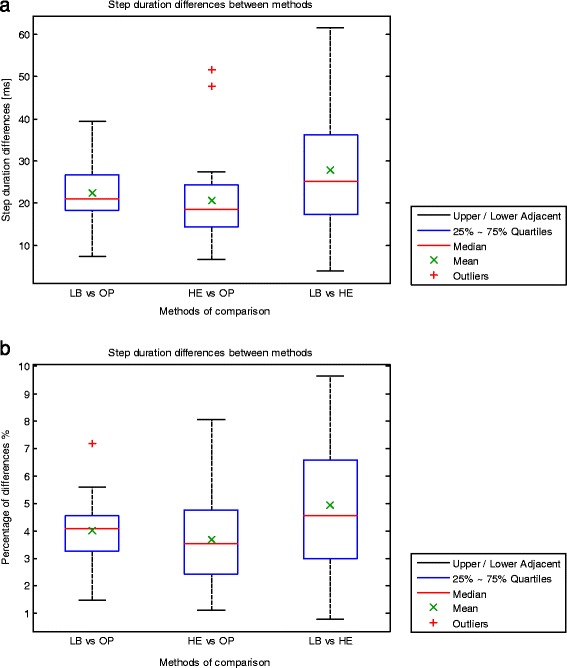
Results: The proposed algorithm successfully detected all the steps, without false positives and without false negatives. Absolute average differences in step duration within trials and across subjects were calculated for each comparison, between low-back accelerations and the optoelectronic system were on average 22.4 ± 7.6 ms (4.0 ± 1.3 % of average step duration), between heel accelerations and the optoelectronic system were on average 20.7 ± 11.8 ms (3.7 ± 1.9 %), and between low-back accelerations and heel accelerations were on average 27.8 ± 15.1 ms (4.9 ± 2.5 % of average step duration).
Conclusions: This study showed that the presented novel algorithm detects step durations over short episodes of gait in healthy elderly subjects with acceptable accuracy from low-back and heel accelerations, which provides opportunities to extract a range of gait parameters from short episodes of gait.
Keywords: Accelerometers; Analysis of short episodes of gait; Body-fixed-sensors; Healthy elderly; Heel accelerometry; Low-back accelerometry; Step duration detection.
Figures
Similar articles
-
Upper body accelerations during walking in healthy young and elderly men.Gait Posture. 2004 Dec;20(3):291-8. doi: 10.1016/j.gaitpost.2003.10.004. Gait Posture. 2004. PMID: 15531176 Clinical Trial.
-
Heel and toe clearance estimation for gait analysis using wireless inertial sensors.IEEE Trans Biomed Eng. 2012 Nov;59(11):3162-8. doi: 10.1109/TBME.2012.2216263. Epub 2012 Sep 4. IEEE Trans Biomed Eng. 2012. PMID: 22955865
-
Step Detection and Parameterization for Gait Assessment Using a Single Waist-Worn Accelerometer.IEEE Trans Biomed Eng. 2016 May;63(5):933-942. doi: 10.1109/TBME.2015.2480296. Epub 2015 Sep 18. IEEE Trans Biomed Eng. 2016. PMID: 26394415
-
Analysis of the performance of 17 algorithms from a systematic review: Influence of sensor position, analysed variable and computational approach in gait timing estimation from IMU measurements.Gait Posture. 2018 Oct;66:76-82. doi: 10.1016/j.gaitpost.2018.08.025. Epub 2018 Aug 23. Gait Posture. 2018. PMID: 30170137
-
Accelerometry: a technique for quantifying movement patterns during walking.Gait Posture. 2008 Jul;28(1):1-15. doi: 10.1016/j.gaitpost.2007.10.010. Epub 2008 Feb 21. Gait Posture. 2008. PMID: 18178436 Review.
Cited by
-
Smart Eyeglasses: A Valid and Reliable Device to Assess Spatiotemporal Parameters during Gait.Sensors (Basel). 2022 Feb 4;22(3):1196. doi: 10.3390/s22031196. Sensors (Basel). 2022. PMID: 35161941 Free PMC article.
-
Validation of a Step Detection Algorithm during Straight Walking and Turning in Patients with Parkinson's Disease and Older Adults Using an Inertial Measurement Unit at the Lower Back.Front Neurol. 2017 Sep 4;8:457. doi: 10.3389/fneur.2017.00457. eCollection 2017. Front Neurol. 2017. PMID: 28928711 Free PMC article.
-
Design and validation of a multi-task, multi-context protocol for real-world gait simulation.J Neuroeng Rehabil. 2022 Dec 16;19(1):141. doi: 10.1186/s12984-022-01116-1. J Neuroeng Rehabil. 2022. PMID: 36522646 Free PMC article.
-
Predicting vertical ground reaction forces from 3D accelerometry using reservoir computers leads to accurate gait event detection.Front Sports Act Living. 2022 Oct 26;4:1037438. doi: 10.3389/fspor.2022.1037438. eCollection 2022. Front Sports Act Living. 2022. PMID: 36385782 Free PMC article.
-
Field based assessment of a tri-axial accelerometers validity to identify steps and reliability to quantify external load.Front Physiol. 2022 Sep 12;13:942954. doi: 10.3389/fphys.2022.942954. eCollection 2022. Front Physiol. 2022. PMID: 36171976 Free PMC article.
References
-
- Aminian K, Najafi B. Capturing human motion using body-fixed sensors: outdoor measurement and clinical applications. Comput Animat Virtual Worlds. 2004;15(2):79–94. doi: 10.1002/cav.2. - DOI
Publication types
MeSH terms
LinkOut - more resources
Full Text Sources
Other Literature Sources
