. 2016 Apr 19;7(2):e00417-16.
doi: 10.1128/mBio.00417-16.

Evaluation of Antihemagglutinin and Antineuraminidase Antibodies as Correlates of Protection in an Influenza A/H1N1 Virus Healthy Human Challenge Model

Affiliations

Evaluation of Antihemagglutinin and Antineuraminidase Antibodies as Correlates of Protection in an Influenza A/H1N1 Virus Healthy Human Challenge Model

Matthew J Memoli et al. mBio. .

Abstract

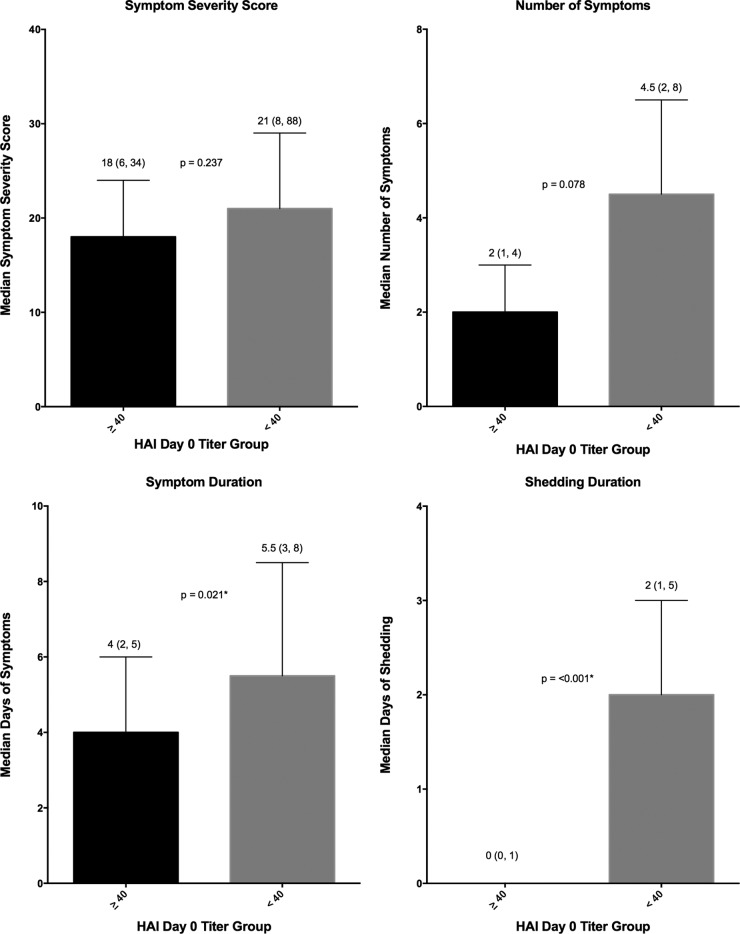
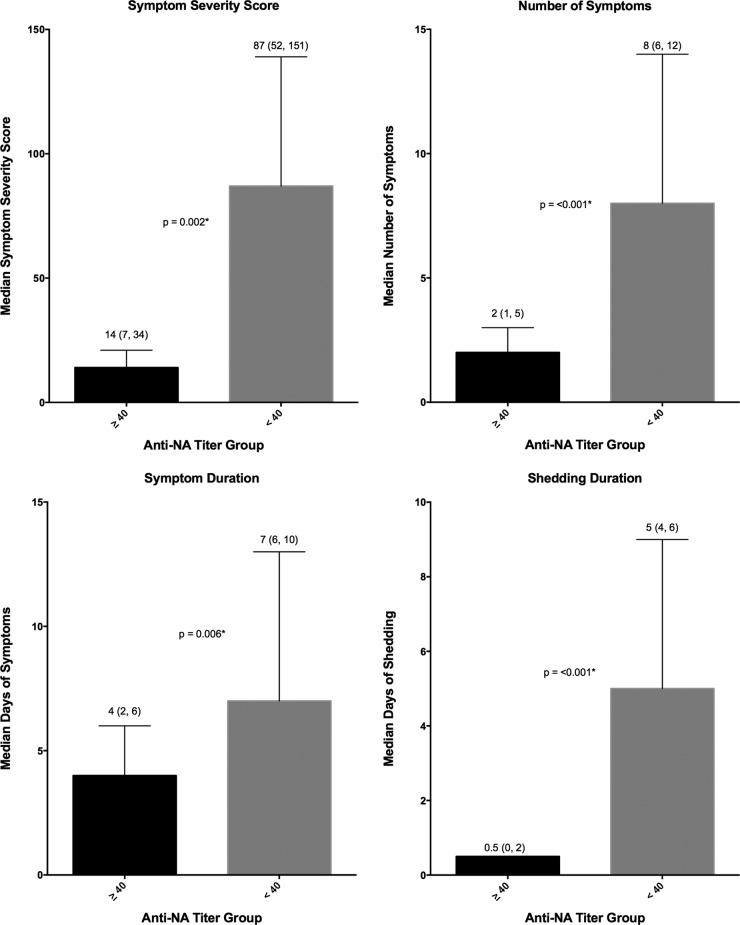
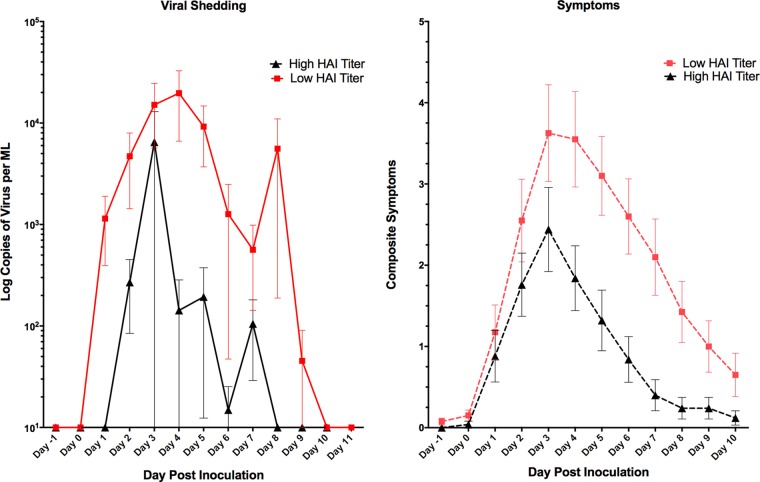
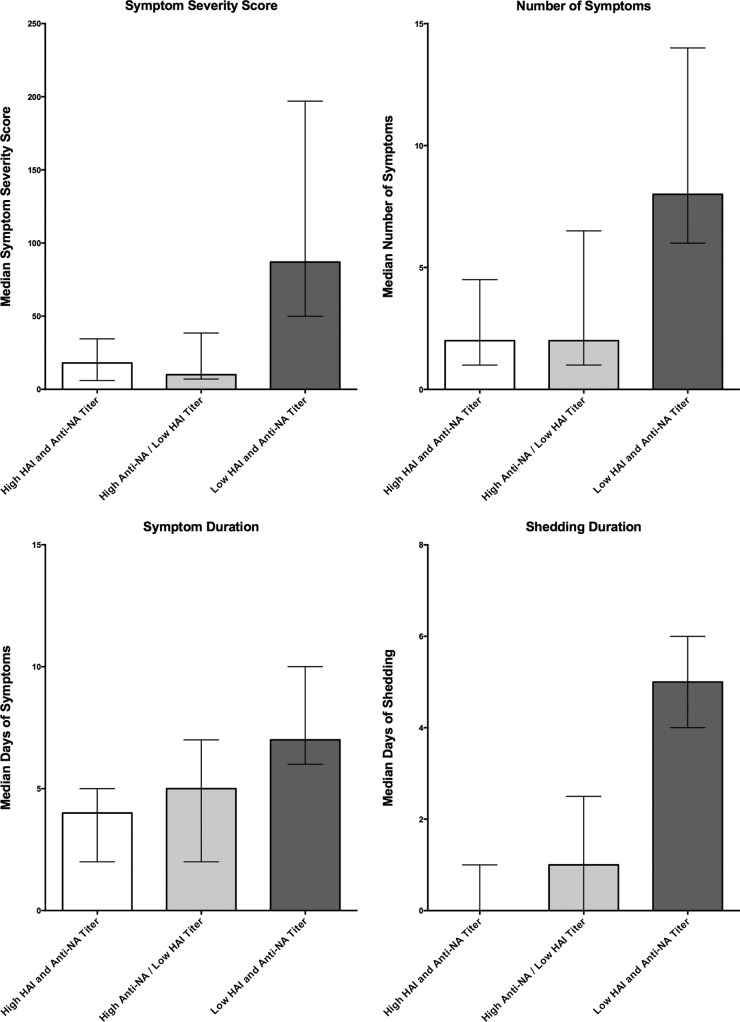
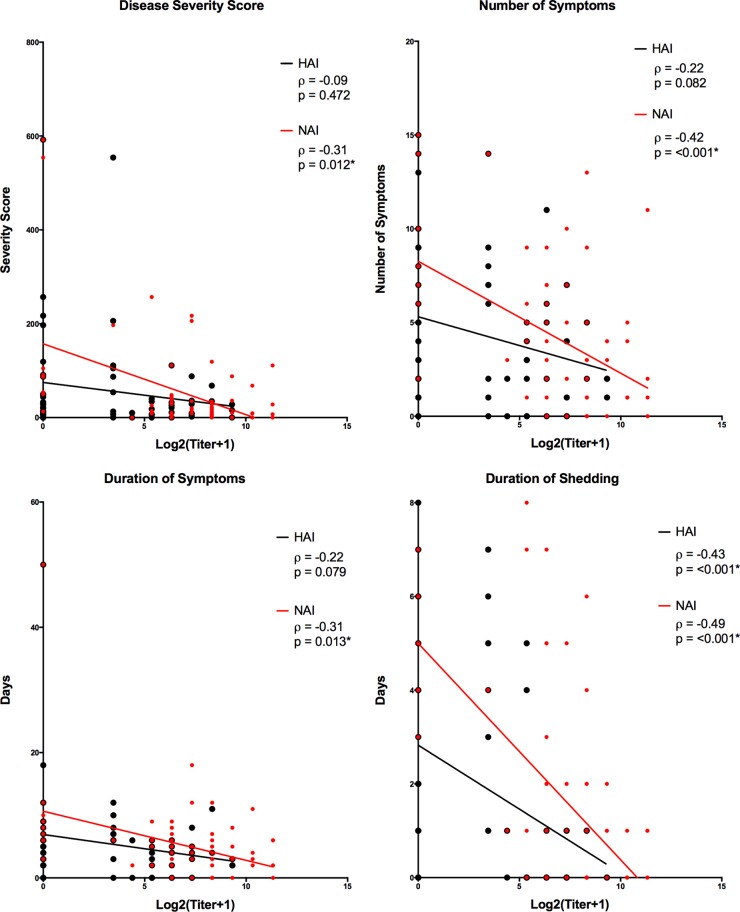
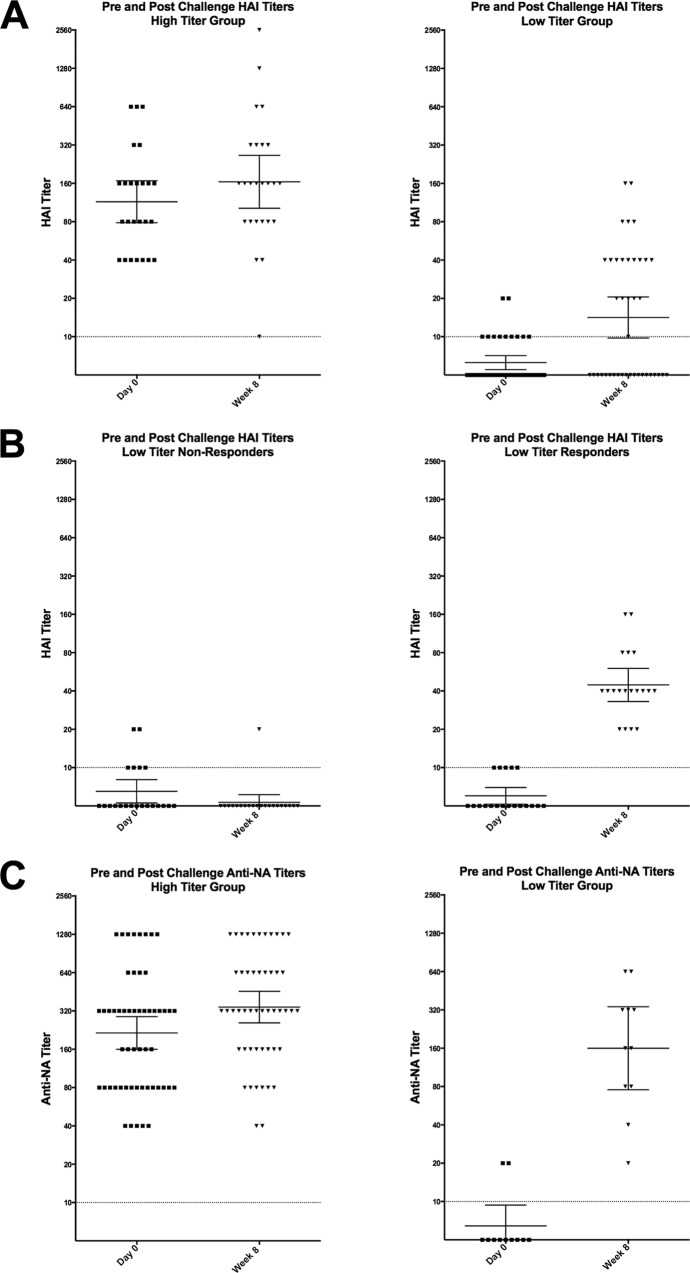
Despite long-term investment, influenza continues to be a significant worldwide problem. The cornerstone of protection remains vaccination, and approved vaccines seek to elicit a hemagglutination inhibition (HAI) titer of ≥1:40 as the primary correlate of protection. However, recent poor vaccine performance raises questions regarding the protection afforded and whether other correlates of protection should be targeted. A healthy volunteer challenge study was performed with a wild-type 2009 A(H1N1)pdm influenza A challenge virus at the NIH Clinical Center to evaluate two groups of participants with HAI titers of ≥1:40 and <1:40. The primary objective was to determine whether participants with HAI titers of ≥1:40 were less likely to develop mild to moderate influenza disease (MMID) after intranasal inoculation. HAI titers of ≥1:40 were protective against MMID but did not reduce the incidence of symptoms alone. Although the baseline HAI titer correlated with some reduction in disease severity measures, overall, the baseline NAI titer correlated more significantly with all disease severity metrics and had a stronger independent effect on outcome. This study demonstrates the importance of examining other immunological correlates of protection rather than solely HAI titers. This challenge study confirms the importance of NAI titer as a correlate and for the first time establishes that it can be an independent predictor of reduction of all aspects of influenza disease. This suggests that NAI titer may play a more significant role than previously thought and that neuraminidase immunity should be considered when studying susceptibility after vaccination and as a critical target in future influenza vaccine platforms.

Importance: This study represents the first time the current gold standard for evaluating influenza vaccines as set by the U.S. Food and Drug Administration and the European Medicines Agency Committee for Medicinal Products for Human Use, a "protective" hemagglutination inhibition (HAI) titer of ≥1:40, has been evaluated in a well-controlled healthy volunteer challenge study since the cutoff was established. We used our established wild-type influenza A healthy volunteer human challenge model to evaluate how well this antibody titer predicts a reduction in influenza virus-induced disease. We demonstrate that although higher HAI titer is predictive of some protection, there is stronger evidence to suggest that neuraminidase inhibition (NAI) titer is more predictive of protection and reduced disease. This is the first time NAI titer has been clearly identified in a controlled trial of this type to be an independent predictor of a reduction in all aspects of influenza.


Figures

FIG 1
FIG 1
Study flow chart. A total of 200 volunteers were screened for participation. Of these volunteers, 74 were enrolled in the study with 40 in the high-HAI-titer group and 34 in the low-HAI-titer group up to 3 months prior to challenge. On admission for challenge, 16 participants were found to have HAI titers that had increased or decreased since the time of screening either due to waning titers or exposure to virus. Three participants were excluded prior to challenge for safety reasons. Thirty-one participants on the high-titer group and 40 participants in the low-titer group were challenged, and 6 participants in the high-titer group were excluded from the analysis due to detection of another respiratory viral infection within 48 h of challenge.
FIG 2
FIG 2
Disease severity measures in high- and low-HAI-titer groups. Symptom severity score (FLU-Pro participant self-assessment), number of symptoms, symptom duration, and shedding duration were evaluated for the participants in the groups with an HAI titer of ≥1:40 or <1:40. The median values (indicated by the bars) are shown as the first value above the bar. The interquartile ranges (indicated by the error bars) are shown in parentheses above the bars. The P values generated by the Wilcoxon rank sum test (two sided at 0.05 level) are indicated between the bars for the two HAI titer groups; P values that are statistically significant are indicated by an asterisk.
FIG 3
FIG 3
Quantity and timing of viral shedding and composite symptoms. The mean composite symptoms and shedding based on HAI titer groups are shown. Overall, there was primarily a decrease in the duration of shedding and symptoms in those with a higher baseline HAI titer. Values are means ± standard errors of the means (SEM) (error bars).
FIG 4
FIG 4
Disease severity measures in high- and low-NAI-titer groups. Symptom severity score (FLU-Pro participant self-assessment), number of symptoms, symptom duration, and shedding duration were evaluated for the participants in the groups with an NAI titer of ≥1:40 and <1:40. The median values (indicated by the bars) are shown as the first value above the bar. The interquartile ranges (indicated by the error bars) are shown in parentheses above the bars. The P values generated by the Wilcoxon rank sum test (two sided at 0.05 level) are indicated between the bars for the two NAI titer groups; P values that are statistically significant are indicated by an asterisk.
FIG 5
FIG 5
Disease severity measures in participants grouped by combinations of HAI and NAI titers. Participants were placed into three groups, those with HAI titers and NAI titers of ≥1:40 (high HAI and NAI titers; n = 25), those with HAI titers of <1:40 but with NAI titers of ≥1:40 (high NAI/low HAI titers; n = 11), and those with HAI and NAI titers of <1:40 (low HAI and NAI titers; n = 29). There were no individuals with low NAI and high HAI titers at baseline. For each disease metric, bars represent the median values, and error bars represent the interquartile ranges.
FIG 6
FIG 6
Linear correlation of baseline titer to disease severity measures. Two variable correlations were calculated using Spearman’s correlation coefficient between baseline HAI titer and all four disease severity measures (black), as well as between baseline NAI titers and all four disease severity measures (red). (Overlapping red and black points cause the red symbol to appear larger due to the presence of a black symbol in the same location.)
FIG 7
FIG 7
HAI and NAI titer responses postchallenge. (A) HAI titer on day 0 (prechallenge) and week 8 (postchallenge) in the participants in the low- and high-HAI-titer groups. (B) Approximately 50% of those in the low-HAI-titer group demonstrated no significant HAI response postchallenge. (C) All participants with a low NAI titer prechallenge demonstrated a significant rise in NAI titer 8 weeks postchallenge. Each symbol represents the value for an individual participant. Horizontal lines represent geometric means with 95% confidence intervals indicated by the error bars. Dotted lines represent the lower limit of detection.

References

    1. Centers for Disease Control and Prevention 2010. Estimates of deaths associated with seasonal influenza—United States, 1976–2007. MMWR Morb Mortal Wkly Rep 59:1057–1062. - PubMed
    1. Stohr K, Esveld M. 2004. Public health. Will vaccines be available for the next influenza pandemic? Science 306:2195–2196. doi:10.1126/science.1108165. - DOI - PubMed
    1. Thompson WW, Shay DK, Weintraub E, Brammer L, Cox N, Anderson LJ, Fukuda K. 2003. Mortality associated with influenza and respiratory syncytial virus in the United States. JAMA 289:179–186. doi:10.1001/jama.289.2.179. - DOI - PubMed
    1. Lambert LC, Fauci AS. 2010. Influenza vaccines for the future. N Engl J Med 363:2036–2044. doi:10.1056/NEJMra1002842. - DOI - PubMed
    1. Nichol KL. 2003. The efficacy, effectiveness and cost-effectiveness of inactivated influenza virus vaccines. Vaccine 21:1769–1775. doi:10.1016/S0264-410X(03)00070-7. - DOI - PubMed

Publication types

MeSH terms