

SNP- and haplotype-based genome-wide association studies for growth, carcass, and meat quality traits in a Duroc multigenerational population
- PMID: 27094516
- PMCID: PMC4837538
- DOI: 10.1186/s12863-016-0368-3
SNP- and haplotype-based genome-wide association studies for growth, carcass, and meat quality traits in a Duroc multigenerational population
Abstract
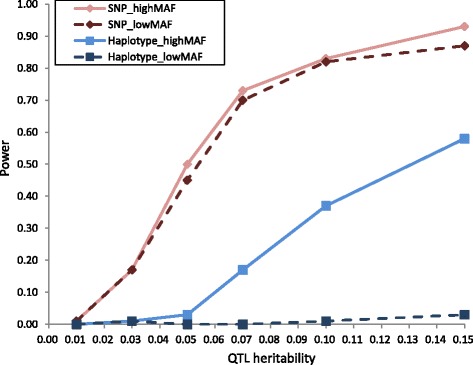
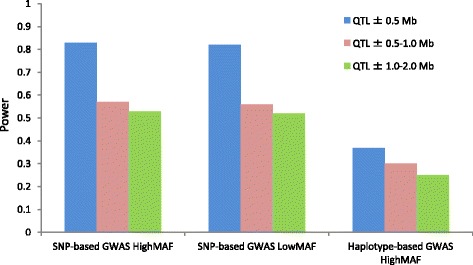
Background: The aim of the present study was to compare the power of single nucleotide polymorphism (SNP)-based genome-wide association study (GWAS) and haplotype-based GWAS for quantitative trait loci (QTL) detection, and to detect novel candidate genes affecting economically important traits in a purebred Duroc population comprising seven-generation pedigree. First, we performed a simulation analysis using real genotype data of this population to compare the power (based on the null hypothesis) of the two methods. We then performed GWAS using both methods and real phenotype data comprising 52 traits, which included growth, carcass, and meat quality traits.
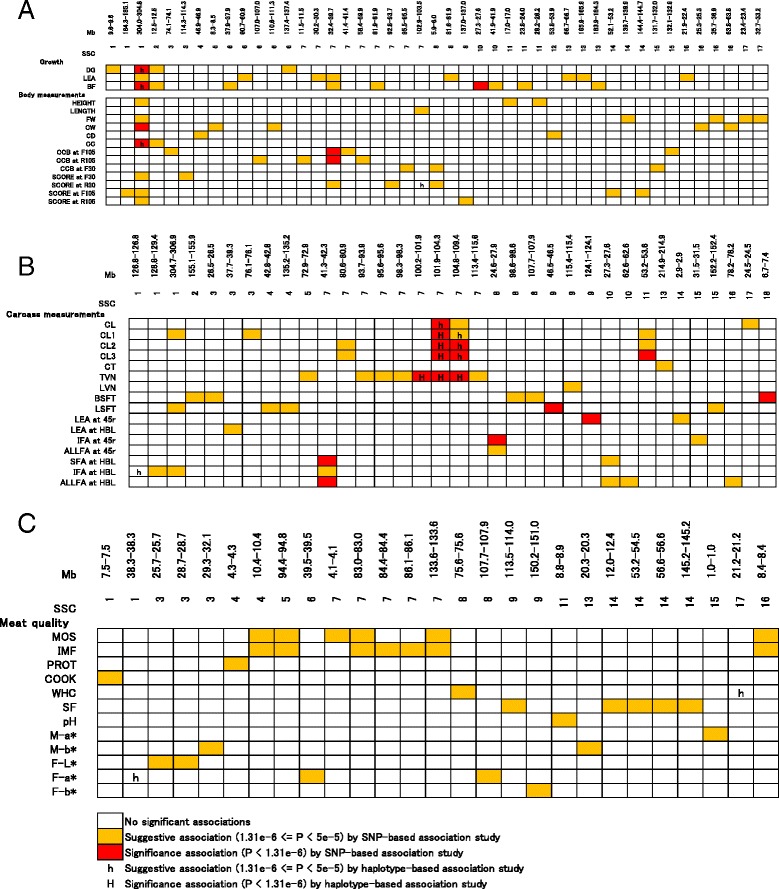
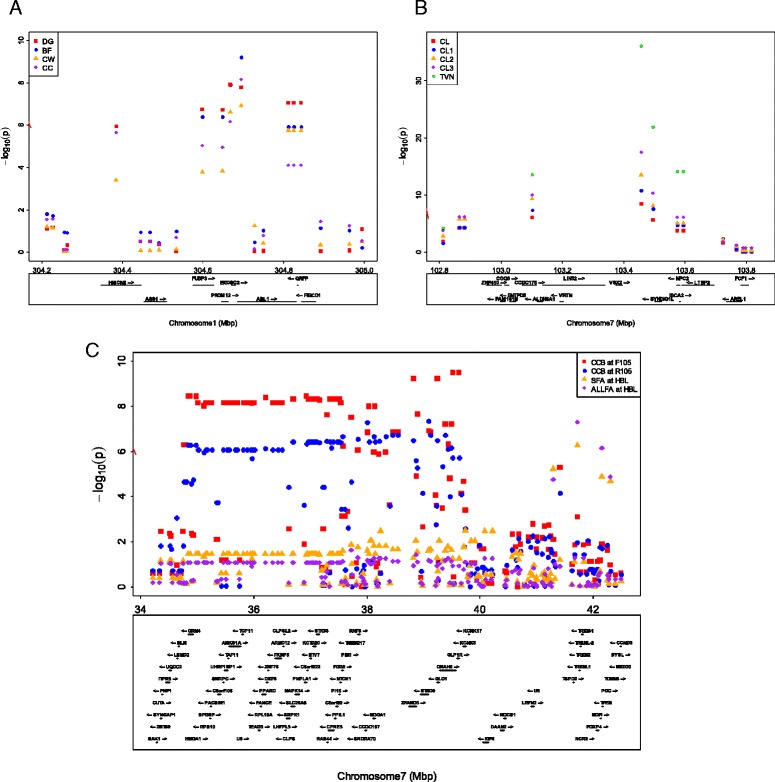
Results: In total, 836 animals were genotyped using the Illumina PorcineSNP60 BeadChip and 14 customized SNPs from regions of known candidate genes related to the traits of interest. The power of SNP-based GWAS was greater than that of haplotype-based GWAS in a simulation analysis. In real data analysis, a larger number of significant regions was obtained by SNP-based GWAS than by haplotype-based GWAS. For SNP-based GWAS, 23 genome-wide significant SNP regions were detected for 17 traits, and 120 genome-wide suggestive SNP regions were detected for 27 traits. For haplotype-based GWAS, 6 genome-wide significant SNP regions were detected for four traits, and 11 genome-wide suggestive SNP regions were detected for eight traits. All genome-wide significant SNP regions detected by haplotype-based GWAS were located in regions also detected by SNP-based GWAS. Four regions detected by SNP-based GWAS were significantly associated with multiple traits: on Sus scrofa chromosome (SSC) 1 at 304 Mb; and on SSC7 at 35-39 Mb, 41-42 Mb, and 103 Mb. The vertnin gene (VRTN) in particular, was located on SSC7 at 103 Mb and was significantly associated with vertebrae number and carcass lengths. Mapped QTL regions contain some candidate genes involved in skeletal formation (FUBP3; far upstream element binding protein 3) and fat deposition (METTL3; methyltransferase like 3).
Conclusion: Our results show that a multigenerational pig population is useful for detecting QTL, which are typically segregated in a purebred population. In addition, a novel significant region could be detected by SNP-based GWAS as opposed to haplotype-based GWAS.
Keywords: Duroc pigs; Haplotype-based GWAS; Known candidate genes; Production traits; SNP-based GWAS.
Figures
Similar articles
-
A genome-wide association study of production traits in a commercial population of Large White pigs: evidence of haplotypes affecting meat quality.Genet Sel Evol. 2014 Feb 14;46(1):12. doi: 10.1186/1297-9686-46-12. Genet Sel Evol. 2014. PMID: 24528607 Free PMC article.
-
Genome-wide mapping and identification of new quantitative trait loci affecting meat production, meat quality, and carcass traits within a Duroc purebred population.J Anim Sci. 2011 Mar;89(3):601-8. doi: 10.2527/jas.2010-3119. Epub 2010 Nov 19. J Anim Sci. 2011. PMID: 21097684
-
Genome-wide association studies reveal additional related loci for fatty acid composition in a Duroc pig multigenerational population.Anim Sci J. 2017 Oct;88(10):1482-1490. doi: 10.1111/asj.12793. Epub 2017 Apr 12. Anim Sci J. 2017. PMID: 28402008
-
Genome-wide association studies reveal novel loci associated with carcass and body measures in beef cattle.Arch Biochem Biophys. 2020 Nov 15;694:108543. doi: 10.1016/j.abb.2020.108543. Epub 2020 Aug 13. Arch Biochem Biophys. 2020. PMID: 32798459 Review.
-
Genome wide copy number variations using Porcine 60K SNP Beadchip in Landlly pigs.Anim Biotechnol. 2023 Nov;34(6):1891-1899. doi: 10.1080/10495398.2022.2056047. Epub 2022 Apr 4. Anim Biotechnol. 2023. PMID: 35369845 Review.
Cited by
-
Genome-wide DNA methylation analysis in Chinese Chenghua and Yorkshire pigs.BMC Genom Data. 2021 Jun 16;22(1):21. doi: 10.1186/s12863-021-00977-0. BMC Genom Data. 2021. PMID: 34134626 Free PMC article.
-
Genomics of Heat Tolerance in Reproductive Performance Investigated in Four Independent Maternal Lines of Pigs.Front Genet. 2020 Jun 30;11:629. doi: 10.3389/fgene.2020.00629. eCollection 2020. Front Genet. 2020. PMID: 32695139 Free PMC article.
-
Genome-Wide Association Analysis Identifies Genomic Regions and Candidate Genes for Growth and Fatness Traits in Diannan Small-Ear (DSE) Pigs.Animals (Basel). 2023 May 8;13(9):1571. doi: 10.3390/ani13091571. Animals (Basel). 2023. PMID: 37174608 Free PMC article.
-
Haplotype-based genome-wide association studies for carcass and growth traits in chicken.Poult Sci. 2020 May;99(5):2349-2361. doi: 10.1016/j.psj.2020.01.009. Epub 2020 Mar 26. Poult Sci. 2020. PMID: 32359570 Free PMC article.
-
Haplotype-Based Genome-Wide Association Study and Identification of Candidate Genes Associated with Carcass Traits in Hanwoo Cattle.Genes (Basel). 2020 May 14;11(5):551. doi: 10.3390/genes11050551. Genes (Basel). 2020. PMID: 32423003 Free PMC article.
References
-
- Suzuki K, Kadowaki H, Shibata T, Uchida H, Nishida A. Selection for daily gain, loin-eye area, backfat thickness and intramuscular fat based on desired gains over seven generations of Duroc pigs. Livest Prod Sci. 2005;97:193–202. doi: 10.1016/j.livprodsci.2005.04.007. - DOI
-
- Kadowaki H, Suzuki E, Kojima-Shibata C, Suzuki K, Okamura T, Onodera W, et al. Selection for resistance to swine mycoplasmal pneumonia over 5 generations in Landrace pigs. Livest Sci. 2012;147:20–26. doi: 10.1016/j.livsci.2012.03.014. - DOI
-
- Soma Y, Uemoto Y, Sato S, Shibata T, Kadowaki H, Kobayashi E, et al. Genome-wide mapping and identification of new quantitative trait loci affecting meat production, meat quality, and carcass traits within a Duroc purebred population. J Anim Sci. 2011;89:601–608. doi: 10.2527/jas.2010-3119. - DOI - PubMed
Publication types
MeSH terms
Substances
LinkOut - more resources
Full Text Sources
Other Literature Sources
Molecular Biology Databases
Miscellaneous
