. 2016 Apr 20:7:11349.
doi: 10.1038/ncomms11349.

Cell-cycle-independent transitions in temporal identity of mammalian neural progenitor cells

Affiliations

Cell-cycle-independent transitions in temporal identity of mammalian neural progenitor cells

Mayumi Okamoto et al. Nat Commun. .

Abstract

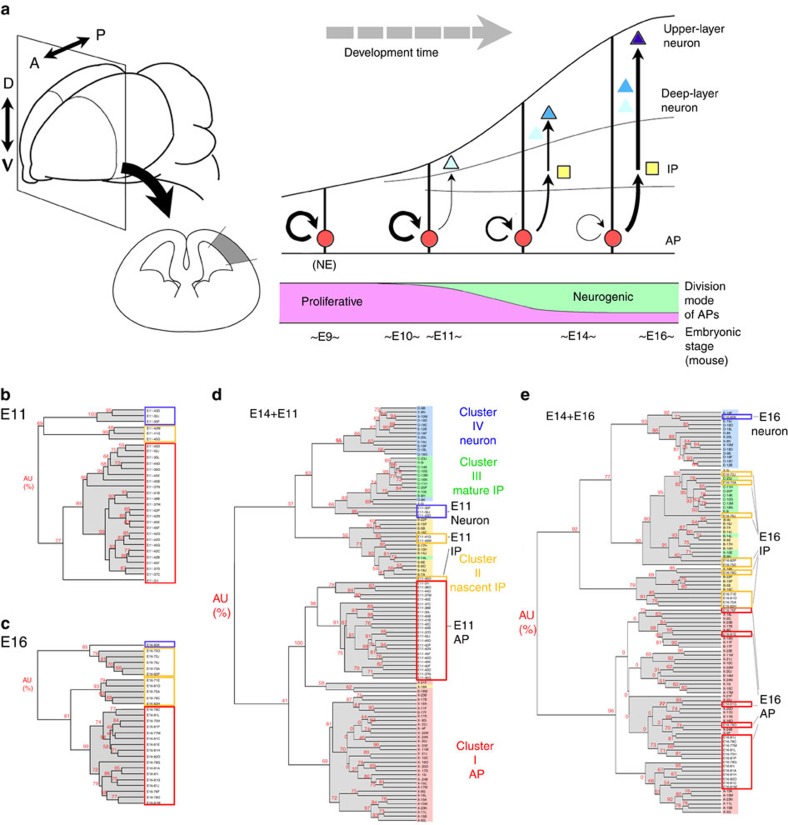
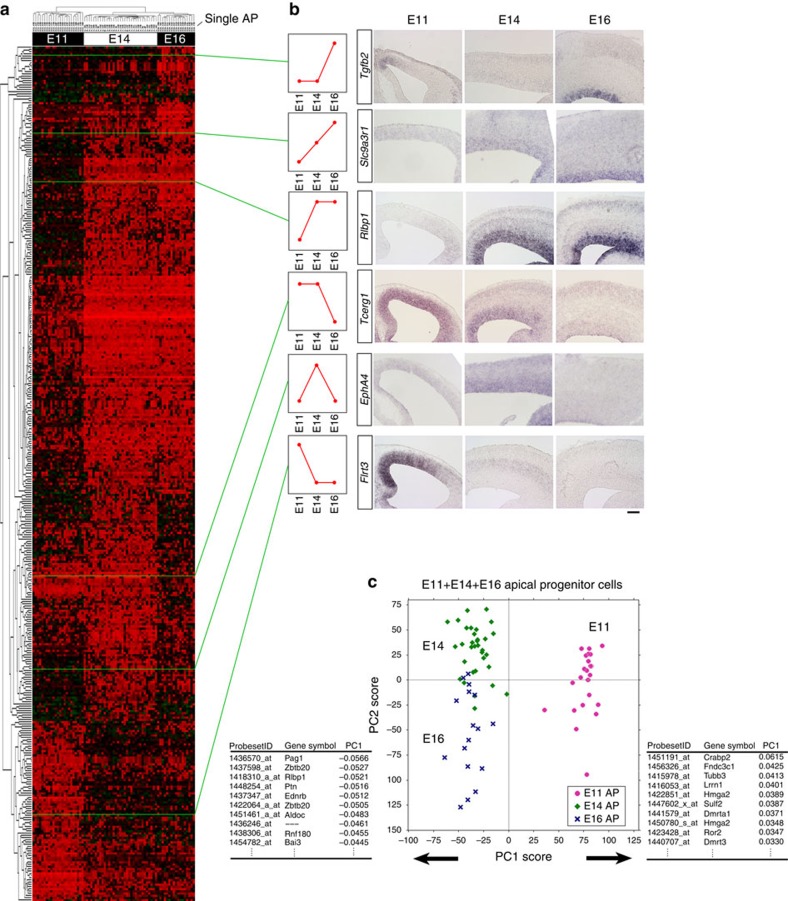
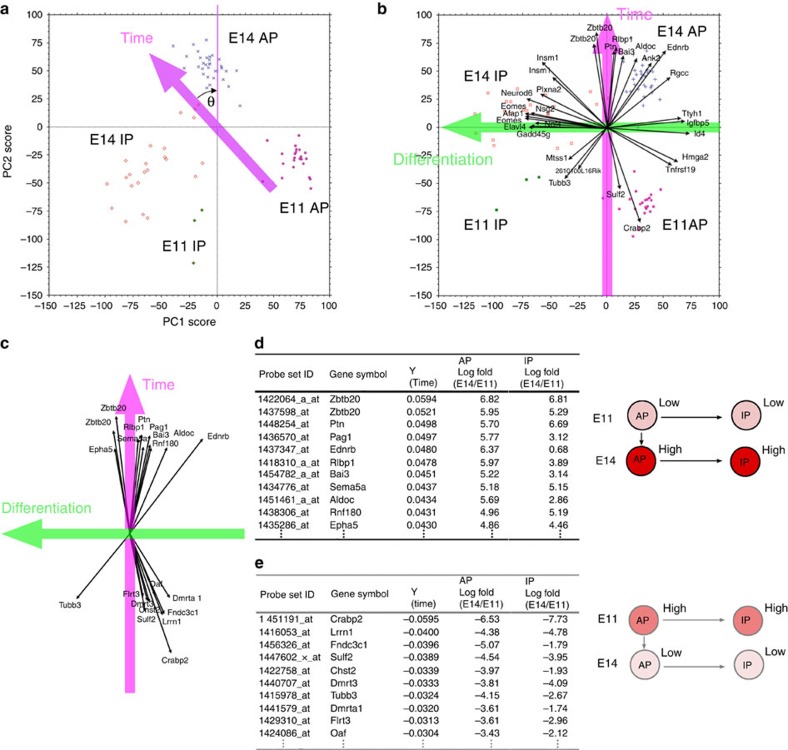
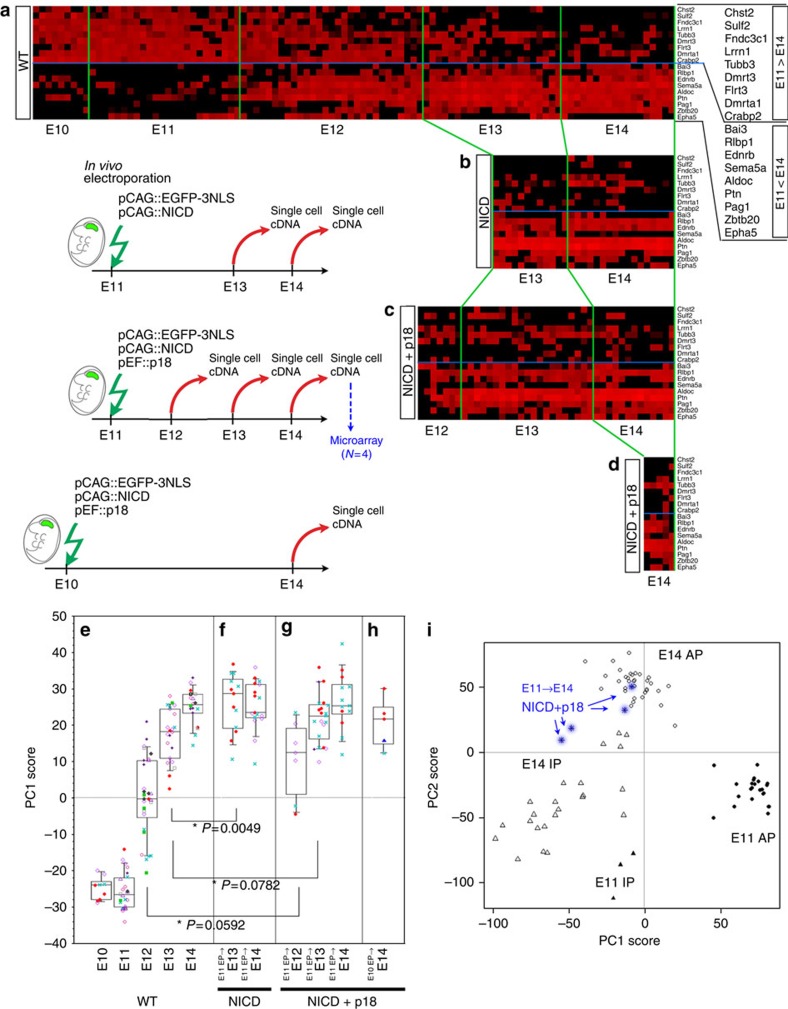
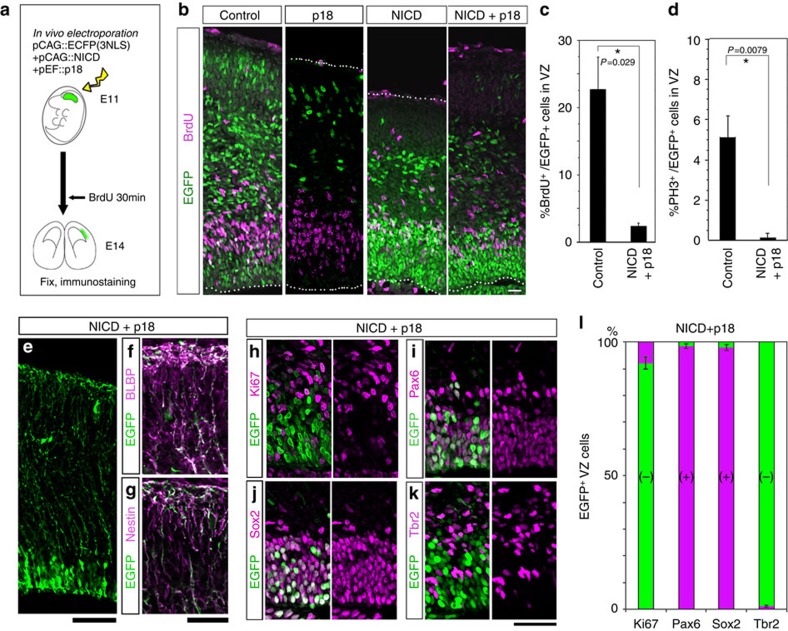
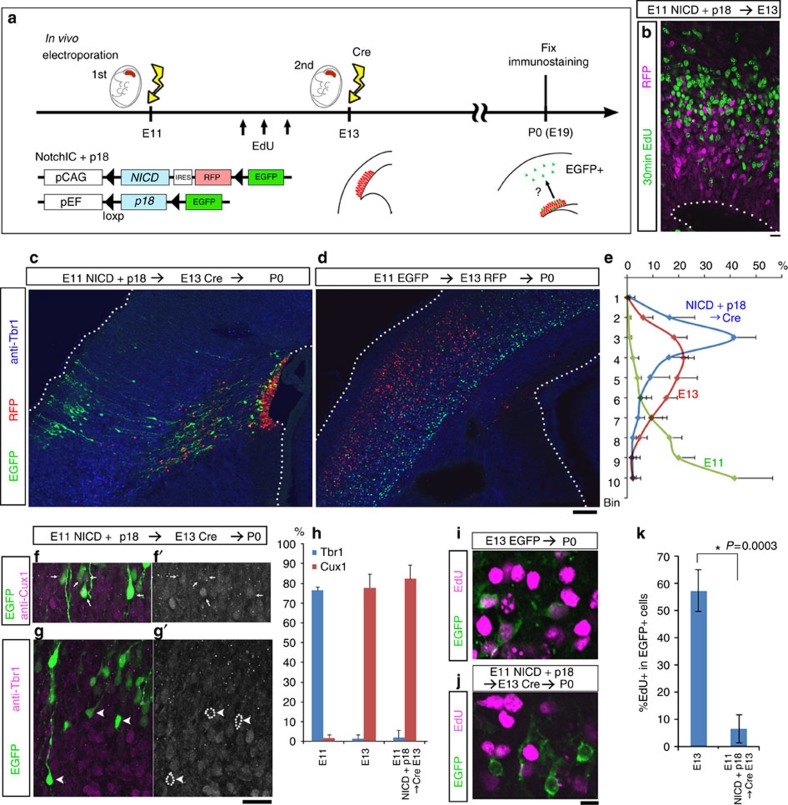
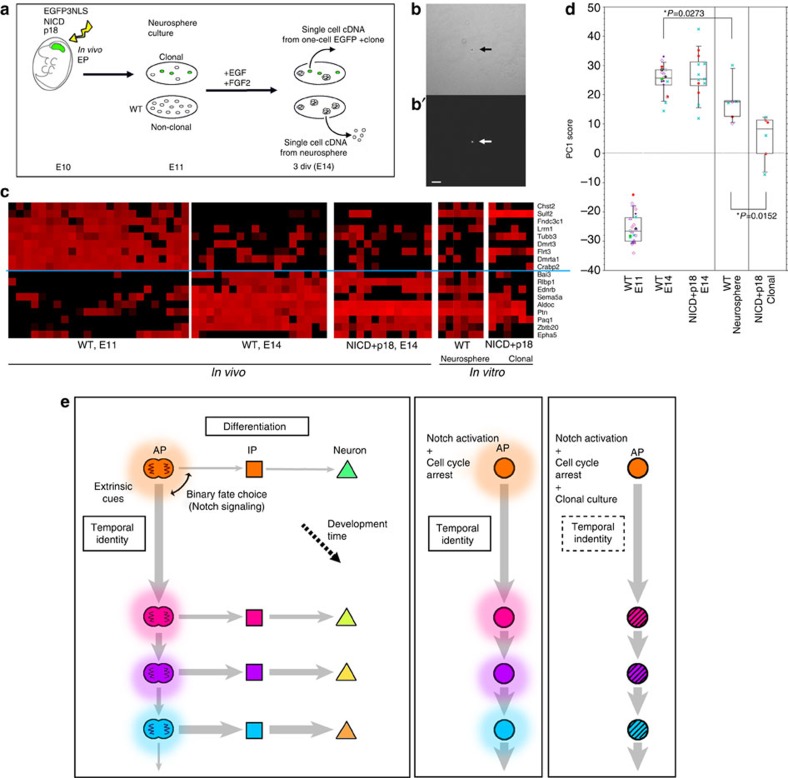
During cerebral development, many types of neurons are sequentially generated by self-renewing progenitor cells called apical progenitors (APs). Temporal changes in AP identity are thought to be responsible for neuronal diversity; however, the mechanisms underlying such changes remain largely unknown. Here we perform single-cell transcriptome analysis of individual progenitors at different developmental stages, and identify a subset of genes whose expression changes over time but is independent of differentiation status. Surprisingly, the pattern of changes in the expression of such temporal-axis genes in APs is unaffected by cell-cycle arrest. Consistent with this, transient cell-cycle arrest of APs in vivo does not prevent descendant neurons from acquiring their correct laminar fates. Analysis of cultured APs reveals that transitions in AP gene expression are driven by both cell-intrinsic and -extrinsic mechanisms. These results suggest that the timing mechanisms controlling AP temporal identity function independently of cell-cycle progression and Notch activation mode.


Figures

Figure 1
Figure 1. Classification of cortical progenitor cells.
(a) Scheme of mammalian cerebral development. Before onset of neurogenesis, APs (apical progenitor cells, neuroepithelial cells (NEs) at this stage) undergo proliferative symmetric division. After onset of neurogenesis, APs overtime undergo temporal progression with respect to two properties: division mode (proliferative versus neurogenic) and the fates of their differentiating progeny (deep-layer neurons versus upper-layer neurons). A, anterior; P, posterior; D, dorsal; V, ventral; IP, intermediate progenitor cell. (be) E14-based hierarchical clustering analysis of single-cell cDNA classifies E11- and E16-derived cortical progenitor cells. Clustering dendrograms show the results from the SigABC genes. In the dendrograms, each label represents a single cell, and the label colour indicates the cluster where it belongs. The values in red at the branches are AU (approximately unbiased) P values (%). The horizontal branch length represents the degree of dissimilarity in gene expression among the samples. See also Supplementary Figs 1–4.
Figure 2
Figure 2. Temporal change in gene expression in APs.
(a) Two-way cluster analysis of genes differentially expressed among E11, E14 and E16 single-cell cDNAs of the APs (384 probe sets, Supplementary Data 1, selected by one-way ANOVA). Examples of genes that exhibited typical expression patterns in E11, E14 and E16 cerebrum are shown in b or Supplementary Figs 5 and 6. The ‘medial>lateral' genes exhibited an ‘E11>E14' trend, and the ‘medial<lateral' genes exhibited an ‘E11<E14' trend (Supplementary Fig. 7). Scale Bar, 100 μm (c) Global gene-expression patterns of E11 APs are very different from those of E14/E16 APs. PCA was performed on microarray data from single-cell cDNAs of all APs (total N=73: mixture of E11, N=23; E14, N=33; E16, N=17 single cells; 17192 probe sets). Each symbol indicates one cell. PC1, the most representative axis for the gene-expression variation among the AP population, is determined by the difference between E11 and E14/E16 cells. The lists below indicate the top 10 genes that positively or negatively influence PC1. Proportion of variance: 0.0436 (PC1) and 0.0319 (PC2). See also Supplementary Figs 5–9 and Supplementary Data 1.
Figure 3
Figure 3. Expression change in an individual gene can be described by the temporal and differentiation axes.
(a) PCA was performed using microarray data from single-cell cDNAs of E11 and E14 progenitor (AP+IP) cells (E11, N=23; E14, N=56; 17,192 probe sets). Each symbol represents one cell. Plots for individual cells, categorized into one of four groups (E11 APs, E11 IPs, E14 APs and E14 IPs), are almost completely separated in a two-dimensional PCA graph. To make the new Y axis the temporal axis, graph a was rotated such that the median new X values of E11 APs and E14 APs were equal (θ≈43.35°) (graph b). (b) Distribution of four progenitor groups and vectors of the 30 genes with the largest vectors showed that the new X axis primarily reflects differences between APs and IPs, and thus represents the differentiation axis. (ce) Temporal-axis genes. The top 10 genes that made the largest positive or negative contributions to the temporal axis were selected and shown as a vector (c) or in tables (d,e). These genes roughly overlapped with the main PC1 genes from PCA of E11, E14, and E16 APs (Fig. 2c). Log fold-change values of expression levels showed that these genes exhibited an E11-low/E14-high pattern (or vice versa) in both APs and IPs.
Figure 4
Figure 4. Neither Notch activation nor cell-cycle arrest stops the temporal change in gene expression of APs.
(ad) Expression levels of 18 temporal-axis genes in single APs examined by qPCR. [40-Ct] values after normalization by Gapdh range from high (red) to low (undetectable) (black) in these heat maps. One column indicates a single AP. (a) Single-cell cDNAs from E10–14 wild-type APs. (bd) NICD (b), or NICD and p18 (c) were overexpressed along with EGFP at E11; the genes were introduced by in vivo electroporation. After 1 day (E12), 2 days (E13) or 3 days (E14), single-cell cDNAs were generated from EGFP+ cells. APs were selected as Ttyh1+/Tbr2. (d) NICD and p18 were overexpressed along with EGFP at E10; the genes were introduced by in vivo electroporation. After 4 days (E14), single-cell cDNAs were generated from EGFP+ cells. APs were selected as Ttyh1+/Tbr2. (e) PC1 scores of single APs calculated from the expression levels of 18 temporal-axis genes. PCA was performed on normalized [40-Ct] values of 18 genes in a mixture of E10–E14 APs (N=102), and the PC1 scores of single APs were plotted at each developmental stage. One dot indicates one AP, and cells from the same embryos are indicated by the use of the same symbols in each stage. See also Supplementary Fig. 10. (fh) PC1 scores of NICD-expressing (f), or NICD/p18 co-expressing APs (g,h) were calculated using Component 1 obtained from PCA on wild-type APs (e). (i) PCA was performed using the microarray data from single-cell cDNAs from NICD/p18-overexpressing cells (E11 electroporation, E14 sampling, N=4, blue) and E11 and E14 progenitor cells (APs+IPs, N=79; 17,192 probe sets). Each symbol represents one cell. The two plots for the NICD/p18 cells are located among the plots for the E14 APs. The other two plots for the NICD/p18 cells are located near the plot for the E14 IPs, which may reflect the effect of p18 on differentiation (Fig. 5b). See also Supplementary Fig. 13.
Figure 5
Figure 5. Co-electroporation of Cdk inhibitor p18 and NICD inhibit cell-cycle progression of progenitors while maintaining them in an undifferentiated state.
(a) Experimental design. pCAG::EGFP-3NLS alone (control), or with pCAG::NICD, or with both pCAG::NICD and pEF::p18 was electroporated into E11 cerebral wall in vivo. At E14, BrdU was administered for 30 min, and brains were fixed and stained with antibodies to EGFP, BrdU (b,c), PH3 (d), BLBP (f), Nestin (g), Ki67 (h), Pax6 (i), Sox2 (j) or Tbr2 (k). (c,d) Frequency of BrdU+ cells (c) or PH3+ cells (d) in the EGFP+VZ cells was significantly reduced relative to the control by NICD/p18 co-overexpression (c, N=4 for each case; d, N=5 for each case; Mann–Whitney U test, means±s.d.). The characterization of the EGFP+ cells in the IZ/SVZ and CP is presented in Supplementary Fig. 11. (eg) NICD/p18 co-expressing cells have radially elongated fibres that are positive for BLBP and Nestin. pCAG::EGFP, pCAG::NICD and pEF::p18 were co-electroporated on E11, and the brains were examined at E14. (hl) Most of the NICD/p18 co-expressing cells in the VZ are negative for Ki67 and Tbr2 and positive for Pax6 and Sox2. Bars, 20 μm in (b), 60 μm in (e), 30 μm in (f,g), 40 μm in (hk).
Figure 6
Figure 6. Laminar fate of progenitor cells is not altered by transient cell-cycle arrest.
(a) Experimental design of double in vivo electroporation study. (c) RFP+ cells did not label with EdU administered 30 min before sacrifice at E13. Bar, 10 μm. (c,d) Immunostaining with antibody to Tbr1 (blue) of sections from E11 NICD+p18/E13 Cre double-electroporated P0 brain (c) or control E11 EGFP-3NLS/ E13 RFP-3NLS double-electroporated P0 brain (d). Scale bar, 100 μm. (e) Distribution of the electroporated cells in the CP (cortical plate). CP was separated into 10 bins, and Bin1 represents the most exterior portion of the CP. Data show means±s.d. from N=6 embryos for each experimental condition. (f,g) Cux1 (f, f′) or Tbr1 (g, g′) immunoreactivity in E11 NICD/p18 and E13 Cre double-electroporated P0 brain. Arrows (f, f′) indicate EGFP+/Cux1+ cells, and arrowheads (g, g′) indicate EGFP+/Tbr1 cells in the CP. (h) Frequency of Cux1+ or Tbr1+ cells in electroporated cells in the CP. Data show means±s.d. from N=4, 5, 4 (Cux1 data) and 4, 4, 6 (Tbr1 data) embryos for E11, E13, NICD/p18/Cre, respectively. (ik) EdU was administrated three times at 4-hr intervals at E12, and labelling index was examined at P0 CP. Many EGFP+ CP cells that had been electroporated with pCAG::EGFP-3NLS at E13 incorporated EdU (i), whereas E11 NICD/p18 and E13 Cre double-electroporated CP cells exhibited no significant incorporation (j). Data show means±s.d. *P=0.0003, N=7 and 8 embryos, Mann–Whitney U test. See also Supplementary Fig. 14.
Figure 7
Figure 7. Temporal change of gene expression in APs is partly cell autonomous.
(a) Experimental design. (b) Single EGFP+ cell (arrow) formed one-cell clone at 3 div in clonal culture. b, Bright field; b′, EGFP fluorescence. Scale bar, 50 μm. (c) Expression levels of 18 temporal-axis genes in single APs examined by qPCR. Levels range from high (red) to low/undetectable (black) in these heat maps. Each column indicates a single AP (N=24, wild-type E11 APs; N=18, wild-type E14 APs; N=13, E14 APs electroporated with NICD/p18 at E11 (identical to the data shown in Fig. 4); N=6, APs from neurospheres; N=6, NICD+p18 co-expressing APs from one-cell clones. NICD+p18 co-expressing APs from one-cell clones were Egfp+/Ttyh1+/Sox2+/Hes5+/Tbr2/Ki67, as determined by qPCR. (d) PC1 scores of wild-type APs at E11 and E14, NICD/p18 co-expressing APs at E14 (identical to the data shown in Fig. 4), APs from neurospheres, and NICD+p18 co-expressing APs from one-cell clones, which were calculated using Component 1 obtained from PCA of wild-type APs (Fig. 4e). Note that the PC1 scores for the neurosphere-derived APs differ significantly from those for the wild-type E14 APs (P=0.0273, Mann–Whitney U test). See also Supplementary Fig. 16, which shows the characterization of the microarray data from the single neurosphere-derived APs. (e) Temporal patterns of cortical progenitor cells (model). Transition of temporal identity of APs, which occurs gradually over the course of development, cannot be stopped by constitutive Notch activation or cell-cycle arrest in vivo. This transition of temporal identity includes both the transition in division patterns and transition in laminar fate potential of APs. Clonal culture of cell-cycle-arrested APs partly impairs transition of temporal gene expression, suggesting that the transition in temporal identity is regulated by both cell-autonomous and non-cell-autonomous mechanisms.

Similar articles

Cited by

References

    1. Okano H. & Temple S. Cell types to order: temporal specification of CNS stem cells. Curr. Opin. Neurobiol. 19, 112–119 (2009). - PubMed
    1. Takahashi T., Nowakowski R. S. & Caviness V. S. The leaving or Q fraction of the murine cerebral proliferative epithelium: a general model of neocortical neuronogenesis. J. Neurosci. 16, 6183–6196 (1996). - PMC - PubMed
    1. Smart I. H. Proliferative characteristics of the ependymal layer during the early development of the mouse neocortex: a pilot study based on recording the number, location and plane of cleavage of mitotic figures. J. Anat. 116, 67–91 (1973). - PMC - PubMed
    1. Noctor S. C., Martínez-Cerdeño V., Ivic L. & Kriegstein A. R. Cortical neurons arise in symmetric and asymmetric division zones and migrate through specific phases. Nat. Neurosci. 7, 136–144 (2004). - PubMed
    1. Molyneaux B. J., Arlotta P., Menezes J. R. & Macklis J. D. Neuronal subtype specification in the cerebral cortex. Nat. Rev. Neurosci. 8, 427–437 (2007). - PubMed

Publication types

MeSH terms