Linkage of E2F1 transcriptional network and cell proliferation with respiratory chain activity in breast cancer cells
- PMID: 27094710
- PMCID: PMC4946721
- DOI: 10.1111/cas.12953
Linkage of E2F1 transcriptional network and cell proliferation with respiratory chain activity in breast cancer cells
Abstract
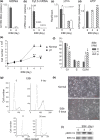
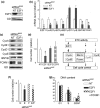
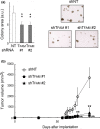
Mitochondria are multifunctional organelles; they have been implicated in various aspects of tumorigenesis. In this study, we investigated a novel role of the basal electron transport chain (ETC) activity in cell proliferation by inhibiting mitochondrial replication and transcription (mtR/T) using pharmacological and genetic interventions, which depleted mitochondrial DNA/RNA, thereby inducing ETC deficiency. Interestingly, mtR/T inhibition did not decrease ATP levels despite deficiency in ETC activity in different cell types, including MDA-MB-231 breast cancer cells, but it severely impeded cell cycle progression, specifically progression during G2 and/or M phases in the cancer cells. Under these conditions, the expression of a group of cell cycle regulators was downregulated without affecting the growth signaling pathway. Further analysis suggested that the transcriptional network organized by E2F1 was significantly affected because of the downregulation of E2F1 in response to ETC deficiency, which eventually resulted in the suppression of cell proliferation. Thus, in this study, the E2F1-mediated ETC-dependent mechanism has emerged as the regulatory mechanism of cell cycle progression. In addition to E2F1, FOXM1 and BMYB were also downregulated, which contributed specifically to the defects in G2 and/or M phase progression. Thus, ETC-deficient cancer cells lost their growing ability, including their tumorigenic potential in vivo. ETC deficiency abolished the production of reactive oxygen species (ROS) from the mitochondria and a mitochondria-targeted antioxidant mimicked the deficiency, thereby suggesting that ETC activity signaled through ROS production. In conclusion, this novel coupling between ETC activity and cell cycle progression may be an important mechanism for coordinating cell proliferation and metabolism.
Keywords: Breast neoplasm; E2F1 transcription factor; cell cycle; electron transport; reactive oxygen species.
© 2016 The Authors. Cancer Science published by John Wiley & Sons Australia, Ltd on behalf of Japanese Cancer Association.
Figures


Similar articles
-
FoxM1 down-regulation leads to inhibition of proliferation, migration and invasion of breast cancer cells through the modulation of extra-cellular matrix degrading factors.Breast Cancer Res Treat. 2010 Jul;122(2):337-46. doi: 10.1007/s10549-009-0572-1. Epub 2009 Oct 8. Breast Cancer Res Treat. 2010. Retraction in: Breast Cancer Res Treat. 2016 Aug;158(3):607. doi: 10.1007/s10549-016-3904-y. PMID: 19813088 Retracted.
-
CDCA5 accelerates progression of breast cancer by promoting the binding of E2F1 and FOXM1.J Transl Med. 2024 Jul 8;22(1):639. doi: 10.1186/s12967-024-05443-w. J Transl Med. 2024. PMID: 38978058 Free PMC article.
-
Co-inhibition of ATM and ROCK synergistically improves cell proliferation in replicative senescence by activating FOXM1 and E2F1.Commun Biol. 2022 Jul 14;5(1):702. doi: 10.1038/s42003-022-03658-5. Commun Biol. 2022. PMID: 35835838 Free PMC article.
-
Central spindle proteins and mitotic kinesins are direct transcriptional targets of MuvB, B-MYB and FOXM1 in breast cancer cell lines and are potential targets for therapy.Oncotarget. 2017 Feb 14;8(7):11160-11172. doi: 10.18632/oncotarget.14466. Oncotarget. 2017. PMID: 28061449 Free PMC article.
-
The bidirectional relationship between metabolism and cell cycle control.Trends Cell Biol. 2024 Feb;34(2):136-149. doi: 10.1016/j.tcb.2023.05.012. Epub 2023 Jun 27. Trends Cell Biol. 2024. PMID: 37385879 Review.
Cited by
-
Bioinformatics identification of CCL8/21 as potential prognostic biomarkers in breast cancer microenvironment.Biosci Rep. 2020 Nov 27;40(11):BSR20202042. doi: 10.1042/BSR20202042. Biosci Rep. 2020. PMID: 33146700 Free PMC article.
-
A mitochondrial ROS pathway controls matrix metalloproteinase 9 levels and invasive properties in RAS-activated cancer cells.FEBS J. 2019 Feb;286(3):459-478. doi: 10.1111/febs.14671. Epub 2018 Oct 13. FEBS J. 2019. PMID: 30281903 Free PMC article.
-
HMGA2 drives the IGFBP1/AKT pathway to counteract the increase in P27KIP1 protein levels in mtDNA/RNA-less cancer cells.Cancer Sci. 2023 Jan;114(1):152-163. doi: 10.1111/cas.15582. Epub 2022 Sep 26. Cancer Sci. 2023. PMID: 36102493 Free PMC article.
-
E2F7-EZH2 axis regulates PTEN/AKT/mTOR signalling and glioblastoma progression.Br J Cancer. 2020 Oct;123(9):1445-1455. doi: 10.1038/s41416-020-01032-y. Epub 2020 Aug 20. Br J Cancer. 2020. PMID: 32814835 Free PMC article.
-
The multifaceted role of cell cycle regulators in the coordination of growth and metabolism.FEBS J. 2021 Jun;288(12):3813-3833. doi: 10.1111/febs.15586. Epub 2020 Oct 25. FEBS J. 2021. PMID: 33030287 Free PMC article. Review.
References
-
- DeBerardinis RJ, Lum JJ, Hatzivassiliou G, Thompson CB. The biology of cancer: metabolic reprogramming fuels cell growth and proliferation. Cell Metab 2008; 7: 11–20. - PubMed
-
- Frezza C, Gottlieb E. Mitochondria in cancer: not just innocent bystanders. Semin Cancer Biol 2009; 19: 4–11. - PubMed
-
- Moreno‐Sanchez R, Marin‐Hernandez A, Saavedra E, Pardo JP, Ralph SJ, Rodriguez‐Enriquez S. Who controls the ATP supply in cancer cells? Biochemistry lessons to understand cancer energy metabolism. Int J Biochem Cell Biol 2014; 50: 10–23. - PubMed
MeSH terms
Substances
LinkOut - more resources
Full Text Sources
Other Literature Sources
Medical
Miscellaneous

