. 2016 Apr 20:7:11371.
doi: 10.1038/ncomms11371.

Hypoxia regulates global membrane protein endocytosis through caveolin-1 in cancer cells

Affiliations

Hypoxia regulates global membrane protein endocytosis through caveolin-1 in cancer cells

E Bourseau-Guilmain et al. Nat Commun. .

Abstract

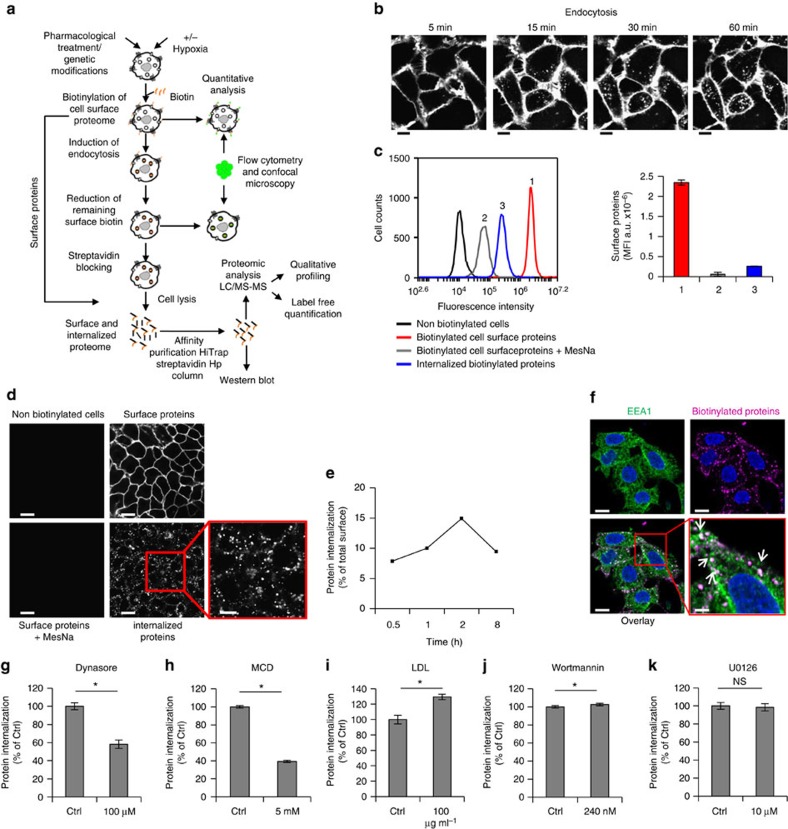
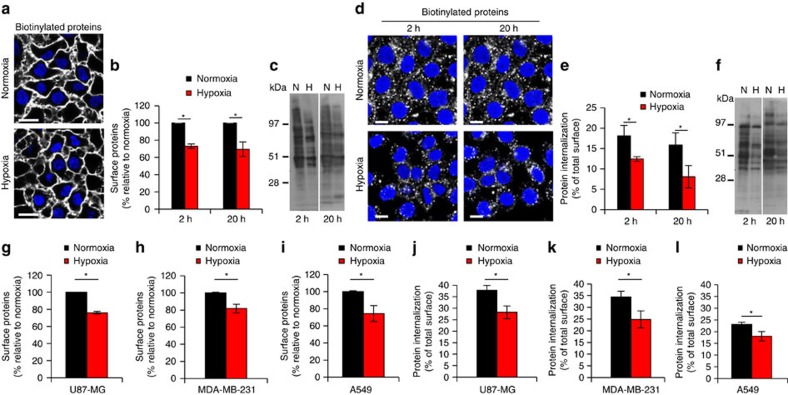
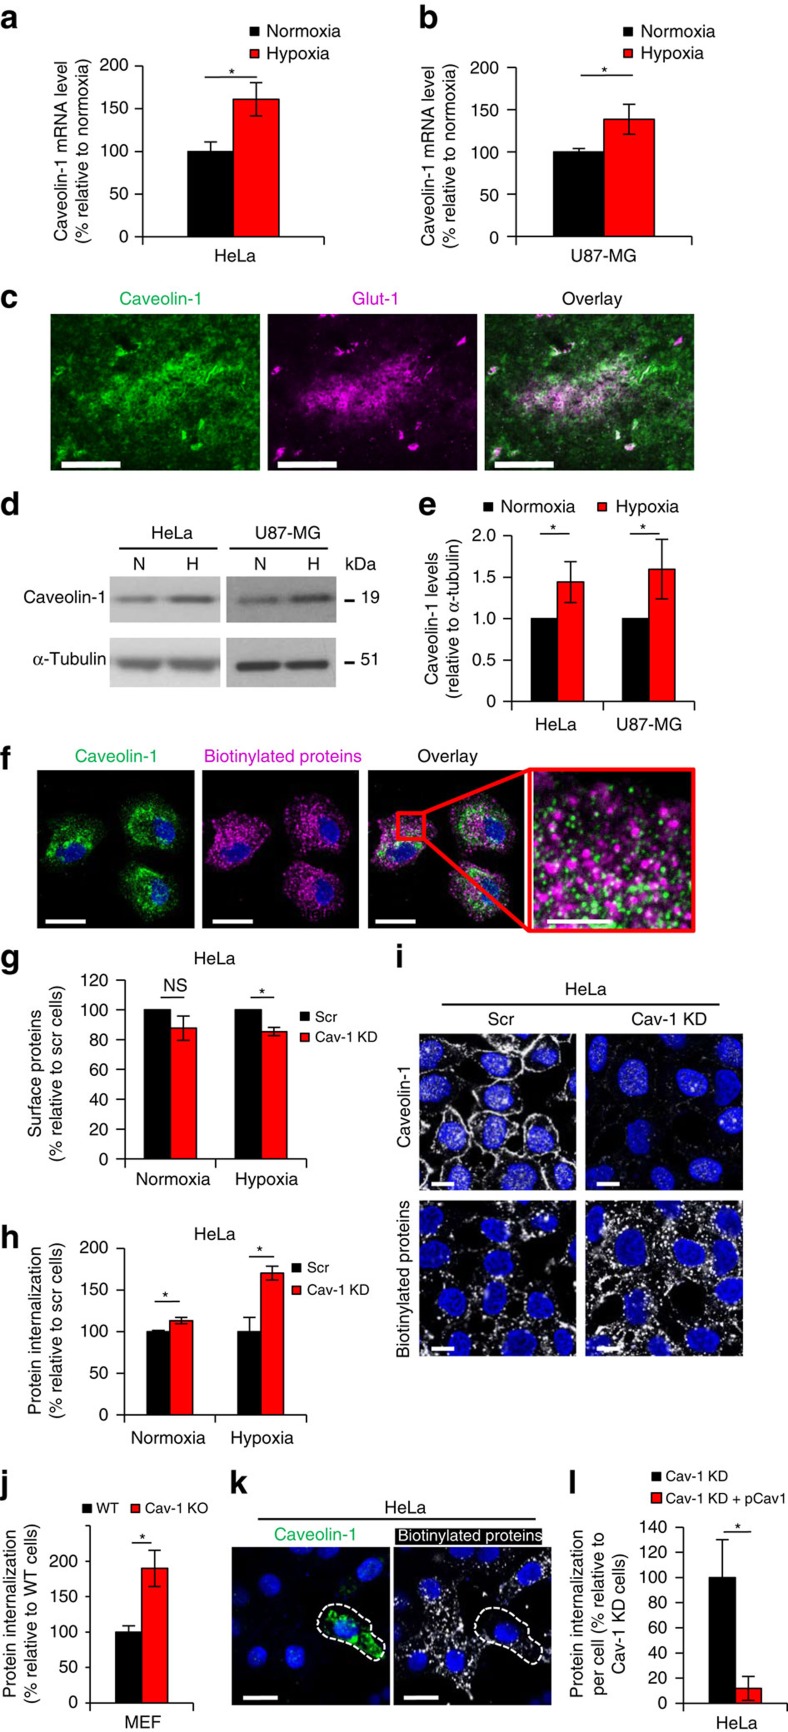
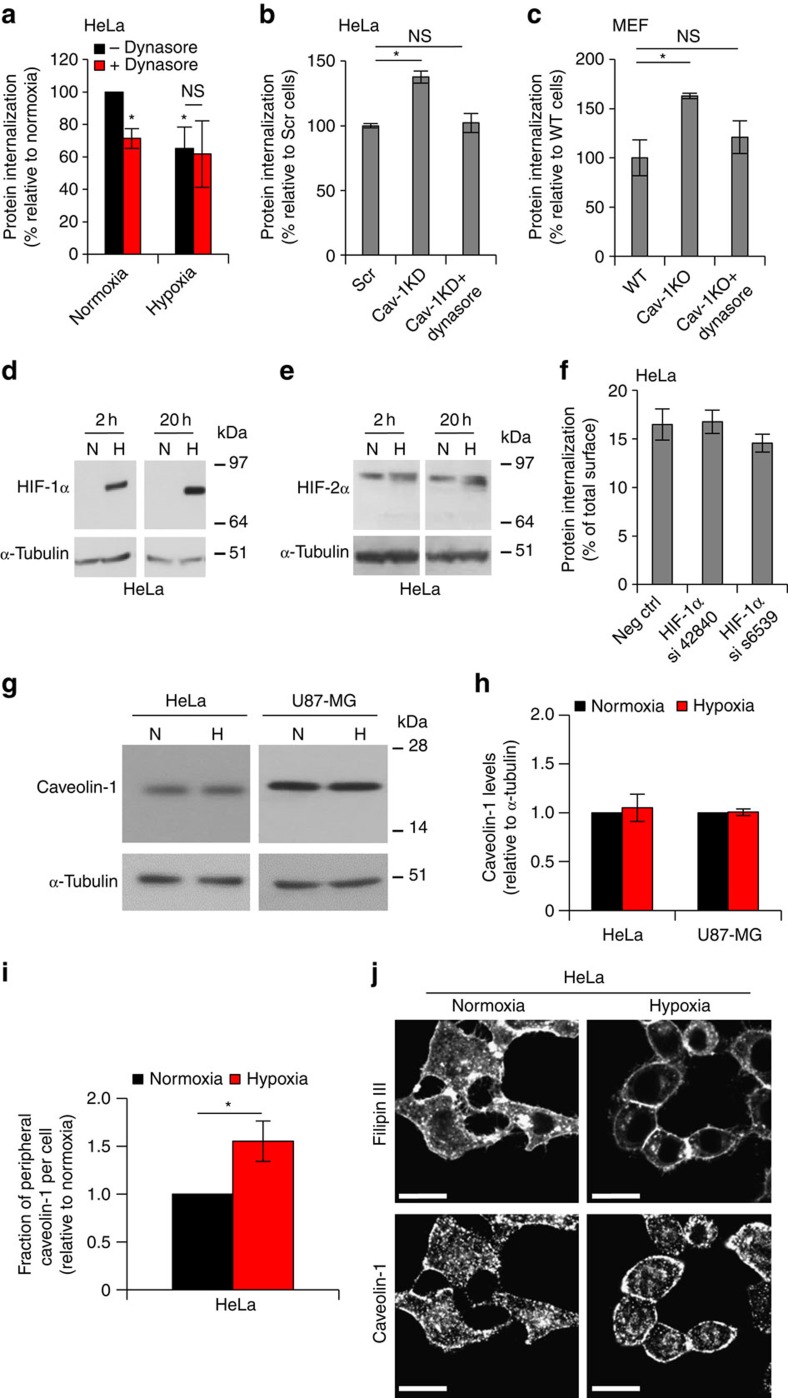
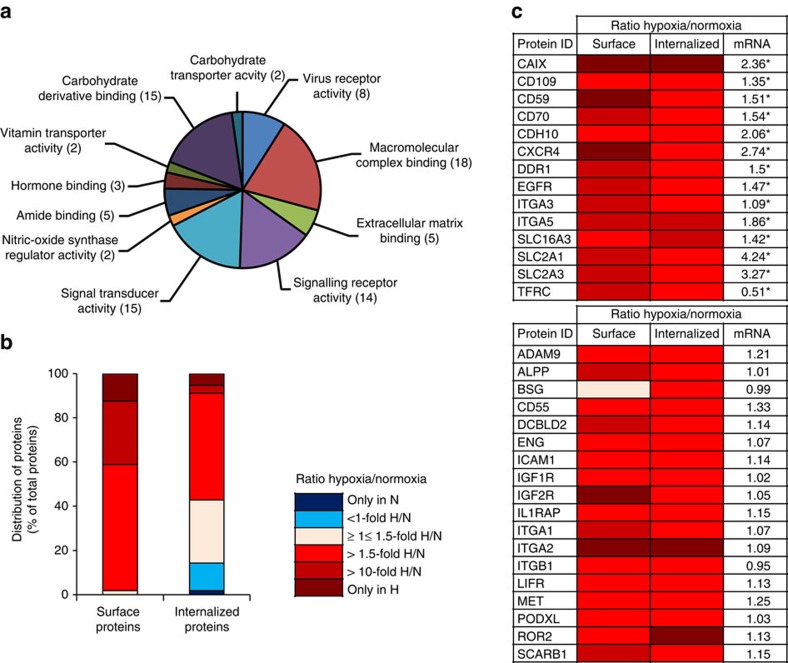
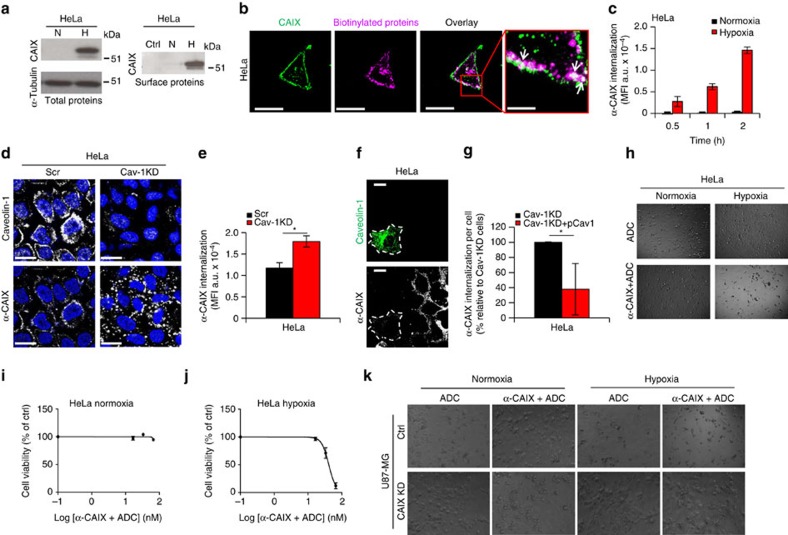
Hypoxia promotes tumour aggressiveness and resistance of cancers to oncological treatment. The identification of cancer cell internalizing antigens for drug targeting to the hypoxic tumour niche remains a challenge of high clinical relevance. Here we show that hypoxia down-regulates the surface proteome at the global level and, more specifically, membrane proteome internalization. We find that hypoxic down-regulation of constitutive endocytosis is HIF-independent, and involves caveolin-1-mediated inhibition of dynamin-dependent, membrane raft endocytosis. Caveolin-1 overexpression inhibits protein internalization, suggesting a general negative regulatory role of caveolin-1 in endocytosis. In contrast to this global inhibitory effect, we identify several proteins that can override caveolin-1 negative regulation, exhibiting increased internalization at hypoxia. We demonstrate antibody-mediated cytotoxin delivery and killing specifically of hypoxic cells through one of these proteins, carbonic anhydrase IX. Our data reveal that caveolin-1 modulates cell-surface proteome turnover at hypoxia with potential implications for specific targeting of the hypoxic tumour microenvironment.


Figures

Figure 1
Figure 1. Dynamics of constitutive membrane protein endocytosis.
(a) Schematic outline of procedures for the quantification and encoding of cell-surface proteome endocytosis, as described in Methods. (b) Representative confocal microscopy images of cell-surface and internalized biotinylated proteins in HeLa cells at the indicated time points (see also, Supplementary Movie 1). Scale bar, 20 μm. (c) FACS quantification of biotinylated cell-surface, and endocytosed membrane proteome in HeLa cells following 30 min of internalization; left panel: representative histograms of non-biotinylated cells, total cell-surface biotinylation, residual cell-surface signal following reductive cleavage of biotin-protein linker with MesNa and internalized membrane proteins; right panel: quantitative analysis presented as the mean±s.d. from three independent experiments each performed in duplicates. MFI, median fluorescence intensity. (d) Representative confocal microscopy images of HeLa cells from experiment described in (c). Scale bar, 20 μm; lower right panel, 10 μm. (e) Time-dependent internalization in HeLa cells of cell-surface proteome presented as % of total cell-surface biotinylation at t=0, that is, without induction of endocytosis. (f) Confocal microscopy imaging of biotinylated proteins (magenta) and the early endosome marker EEA1 (green) in HeLa cells shows co-localization following 30 min of endocytosis. Arrows in lower right panel indicate co-localization. Shown are representative images from at least 3 independent experiments. Scale bar, 10 μm; lower right panel, 3.5 μm. (g–k) FACS quantification of constitutive biotinylated membrane protein endocytosis at 30 min following pre-treatment of HeLa cells with (g) dynamin inhibitor Dynasore for 30 min, (h) membrane cholesterol depletion agent methyl-β-cyclodextrin (MCD) for 30 min, (i) low-density lipoprotein cholesterol loading for 20 h, (j) macropinocytosis inhibitor wortmannin for 1 h and (k) ERK1/2 phosphorylation inhibitor UO126 for 1 h at the indicated concentrations. Data are presented as % of untreated control cells (Ctrl)±s.d. from a representative experiment. NS, not significant. *P<0.05 (Student's t-test).
Figure 2
Figure 2. Hypoxia down-regulates global membrane protein endocytosis.
(a) HeLa cells were pre-treated at normoxia or hypoxia (1% O2) for 20 h, followed by cell-surface biotinylation, staining with streptavidin-AF-488 and visualization by confocal microscopy. Scale bar, 20 μm. (b) FACS quantification of biotinylated cell-surface proteome in HeLa cells shows inhibition by hypoxic treatment for the indicated time periods. (c) Immunoblotting for biotinylated cell-surface proteins from a similar experiment as described in (b) shows down-regulation by hypoxia. (d) Confocal microscopy imaging of endocytosed, biotinylated membrane proteins following 30 min of internalization and cell-surface biotinylation depletion in HeLa cells shows inhibition by hypoxic treatment for the indicated time periods. Scale bar, 10 μm. (e) FACS quantification of the endocytosed membrane proteome from a similar experiment as described in (d) shows down-regulation by hypoxia. (f) Immunoblotting for endocytosed proteins from a similar experiment as described in (d) shows inhibition by hypoxia. (g–l) FACS quantification of biotinylated cell-surface proteome (gi) and endocytosed membrane proteome (jl) following 30 min of internalization performed with the indicated cell types (A549, lung adenocarcinoma; MDA-MB-231, breast adenocarcinoma; U87-MG, glioblastoma) treated at normoxia or hypoxia for 20 h. Data are presented as % relative to normoxic cells (in b and g–i) or as % of total cell-surface biotinylation at normoxia and hypoxia, respectively, at t=0 (in e, and j–l)±s.d. from three independent experiments. *P<0.05 (Student's t-test).
Figure 3
Figure 3. Caveolin-1 regulates constitutive membrane protein endocytosis in hypoxic cells.
Caveolin-1 mRNA levels in HeLa (a) and U87-MG (b) cells at hypoxia or normoxia presented as % relative to normoxia±s.d. (n=3). (c) Immunofluorescence staining of a human glioblastoma tumour shows increased caveolin-1 in Glut-1-positive, hypoxic regions. Scale bar, 500 μm. (d) HeLa and U87-MG cell lysates from normoxic and hypoxic conditions were analysed for caveolin-1 by western blotting with tubulin as loading control. (e) Quantification of caveolin-1 to tubulin ratio in hypoxic versus normoxic cells (set to 1). Data represent the average±s.d. (n=3) (f) HeLa cells were surface biotinylated, followed by endocytosis for 30 min. Cells were stained for internalized proteins (magenta) and caveolin-1 (green). The indicated area shows weak co-localization. Scale bar, 20 μm; right panel, 5 μm. (g) FACS quantification of biotinylated cell-surface proteome in caveolin-1 knockdown (Cav-1 KD) and control HeLa cells transduced with a scrambled shRNA sequence (Scr) at normoxic and hypoxic conditions. (h) FACS quantification of the endocytosed proteome at 30 min from a similar experiment as in (g). Data are presented as % relative to Scr cells±s.d. (n=3). (i) Hypoxic Scr and Cav-1 KD HeLa cells were surface biotinylated, followed by endocytosis for 30 min. Cells were stained for internalized proteins and caveolin-1. Scale bar, 10 μm. (j) FACS quantification of the endocytosed proteome at 30 min in hypoxic WT and caveolin-1 knockout (Cav-1 KO) MEF cells. Data are presented as % relative to WT cells±s.d. (n=3). (k) Hypoxic Cav-1 KD cells transiently transfected with caveolin-1-expressing plasmid (pCav-1) were surface biotinylated followed by 30 min of endocytosis. Cells were stained for internalized proteins and caveolin-1, showing decreased internalization in caveolin-1 overexpressing cells (white dashed line). Scale bar, 20 μm. (l) Quantitative results from experiment described in (k) using Cell Profiler. Data are presented as % relative to nontransfected Cav-1 KD cells±s.d. from six representative areas (n=3). (c,f,i): Representative images from three independent experiments. *P<0.05 (Student's t-test).
Figure 4
Figure 4. Caveolin-1 regulates dynamin-dependent endocytosis and is distributed to the cell periphery in hypoxia.
(a) Dynamin inhibition mimics hypoxia. FACS quantification of constitutive biotinylated membrane protein endocytosis at 30 min in normoxic and hypoxic HeLa cells following no treatment (–Dynasore) or pre-treatment with dynamin inhibitor Dynasore (+Dynasore) for 30 min. (b) FACS quantification of the endocytosed proteome in hypoxic control (Scr) and caveolin-1 knockdown (Cav-1 KD) HeLa cells with and without Dynasore pre-treatment shows that dynamin inhibition reverses the effect of caveolin-1 deficiency. (c) Similar experiment as in (b) with WT and caveolin-1 knockout (Cav-1 KO) MEF cells. (a–c) Data are presented as % relative to respective controls±s.d. (n=3). *P<0.05 (Student's t-test). (d) HIF-1α and (e) HIF-2α in HeLa cell lysates from normoxic and hypoxic conditions at the indicated time points were analysed by western blotting with tubulin as loading control. (f) FACS quantification of the endocytosed proteome at 2 h of hypoxia in HIF-1α KD (using two different HIF-1α siRNA sequences, as indicated) and control HeLa cells transfected with a scrambled siRNA sequence (Neg Ctrl) shows no significant effect of HIF-1α. Data are presented as % of total cell-surface biotinylation±s.d. (n=3). (g) HeLa and U87-MG cell lysates from normoxic and hypoxic conditions (2 h) were analysed for caveolin-1 by western blotting with tubulin as loading control. (h) Quantification of caveolin-1 to tubulin ratio in hypoxic versus normoxic cells (set to 1). Data represent the average±s.d. from three independent experiments. *P<0.05 (Student's t-test). (i) Normoxic and hypoxic (2 h) cells were stained for caveolin-1, and filipin as a cell membrane counter-stain. Cell per cell analysis of peripheral, plasma membrane associated caveolin-1 as a fraction of total caveolin-1 was performed using Image J. Data are presented as the fraction of peripheral caveolin-1 per cell in random fields (n=51 per condition) in hypoxia relative to normoxia (set to 1) from three independent experiments. *P<0.05 (Student's t-test). (j) Shown are representative images of the experiment quantified in (i). Scale bar, 20 μm.
Figure 5
Figure 5. Encoding of hypoxia-induced internalizing surface proteins.
(a) HeLa cells were pre-treated at normoxia or hypoxia for 20 h. Total surface proteins and internalized proteins, following 2 h of endocytosis, were isolated by streptavidin affinity chromatography and identified by LC–MS/MS analysis. Candidate proteins of interest were selected for label-free MS1 quantification using the Skyline software. MS1 full scan filtering and quantification of peptides identified hypoxia-induced surface proteins (n=55) classified into the indicated groups. Data were obtained using the ConsensusPathDB interaction database. (b) Quantitative data of candidate proteins at the surface and following internalization. Shown is the distribution of proteins (% of total candidate proteins) according to fold change of protein expression in hypoxic versus normoxic HeLa cells (see also, Supplementary Data 1, 2, 3 and Supplementary Table 1). (c) Colour map of relative ratios of 32 candidate proteins at hypoxic versus normoxic conditions, isolated at the cell-surface and following internalization. The upper panel shows proteins with significant, hypoxic regulation of corresponding mRNAs. Gene expression data (right column) are presented as fold increase in hypoxic versus normoxic HeLa cells from three independent experiments. *P<0.05 (Student's t-test). See Supplementary Data 3 for full protein names of abbreviations.
Figure 6
Figure 6. Hypoxia-induced CAIX overrides caveolin-1 negative regulation to allow specific cytotoxin delivery to hypoxic cells.
(a) Left panel: HeLa cells pre-treated at normoxia or hypoxia for 20 h were analysed for CAIX by immunoblotting with tubulin as loading control. Right panel: HeLa cells were pre-treated as above, followed by cell-surface protein biotinylation and visualization of biotinylated CAIX. Negative control (Ctrl) represents non-biotinylated cells. (b) HeLa cells were surface biotinylated, followed by endocytosis for 30 min. Cells were stained for internalized proteins by streptavidin-AF-546 (magenta) and CAIX (green). Right panel shows CAIX co-localization with internalized proteins. Scale bar, 20 μm; right panel, 5 μm. (c) HeLa cells were pre-treated as in (a) and analysed by FACS for anti-CAIX antibody (α-CAIX) uptake at the indicated time points. (d) Caveolin-1 knockdown (Cav-1 KD) and control HeLa cells transduced with scrambled shRNA (Scr) were cultured at hypoxia for 20 h, and α-CAIX internalization and caveolin-1 expression were analysed by confocal microscopy. Scale bar, 20 μm. (e) FACS quantification from similar experiment as in (d). (f) Hypoxic Cav-1 KD cells transiently transfected with caveolin-1-expressing plasmid (pCav-1) were analysed for α-CAIX endocytosis, showing decreased internalization in caveolin-1 overexpressing cells (white dashed line). Scale bar, 20 μm. (g) Quantitative results from experiment in (f) using Cell Profiler, expressed as % relative to nontransfected Cav-1 KD cells±s.d. from six representative areas (n=3). *P<0.05 (Student's t-test). (h) HeLa cells were pre-incubated in normoxia or hypoxia for 20 h and then treated with α-CAIX pre-complexed with toxin-conjugated IgG (ADC) or ADC alone for another 48 h in normoxia or hypoxia. (i,j) Similar experiment as in (h) showing dose–effect curve of α-CAIX+ADC complex in normoxic (i) and hypoxic (j) cells. (k) CAIX KD and Ctrl U87-MG cells were cultured at normoxia or hypoxia and treated with α-CAIX+ADC complex or ADC alone for 72 h. Data are presented as mean fluorescence intensity (MFI) (a.u.) (c,e) or as % cell viability of Ctrl (i and j)±s.d. Images shown in (b), (h) and (k), are representative of at least three independent experiments.

Similar articles

Cited by

References

    1. Harris A. L. Hypoxia—a key regulatory factor in tumour growth. Nat. Rev. Cancer 2, 38–46 (2002). - PubMed
    1. Pouysségur J., Dayan F. & Mazure N. M. Hypoxia signalling in cancer and approaches to enforce tumour regression. Nature 441, 437–443 (2006). - PubMed
    1. Finger E. C. & Giaccia A. J. Hypoxia, inflammation, and the tumor microenvironment in metastatic disease. Cancer Metastasis Rev. 29, 285–293 (2010). - PMC - PubMed
    1. Mosesson Y., Mills G. B. & Yarden Y. Derailed endocytosis: an emerging feature of cancer. Nat. Rev. Cancer 8, 835–885 (2008). - PubMed
    1. Joffre C. et al. A direct role for Met endocytosis in tumorigenesis. Nat. Cell. Biol. 13, 827–837 (2011). - PubMed

Publication types

MeSH terms