. 2016 Jun 20;44(11):e109.
doi: 10.1093/nar/gkw263. Epub 2016 Apr 19.

iGEMS: an integrated model for identification of alternative exon usage events

Affiliations

iGEMS: an integrated model for identification of alternative exon usage events

Sanjana Sood et al. Nucleic Acids Res. .

Abstract

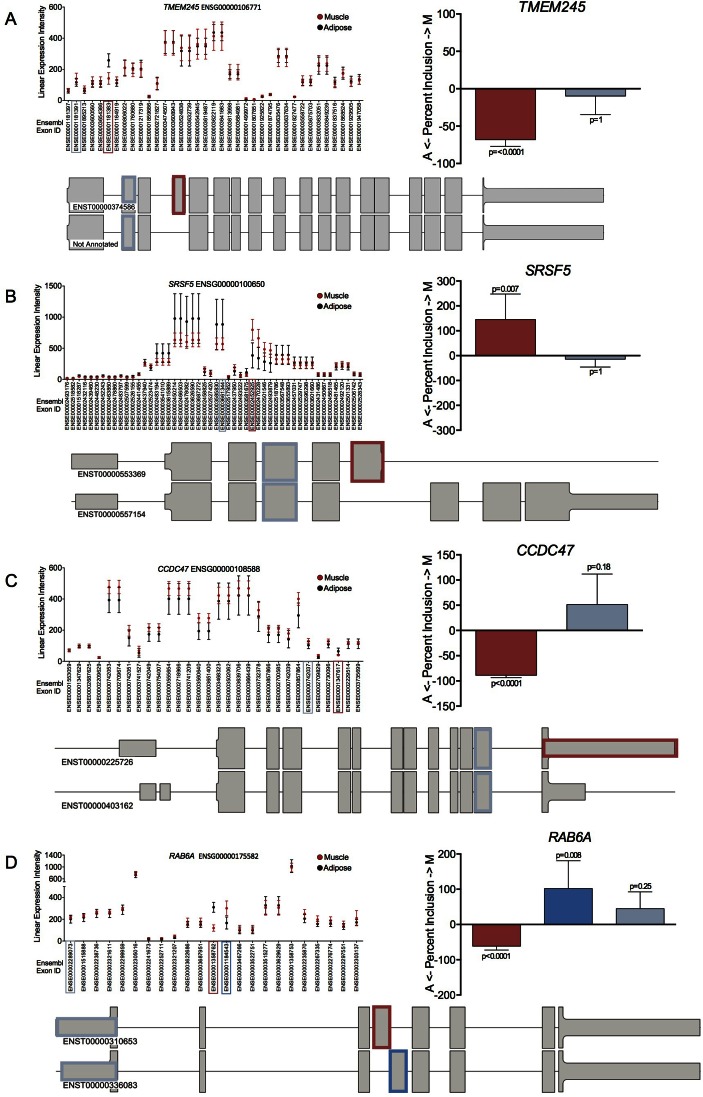
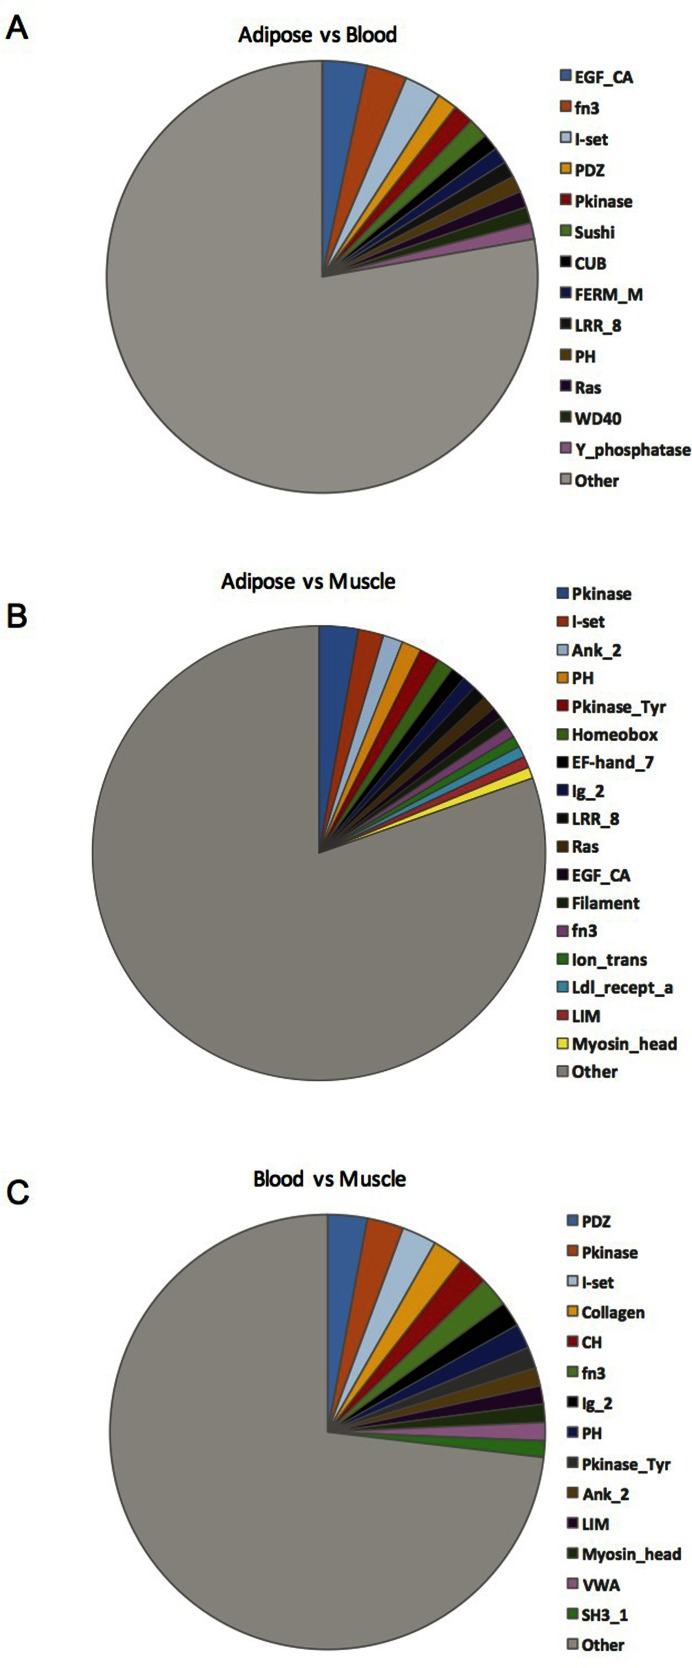
DNA microarrays and RNAseq are complementary methods for studying RNA molecules. Current computational methods to determine alternative exon usage (AEU) using such data require impractical visual inspection and still yield high false-positive rates. Integrated Gene and Exon Model of Splicing (iGEMS) adapts a gene-level residuals model with a gene size adjusted false discovery rate and exon-level analysis to circumvent these limitations. iGEMS was applied to two new DNA microarray datasets, including the high coverage Human Transcriptome Arrays 2.0 and performance was validated using RT-qPCR. First, AEU was studied in adipocytes treated with (n = 9) or without (n = 8) the anti-diabetes drug, rosiglitazone. iGEMS identified 555 genes with AEU, and robust verification by RT-qPCR (∼90%). Second, in a three-way human tissue comparison (muscle, adipose and blood, n = 41) iGEMS identified 4421 genes with at least one AEU event, with excellent RT-qPCR verification (95%, n = 22). Importantly, iGEMS identified a variety of AEU events, including 3'UTR extension, as well as exon inclusion/exclusion impacting on protein kinase and extracellular matrix domains. In conclusion, iGEMS is a robust method for identification of AEU while the variety of exon usage between human tissues is 5-10 times more prevalent than reported by the Genotype-Tissue Expression consortium using RNA sequencing.


Figures

Figure 1.
Figure 1.
Schematic diagram of iGEMS pipeline for the identification of alternative exon usage (AEU). iGEMS integrates analysis at both at the gene (blue boxes) and at the exon level (red boxes). An optional filter based on standard deviation can be applied to remove genes likely to be non-expressed which is important in scenarios where gene expression is absent in one condition. At the gene level we calculate the FDR for the adjusted Material Unaccounted For (MUF) score. Genes with significant MUF score (FDR < 1%) are analysed further (Step 1). To locate the AEU within candidate genes (i.e. genes with a significant absolute MUF score) we calculate a splicing index (SI) per exon. Genes with at least one exon with an SI value in the top or bottom decile of the SI distribution of the Step 1 filtered data are selected (Step 2). In the third iGEMS step we apply a ‘negative selection’ filter, which identifies exons as false positive AEU events if expression of the exon, in both the control and treatment groups, is lower than the median gene expression for respective conditions, and where the associated Limma based FDR indicates that the respective exons are not differentially expressed (FDR > 1%) (Step 3). This yields a modest filtering of the genes selected at steps 1 and 2 (FDR adjusted MUF scores and SI ranked list) and results in a list of genes that undergo an AEU.
Figure 2.
Figure 2.
Distribution of absolute MUF scores (step 1) and SI (step 2) in adipocytes treated with rosiglitazone and profiled using Affymetrix Mouse Exon 1.0 DNA microarrays. (A) The distribution of MUF scores (absolute) and the corresponding FDR values. The red and blue line represents the 1% and 5% FDR cut-off values respectively. Using the 1% cut-off we identified 1464 genes to have significant MUF score. (B) Shown is the distribution of SI calculated at the exon-level for all exons. Using the exons from the 1464 candidate genes (∼22 652 exons) we apply the upper and lower decile for the SI cut-off as −0.635 and 0.646 respectively. This resulted in 2266 exons (red bars) passing step 2 (Figure 1), which corresponded to 729 genes as candidates for AEU.
Figure 3.
Figure 3.
Identification of Agpat1 undergoing an AEU event in response to rosiglitazone (ROSI). (A) The MUF score is derived from the residual plot of Agpat1 (ENSMUSG00000034254). Residual values were plotted in genomic order with the composite gene structure juxtaposed below. Our analysis was performed on eight control (light blue) and nine ROSI treated cell cultures (dark blue). Blue lines connect the residual value to their respective genomic regions. Towards the 5′ end of Agpat1 there was a high deviation from the model indicating an AEU event (black arrow). (B) Expression plot of the mean expression intensity (±standard deviation (SD)) of each Ensembl exon ID assigned to Agpat1; light blue represents the control and dark blue the ROSI treated values. Ensembl Exon ID ‘ENSMUSE00000934556′ is the AEU exon (red box) and ENSMUSE00000707276 (blue box) is the constitutively expressed exon. Primers were designed to independently measure these two exons. RT-qPCR validation was carried out in independent RNA (mean ± SD; control (n = 8) and rosiglitazone (ROSI) (n = 9)) and is shown as percent (%) change from the control group with ROSI with the colour consistent with the exon ID plot on the left. CT values and adjusted P-values are shown for the control and ROSI group. (C) Schematic of the two Agpat1 variants: a full Agpat1 variant (ENSMUST00000037489, lower panel) which does not contain the AEU exon we identified, and the truncated Agpat1 (ENSMUST00000173242, higher panel) which contains the AEU exon. The highlighted exons (red and blue) represent the AEU exon and the constitutively expressed exon, respectively as measured by the array and the RT-qPCR primers. Exons part of the translated RNA is represented as a thick box than untranslated.
Figure 4.
Figure 4.
Validation of five AEU events by visual inspection and RT-qPCR. For each gene, a schematic of the transcript(s) is shown with red and blue boxes highlighting the AEU exon and constitutively expressed exon, respectively (targeted by RT-qPCR primers). Exons part of the translated RNA is represented as a thick box than untranslated. RT-qPCR data is shown as percent (%) change from the control group (n = 8) with rosiglitazone (ROSI) (n = 8) (mean ± standard deviation) with the colour consistent with the Exon ID plot above. The expression of AEU exon changed relatively more than the constitutively expressed exons, in response to ROSI treatment. (A) Pde4dip (ENSMUSG00000038170), (B) Rapgef5 (ENSMUSG00000041992), (C) Akt2 (ENSMUSG00000004056), (D) Clstn3 (ENSMUSG00000008153) and (E) Xrcc6 (ENSMUSG00000022471).
Figure 5.
Figure 5.
iGEMS identified diverse types of AEU events between muscle and adipose with RT-qPCR validation. We utilized the Affymetrix HTA 2.0 array to analyse tissue samples in a pairwise manner. Here we show four examples of different types of AEU events. Each accompanied with their respective linear expression intensities from the microarray analysis (mean ± SD). From a total of 14 pairs of twins, quality control validated paired microarray analysis was carried out on muscle (red, n = 12) and adipose (black, n = 12). RT-qPCR validation was carried out in remaining RNA (mean ± SD; muscle (n = 14) and adipose (n = 9)) and is shown as percent (%) change from adipose to muscle tissue with the colour consistent with the Exon ID plot on the left. (A) TMEM245 (ENSG00000106771) undergoes an exon exclusion event in muscle as Ensembl Exon ID ENSE00001181383 is expressed much lower in muscle than adipose tissue. This AEU event was not evident in the ensembl database, but was represented in the NCBI database. (B) SRSF5 (ENSG00000100650) undergoes an alternative 3′ UTR event in muscle and at least two SRSF5 transcript variants exist: ENST00000557154 (full) and ENST00000553369 (truncated), with the latter transcript containing Ensemble exon ID ENSE00002452925 which was expressed in muscle to a greater extent. (C) CCDC47 (ENSG00000108588) undergoes 3′UTR extension in adipose tissue since Ensembl exon ID ENSE00001347617 (probes span the entire 3′UTR) was detected in adipose more than muscle. (D) RAB6A (ENSG00000175582) undergoes a mutual splicing event which produces at least two transcripts, with each variant containing a mutually exclusive exon; ENSE00001358762 which is expressed more in adipose tissue (part of ENST00000310653) while the other exon (ENSE00001184543) was is expressed more in muscle tissue (part of ENST00000336083). Details on RT-qPCR validation applied to the human tissue can be found in Supplementary Figure legend S5 and Supporting Information 1.2.
Figure 6.
Figure 6.
Frequency of Pfam domains altered by AEU across muscle, adipose and blood. Each chart represents a single pairwise comparison. Overlapping Pfam domains within Ensembl exon ID coordinates are counted. Only the most frequently occurring Pfam domain classes are shown individually while remaining classes are summed in the ‘other’ group. (A) For blood versus adipose, the Pfam domain is listed if it occurred ≥ 3. (B) For adipose versus blood, the Pfam domain is listed if it occurred ≥ 3. (C) For blood versus muscle comparison, the Pfam domain is listed if it occurred ≥ 9.

References

    1. De Conti L., Baralle M., Buratti E. Exon and intron definition in pre-mRNA splicing. Wiley Interdiscip. Rev. RNA. 2013;4:49–60. - PubMed
    1. Bland C.S., Wang E.T., Vu A., David M.P., Castle J.C., Johnson J.M., Burge C.B., Cooper T.A. Global regulation of alternative splicing during myogenic differentiation. Nucleic Acids Res. 2010;38:7651–7664. - PMC - PubMed
    1. Blencowe B.J., Ahmad S., Lee L.J. Current-generation high-throughput sequencing: deepening insights into mammalian transcriptomes. Genes Dev. 2009;23:1379–1386. - PubMed
    1. Chen F.C. Are all of the human exons alternatively spliced? Brief. Bioinform. 2014;15:542–551. - PubMed
    1. Thorsen K., Sørensen K.D., Brems-Eskildsen A.S., Modin C., Gaustadnes M., Hein A.-M.K., Kruhøffer M., Laurberg S., Borre M., Wang K., et al. Alternative splicing in colon, bladder, and prostate cancer identified by exon array analysis. Mol. Cell. Proteomics. 2008;7:1214–1224. - PubMed

Publication types