. 2016 Jul 1:134:658-670.
doi: 10.1016/j.neuroimage.2016.04.001. Epub 2016 Apr 16.

A multivariate nonlinear mixed effects model for longitudinal image analysis: Application to amyloid imaging

Affiliations

A multivariate nonlinear mixed effects model for longitudinal image analysis: Application to amyloid imaging

Murat Bilgel et al. Neuroimage. .

Abstract

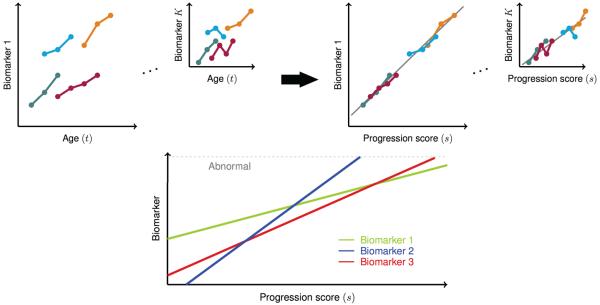
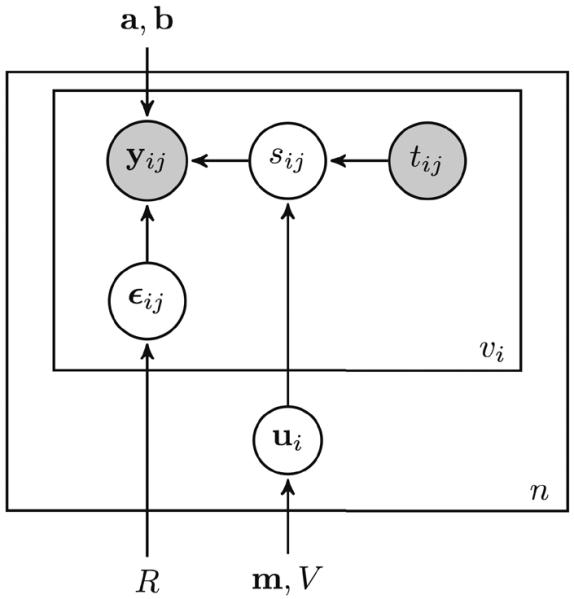
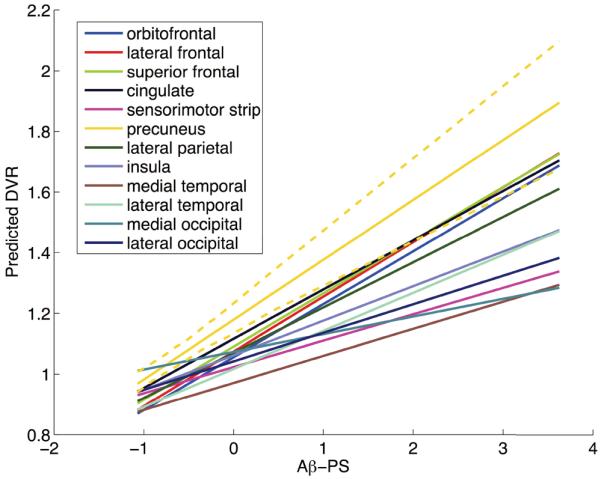
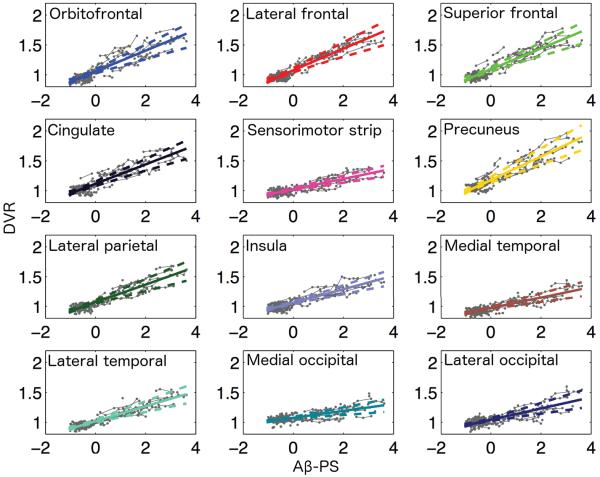
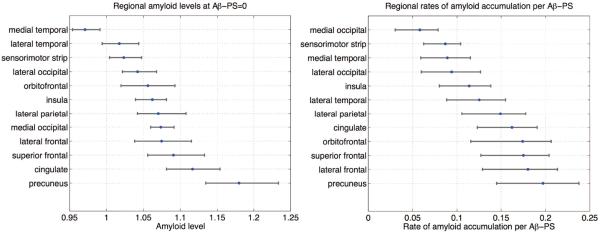
It is important to characterize the temporal trajectories of disease-related biomarkers in order to monitor progression and identify potential points of intervention. These are especially important for neurodegenerative diseases, as therapeutic intervention is most likely to be effective in the preclinical disease stages prior to significant neuronal damage. Neuroimaging allows for the measurement of structural, functional, and metabolic integrity of the brain at the level of voxels, whose volumes are on the order of mm(3). These voxelwise measurements provide a rich collection of disease indicators. Longitudinal neuroimaging studies enable the analysis of changes in these voxelwise measures. However, commonly used longitudinal analysis approaches, such as linear mixed effects models, do not account for the fact that individuals enter a study at various disease stages and progress at different rates, and generally consider each voxelwise measure independently. We propose a multivariate nonlinear mixed effects model for estimating the trajectories of voxelwise neuroimaging biomarkers from longitudinal data that accounts for such differences across individuals. The method involves the prediction of a progression score for each visit based on a collective analysis of voxelwise biomarker data within an expectation-maximization framework that efficiently handles large amounts of measurements and variable number of visits per individual, and accounts for spatial correlations among voxels. This score allows individuals with similar progressions to be aligned and analyzed together, which enables the construction of a trajectory of brain changes as a function of an underlying progression or disease stage. We apply our method to studying cortical β-amyloid deposition, a hallmark of preclinical Alzheimer's disease, as measured using positron emission tomography. Results on 104 individuals with a total of 300 visits suggest that precuneus is the earliest cortical region to accumulate amyloid, closely followed by the cingulate and frontal cortices, then by the lateral parietal cortex. The extracted progression scores reveal a pattern similar to mean cortical distribution volume ratio (DVR), an index of global brain amyloid levels. The proposed method can be applied to other types of longitudinal imaging data, including metabolism, blood flow, tau, and structural imaging-derived measures, to extract individualized summary scores indicating disease progression and to provide voxelwise trajectories that can be compared between brain regions.

Keywords: Amyloid imaging; Longitudinal image analysis; Progression score.


Figures

Figure 1
Figure 1
Illustration of the biomarker alignment concept in the progression score model. The biomarkers we consider in this work are PET measures of cerebral amyloid across a total of K ≈ 30, 000 voxels. Top: Progression score (PS) aligns longitudinal measures better than age, and allows for the estimation of a trajectory for each biomarker/voxel (in gray). Bottom: Estimated biomarker trajectories can be compared on the common PS scale. For references to color, the reader is referred to the web version of this article.
Figure 2
Figure 2
Probabilistic model of the progression score using plate notation. The progression score sij establishes the link between age tij and the voxelwise observations yij. Circles indicate variables, and known measures are shaded. Rectangles indicate that the same model applies across visits (inner rectangle) and individuals (outer rectangle). Arrows indicate dependencies between variables and parameters.
Figure 3
Figure 3
Estimated trajectory slope parameters αk vs ground truth. Dashed line indicates x = y. Gray band corresponds to the 95% confidence intervals obtained from bootstrapping. Estimates are shown in blue if their 95% confidence interval intersects the x = y line, and in red otherwise. Results from the model where (a) C = IK×K and (b) C = C(ρ).
Figure 4
Figure 4
Predicted progression scores sij vs ground truth. Dashed line indicates x = y. Gray band corresponds to the 95% confidence intervals obtained from bootstrapping. Estimates are shown in blue if their 95% confidence interval intersects the x = y line, and in red otherwise. Results from the model where (a) C = IK×K and (b) C = C(ρ).
Figure 5
Figure 5
Correlation of estimated subject-specific variables with mean cortical DVR measures. The line of best fit is shown in blue, and its 95% confidence band in gray. (a) Rate of annual change in mean cortical DVR vs. α, the predicted rate of change in amyloid progression score (R2 = 0.62). (b) Intercept of mean cortical DVR vs. β, the progression score intercept (R2 = 0.48). (c) Mean cortical DVR vs. Aβ-PS at baseline (R2 = 0.95). (d) Mean cortical DVR vs. Aβ-PS at last visit (R2 = 0.96).
Figure 6
Figure 6
(a) Mean cortical DVR and (b) Aβ-PS plotted against age. Longitudinal data points are connected by lines within each subject. Different colors indicate different subjects.
Figure 7
Figure 7
Slope parameters ak obtained from voxelwise PS model projected onto the cortical surface. For each unit increase in Aβ-PS, the DVR value at voxel k increases by ak.
Figure 8
Figure 8
Predicted DVR levels at Aβ-PS = −0.6 (top), 0.4 (middle row), and 1.5 (bottom).
Figure 9
Figure 9
Regional trajectories as function of Aβ-PS. The PS model was used to make voxelwise predictions at a range of Aβ-PS values, and these predictions were averaged within each ROI to obtain regional trajectories. The dashed lines indicate the 95% confidence band obtained using bootstrap results for the precuneus.
Figure 10
Figure 10
Regional trajectories as function of Aβ-PS. The PS model was used to make voxelwise predictions at a range of Aβ-PS values, and these predictions were averaged within each ROI to obtain regional trajectories. The dashed lines indicate the 95% confidence bands for the cortical regions. Estimated trajectories with their 95% confidence bands are superimposed on observed longitudinal data (in gray).
Figure 11
Figure 11
Comparison of levels of amyloid at Aβ-PS= 0 and rates of amyloid accumulation across cortical regions. The intercept parameter b obtained from the PS model was averaged within each ROI to obtain the regional amyloid levels at Aβ-PS= 0, and the trajectory slope parameter a was averaged within each ROI to obtain regional rates.

References

    1. Avants BB, Epstein CL, Grossman M, Gee JC. Symmetric diffeomorphic image registration with cross-correlation: evaluating automated labeling of elderly and neurodegenerative brain. Medical Image Analysis. 2008;12:26–41. - PMC - PubMed
    1. Avants BB, Yushkevich P, Pluta J, Minko D, Korczykowski M, Detre J, Gee JC. The optimal template effect in hippocampus studies of diseased populations. NeuroImage. 2010;49:2457–2466. - PMC - PubMed
    1. Bateman RJ, Xiong C, Benzinger TLS, Fagan AM, Goate A, Fox NC, Marcus DS, Cairns NJ, Xie X, Blazey TM, Holtzman DM, Santacruz A, Buckles V, Oliver A, Moulder K, Aisen PS, Ghetti B, Klunk WE, McDade E, Martins RN, Masters CL, Mayeux R, Ringman JM, Rossor MN, Schofield PR, Sperling RA, Salloway S, Morris JC. Clinical and biomarker changes in dominantly inherited Alzheimer's disease. New England Journal of Medicine. 2012;367:795–804. - PMC - PubMed
    1. Bernal-Rusiel JL, Greve DN, Reuter M, Fischl B, Sabuncu MR. Statistical analysis of longitudinal neuroimage data with linear mixed effects models. NeuroImage. 2012;66:249–260. - PMC - PubMed
    1. Bernal-Rusiel JL, Reuter M, Greve DN, Fischl B, Sabuncu MR. Spatiotemporal linear mixed effects modeling for the mass-univariate analysis of longitudinal neuroimage data. NeuroImage. 2013;81:358–370. - PMC - PubMed

Publication types