. 2016 Apr 19:15:67.
doi: 10.1186/s12933-016-0378-5.

Impaired coronary microcirculation in type 2 diabetic patients is associated with elevated circulating regulatory T cells and reduced number of IL-21R⁺ T cells

Affiliations

Impaired coronary microcirculation in type 2 diabetic patients is associated with elevated circulating regulatory T cells and reduced number of IL-21R⁺ T cells

Bernt Johan von Scholten et al. Cardiovasc Diabetol. .

Abstract

Background: Low-grade systemic inflammation is considered to participate in the progression of type 2 diabetes (T2D) and in diabetic complications.

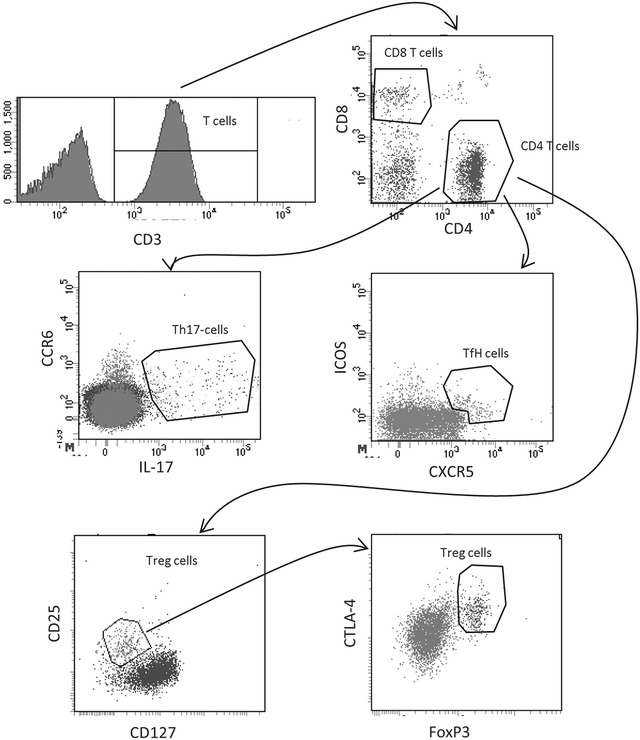
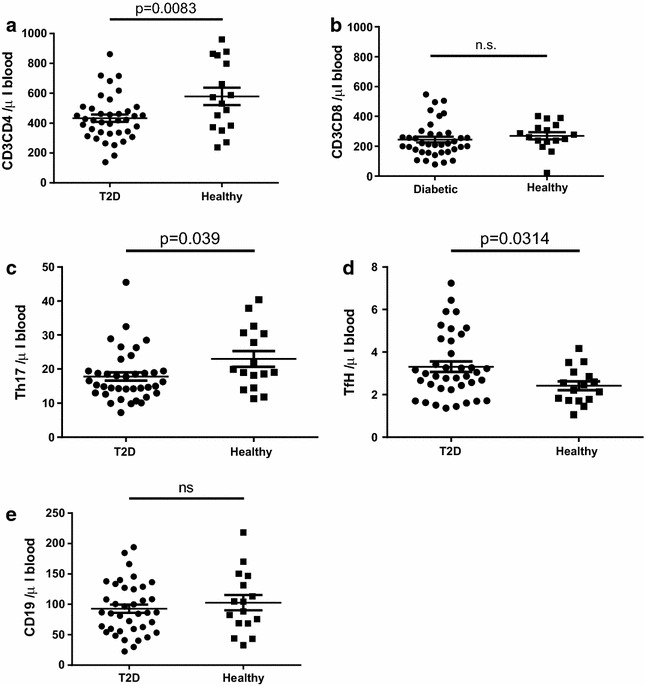
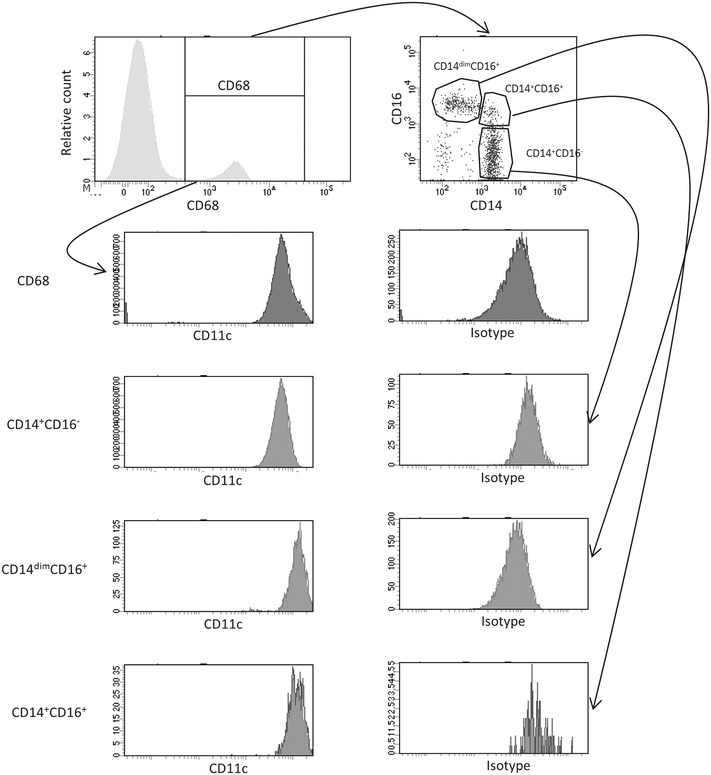
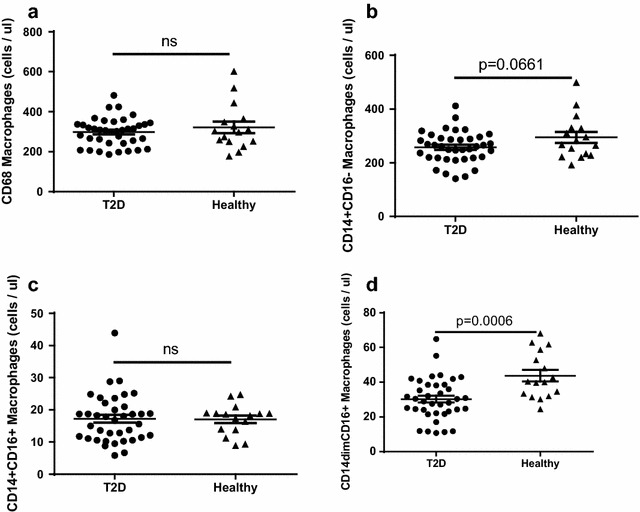
Methods: To determine if circulating leukocytes were abnormally regulated in T2D patients, 8-color flow-cytometry (FACS) analysis was performed in a cross-sectional study of 37 T2D patients and 16 controls. Data obtained from the FACS analysis were compared to coronary flow reserve (CFR), assessed by Rb(82)-PET-imaging, to uncover inflammatory signatures associated with impaired CFR.

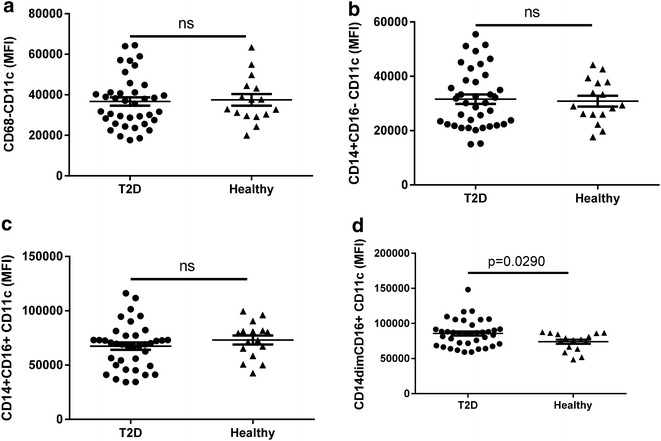
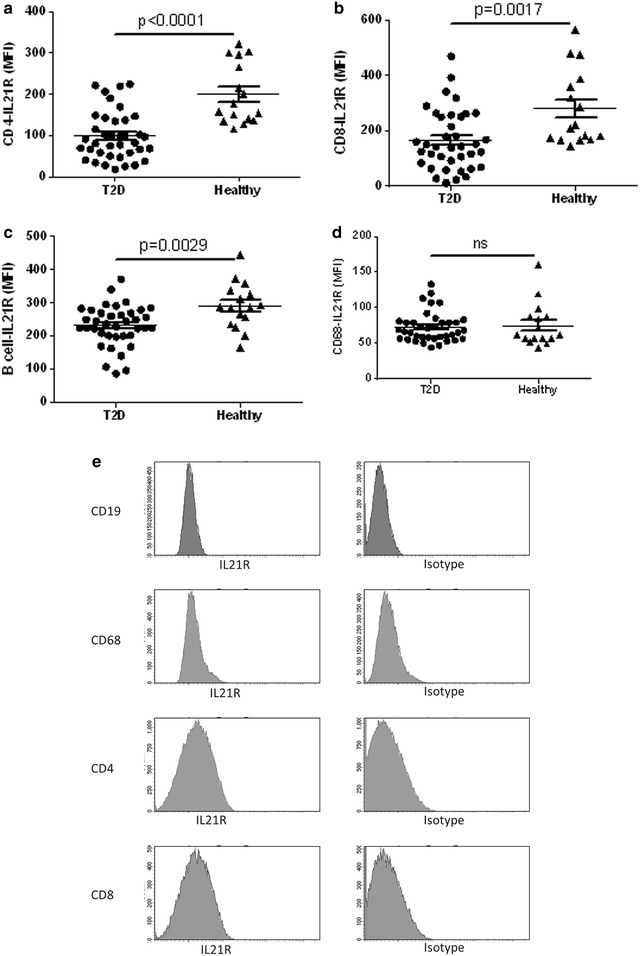
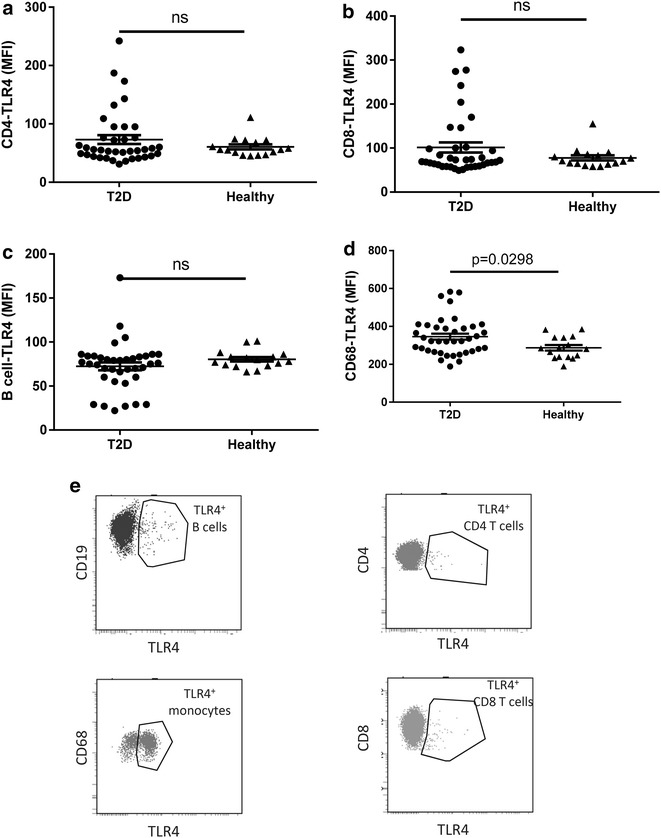
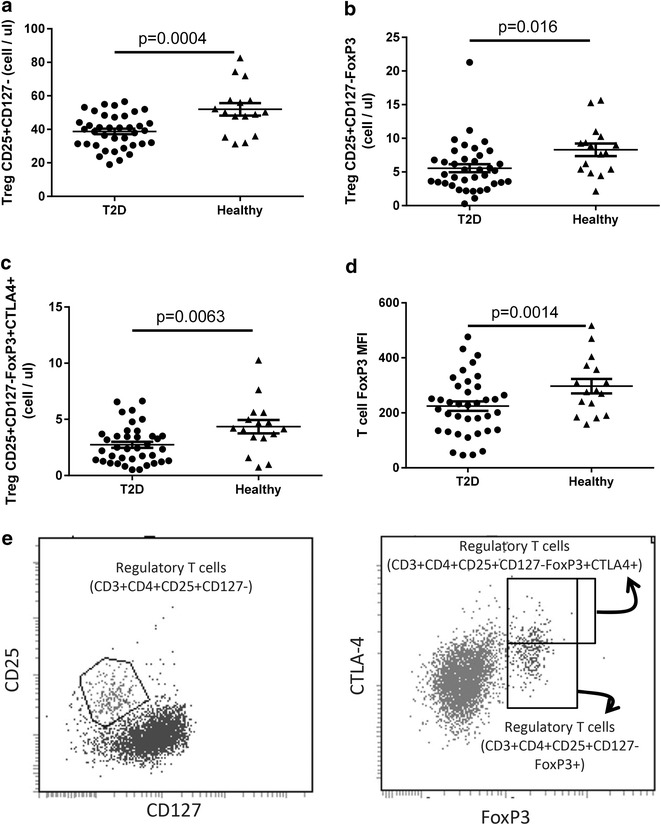
Results: Presence of T2D was associated with T cell attenuation characterized by reduced overall T cell, Th17, IL-21R(+), Treg's and TLR4(+) T cells, while the monocyte population showed enhanced TLR4 expression. Further, our data revealed reduced M1-like CD11c expression in T2D which was associated with impaired CFR. In contrast, we show, for the first time in T2D, increased TLR4 expression on CD8 T cells, increased Treg cell number and Treg maturation and reduced IL-21R expression on CD8 T cells to be functionally associated with impaired CFR.

Conclusions: Our demonstration that HbA1c inversely correlates to several T cell populations suggests that T cells may play disease modulating roles in T2D. Further, the novel association between impaired CFR and regulatory T cells and IL-21R(+) T cells imply an intricate balance in maintaining tissue homeostasis in vascular diabetic complications.

Keywords: Cardiovascular disease; Coronary flow reserve; Coronary microcirculation; Flow-cytometry (FACS) analysis; Inflammation; Monocyte sub-populations; Peripheral blood; Type 2 diabetes.


Figures

Fig. 1
Fig. 1
Circulating lymphocyte populations in diabetic patients and healthy controls. A representative gating strategy for T cell subsets is shown after first identifying the cells using gating strategy in Additional file 1: Figure S1. A total of 2 ml blood was analysed and the total number of each cell population was calculated as described in the “Methods” section
Fig. 2
Fig. 2
Circulating lymphocyte populations in diabetic patients and healthy controls. The number of CD4 T cells (a), CD8 T cells (b), Th17 T cells (c), TfH T cells (d) and B cells (e) is shown. A total of 2 ml blood was analysed and the total number of each cell population was calculated as described in the “Methods” section. Each dot represents one individual and the horizontal line represents the mean value in each group. P values represent difference between groups assessed by t test
Fig. 3
Fig. 3
Total number of circulating monocyte populations in diabetic patients and healthy controls. Representative dot-plot and scatter-plots of CD14 vs CD16 and their expression of CD11c is shown after first identifying the cells using gating strategy in Additional file 1: Figure S1. A total of 2 ml blood was analysed and the total number of each cell population was calculated as described in the “Methods” section
Fig. 4
Fig. 4
Total number of circulating monocyte populations in diabetic patients and healthy controls. The number of CD68+ monocytes (a), M0-like CD14+CD16 monocytes (b), M2-like CD14+CD16+ monocytes (c) and M1-like CD14dimCD16+ monocytes (d) is shown. A total of 2 ml blood was analysed and the total number of each cell population was calculated as described in the “Methods” section. Each dot represents one individual and the horizontal line represents the mean value in each group. P values represent difference between groups assessed by t test
Fig. 5
Fig. 5
CD11c expression levels on monocyte subpopulations in diabetic patients and healthy controls. The CD11c expression on CD68+ monocytes (a), M0-like CD14+CD16 monocytes (b), M2-like CD14+CD16+ monocytes (c) and M1-like CD14dimCD16+ monocytes (d) is shown. A total of 2 ml blood was analysed and the total number of each cell population was calculated as described in the “Methods” section. Each dot represents one individual and the horizontal line represents the mean value in each group. P values represent difference between groups assessed by t test
Fig. 6
Fig. 6
IL-21R expression level on leukocyte populations in diabetic patients and healthy controls. The IL-21R expression on CD4+ T cells (a), CD8+ T cells (b), B cells (c) and CD68+ monocytes (d) is shown. Representative histogram analysis of IL-21R expression on CD19+, CD68+, CD4+ and CD8+ cells compared to the isotype antibody signal (e) that were first identified using the gating strategy from Figs. 1, 2 and Additional file 1: Figure S1. A total of 2 ml blood was analysed and the total number of each cell population was calculated as described in the “Methods” section. Each dot represents one individual and the horizontal line represents the mean value in each group. P values represent difference between groups assessed by t test
Fig. 7
Fig. 7
TLR4 expression level on leukocyte populations in diabetic patients and healthy controls. The TLR4 expression on CD4+ T cells (a), CD8+ T cells (b), B cells (c) and CD68+ monocytes (d) is shown. Representative dot plot analysis of TLR4 expression on CD19, CD68, CD4 and CD8+ cells (e) that were first identified using the gating strategy from Figs. 1, 2 and Additional file 1: Figure S1. A total of 2 ml blood was analysed and the total number of each cell population was calculated as described in the “Methods” section. Each dot represents one individual and the horizontal line represents the mean value in each group. P values represent difference between groups assessed by t test
Fig. 8
Fig. 8
Circulating regulatory populations in diabetic patients and healthy controls. The number of Tregs (CD4+CD25+CD127) T cells (a), FoxP3high Tregs (CD4+CD25+ CD127) T cells (b), CTLA4high Tregs (CD4+CD25+ CD127FoxP3high) T cells (c) and FoxP3 MFI on Tregs (CD4+CD25+ CD127) T cells (d). Representative dot plot analysis of Treg sub-populations (CD3+CD4+CD25+CD127; CD3+CD4+CD25+CD127FoxP3+; CD3+CD4+CD25+CD127FoxP3+CTLA4+) (e) that were first identified using the gating strategy from Figs. 1, 2 and Additional file 1: Figure S1. A total of 2 ml blood was analysed and the total number of each cell population was calculated as described in the “Methods” section. Each dot represents one individual and the horizontal line represents the mean value in each group. P values represent difference between groups assessed by t test. MFI mean fluorescence intensity

Similar articles

Cited by

References

    1. Kraakman MJ, Murphy AJ, Jandeleit-Dahm K, Kammoun HL. Macrophage polarization in obesity and type 2 diabetes: weighing down our understanding of macrophage function? Front Immunol. 2014;5:470. doi: 10.3389/fimmu.2014.00470. - DOI - PMC - PubMed
    1. Donath MY, Shoelson SE. Type 2 diabetes as an inflammatory disease. Nat Rev Immunol. 2011;11(2):98–107. doi: 10.1038/nri2925. - DOI - PubMed
    1. Wellen KE, Hotamisligil GS. Inflammation, stress, and diabetes. J Clin Invest. 2005;115(5):1111–1119. doi: 10.1172/JCI200525102. - DOI - PMC - PubMed
    1. Pradhan AD, Manson JE, Rifai N, Buring JE, Ridker PM. C-reactive protein, interleukin 6, and risk of developing type 2 diabetes mellitus. JAMA. 2001;286(3):327–334. doi: 10.1001/jama.286.3.327. - DOI - PubMed
    1. Mirza S, Hossain M, Mathews C, Martinez P, Pino P, Gay JL, et al. Type 2-diabetes is associated with elevated levels of TNF-alpha, IL-6 and adiponectin and low levels of leptin in a population of Mexican Americans: a cross-sectional study. Cytokine. 2012;57(1):136–142. doi: 10.1016/j.cyto.2011.09.029. - DOI - PMC - PubMed

MeSH terms

Substances