

Miniaturized iPS-Cell-Derived Cardiac Muscles for Physiologically Relevant Drug Response Analyses
- PMID: 27095412
- PMCID: PMC4837370
- DOI: 10.1038/srep24726
Miniaturized iPS-Cell-Derived Cardiac Muscles for Physiologically Relevant Drug Response Analyses
Abstract
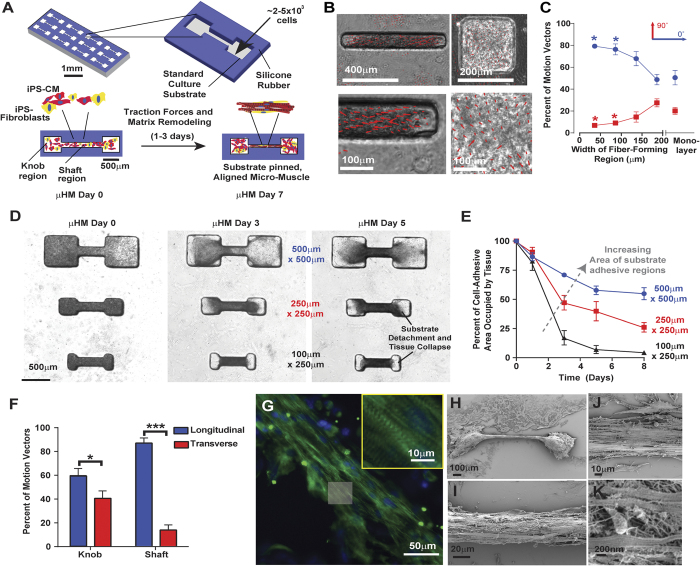
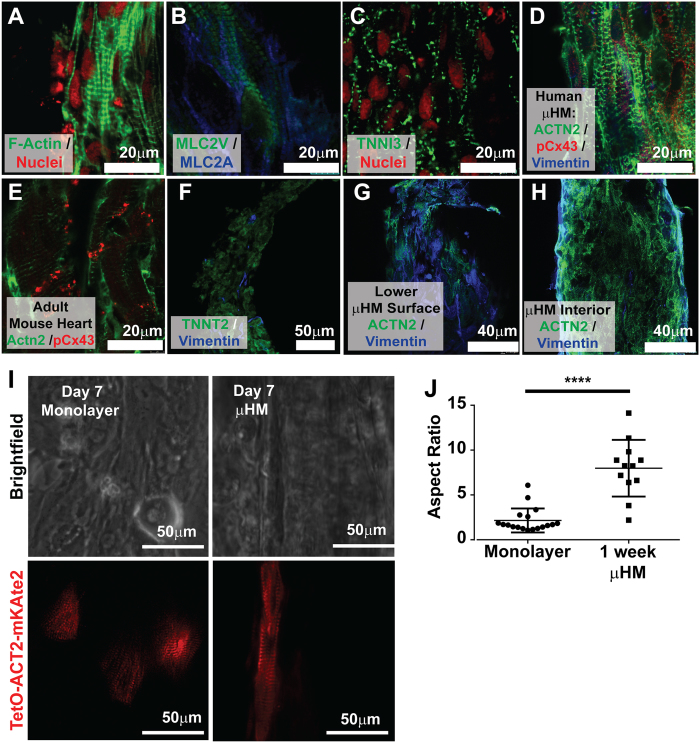
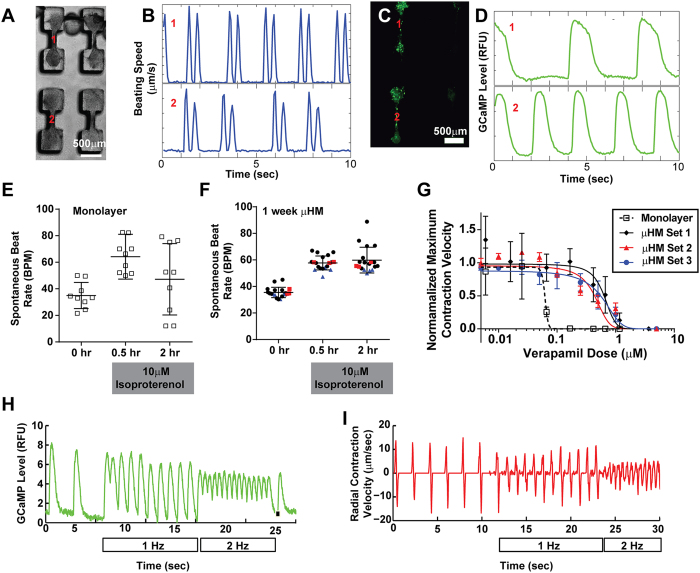
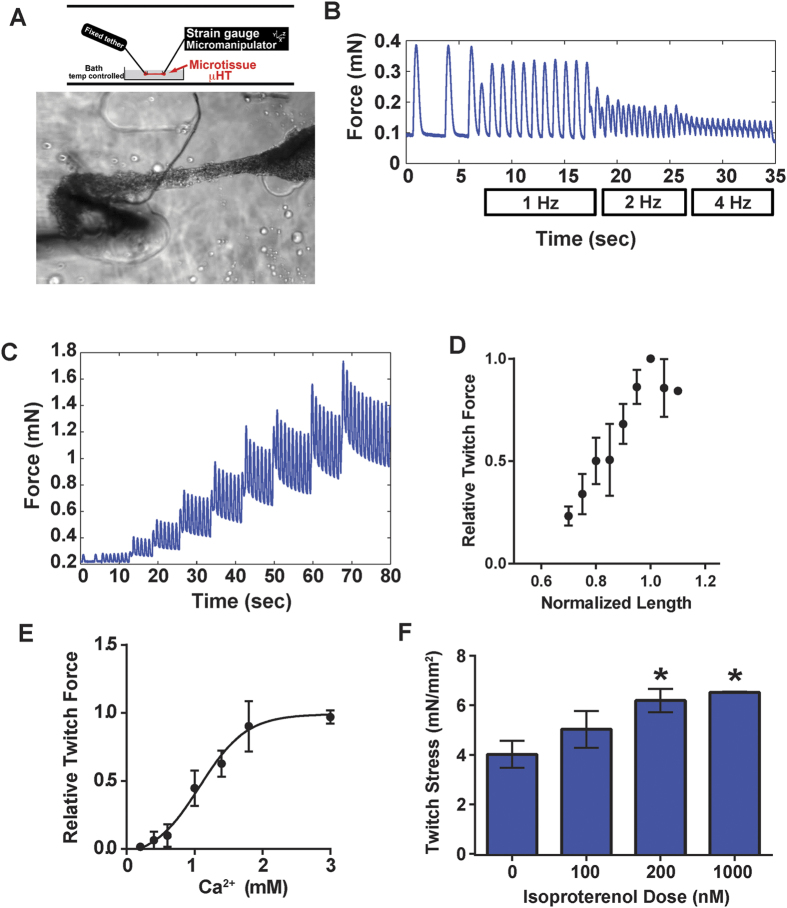
Tissue engineering approaches have the potential to increase the physiologic relevance of human iPS-derived cells, such as cardiomyocytes (iPS-CM). However, forming Engineered Heart Muscle (EHM) typically requires >1 million cells per tissue. Existing miniaturization strategies involve complex approaches not amenable to mass production, limiting the ability to use EHM for iPS-based disease modeling and drug screening. Micro-scale cardiospheres are easily produced, but do not facilitate assembly of elongated muscle or direct force measurements. Here we describe an approach that combines features of EHM and cardiospheres: Micro-Heart Muscle (μHM) arrays, in which elongated muscle fibers are formed in an easily fabricated template, with as few as 2,000 iPS-CM per individual tissue. Within μHM, iPS-CM exhibit uniaxial contractility and alignment, robust sarcomere assembly, and reduced variability and hypersensitivity in drug responsiveness, compared to monolayers with the same cellular composition. μHM mounted onto standard force measurement apparatus exhibited a robust Frank-Starling response to external stretch, and a dose-dependent inotropic response to the β-adrenergic agonist isoproterenol. Based on the ease of fabrication, the potential for mass production and the small number of cells required to form μHM, this system provides a potentially powerful tool to study cardiomyocyte maturation, disease and cardiotoxicology in vitro.
Figures
Similar articles
-
Elastomer-Grafted iPSC-Derived Micro Heart Muscles to Investigate Effects of Mechanical Loading on Physiology.ACS Biomater Sci Eng. 2021 Jul 12;7(7):2973-2989. doi: 10.1021/acsbiomaterials.0c00318. Epub 2020 Oct 21. ACS Biomater Sci Eng. 2021. PMID: 34275296
-
Human gingival fibroblast feeder cells promote maturation of induced pluripotent stem cells into cardiomyocytes.Biochem Biophys Res Commun. 2018 Sep 10;503(3):1798-1804. doi: 10.1016/j.bbrc.2018.07.116. Epub 2018 Jul 27. Biochem Biophys Res Commun. 2018. PMID: 30060947
-
Generation of functional murine cardiac myocytes from induced pluripotent stem cells.Circulation. 2008 Jul 29;118(5):507-17. doi: 10.1161/CIRCULATIONAHA.108.778795. Epub 2008 Jul 14. Circulation. 2008. PMID: 18625890
-
Strategies for replacing myocytes with induced pluripotent stem in clinical protocols.Transplant Rev (Orlando). 2012 Jul;26(3):223-32. doi: 10.1016/j.trre.2011.09.003. Epub 2011 Dec 14. Transplant Rev (Orlando). 2012. PMID: 22172453 Review.
-
iPS cells: a source of cardiac regeneration.J Mol Cell Cardiol. 2011 Feb;50(2):327-32. doi: 10.1016/j.yjmcc.2010.10.026. Epub 2010 Oct 30. J Mol Cell Cardiol. 2011. PMID: 21040726 Review.
Cited by
-
Microengineered systems with iPSC-derived cardiac and hepatic cells to evaluate drug adverse effects.Exp Biol Med (Maywood). 2021 Feb;246(3):317-331. doi: 10.1177/1535370220959598. Epub 2020 Sep 17. Exp Biol Med (Maywood). 2021. PMID: 32938227 Free PMC article. Review.
-
Matrix-guided control of mitochondrial function in cardiac myocytes.Acta Biomater. 2019 Oct 1;97:281-295. doi: 10.1016/j.actbio.2019.08.007. Epub 2019 Aug 8. Acta Biomater. 2019. PMID: 31401347 Free PMC article.
-
Human Induced Pluripotent Stem-Cardiac-Endothelial-Tumor-on-a-Chip to Assess Anticancer Efficacy and Cardiotoxicity.Tissue Eng Part C Methods. 2020 Jan;26(1):44-55. doi: 10.1089/ten.TEC.2019.0248. Epub 2020 Jan 3. Tissue Eng Part C Methods. 2020. PMID: 31797733 Free PMC article.
-
Heart-on-Chip for Combined Cellular Dynamics Measurements and Computational Modeling Towards Clinical Applications.Ann Biomed Eng. 2022 Feb;50(2):111-137. doi: 10.1007/s10439-022-02902-7. Epub 2022 Jan 17. Ann Biomed Eng. 2022. PMID: 35039976 Review.
-
Advances in the design, generation, and application of tissue-engineered myocardial equivalents.Front Bioeng Biotechnol. 2023 Sep 22;11:1247572. doi: 10.3389/fbioe.2023.1247572. eCollection 2023. Front Bioeng Biotechnol. 2023. PMID: 37811368 Free PMC article. Review.
References
Publication types
MeSH terms
Grants and funding
- R01HL096525/HL/NHLBI NIH HHS/United States
- UH2TR000487/TR/NCATS NIH HHS/United States
- U01GM09614/GM/NIGMS NIH HHS/United States
- 129844/CAPMC/ CIHR/Canada
- U01HL098179/HL/NHLBI NIH HHS/United States
- UL1 TR000004/TR/NCATS NIH HHS/United States
- R01HL108677/HL/NHLBI NIH HHS/United States
- P01 HL089707/HL/NHLBI NIH HHS/United States
- U01 HL098179/HL/NHLBI NIH HHS/United States
- UH2 TR000487/TR/NCATS NIH HHS/United States
- U01HL100406/HL/NHLBI NIH HHS/United States
- U01 HL100406/HL/NHLBI NIH HHS/United States
- R01 HL108677/HL/NHLBI NIH HHS/United States
- UH3 TR000487/TR/NCATS NIH HHS/United States
- R01 HL130533/HL/NHLBI NIH HHS/United States
- R01 HL096525/HL/NHLBI NIH HHS/United States
- P01HL089707/HL/NHLBI NIH HHS/United States
- K12 HD072222/HD/NICHD NIH HHS/United States
- T32 HL007544/HL/NHLBI NIH HHS/United States
LinkOut - more resources
Full Text Sources
Other Literature Sources
