

Developing a clinical utility framework to evaluate prediction models in radiogenomics
- PMID: 27095854
- PMCID: PMC4834184
- DOI: 10.1117/12.2081954
Developing a clinical utility framework to evaluate prediction models in radiogenomics
Abstract
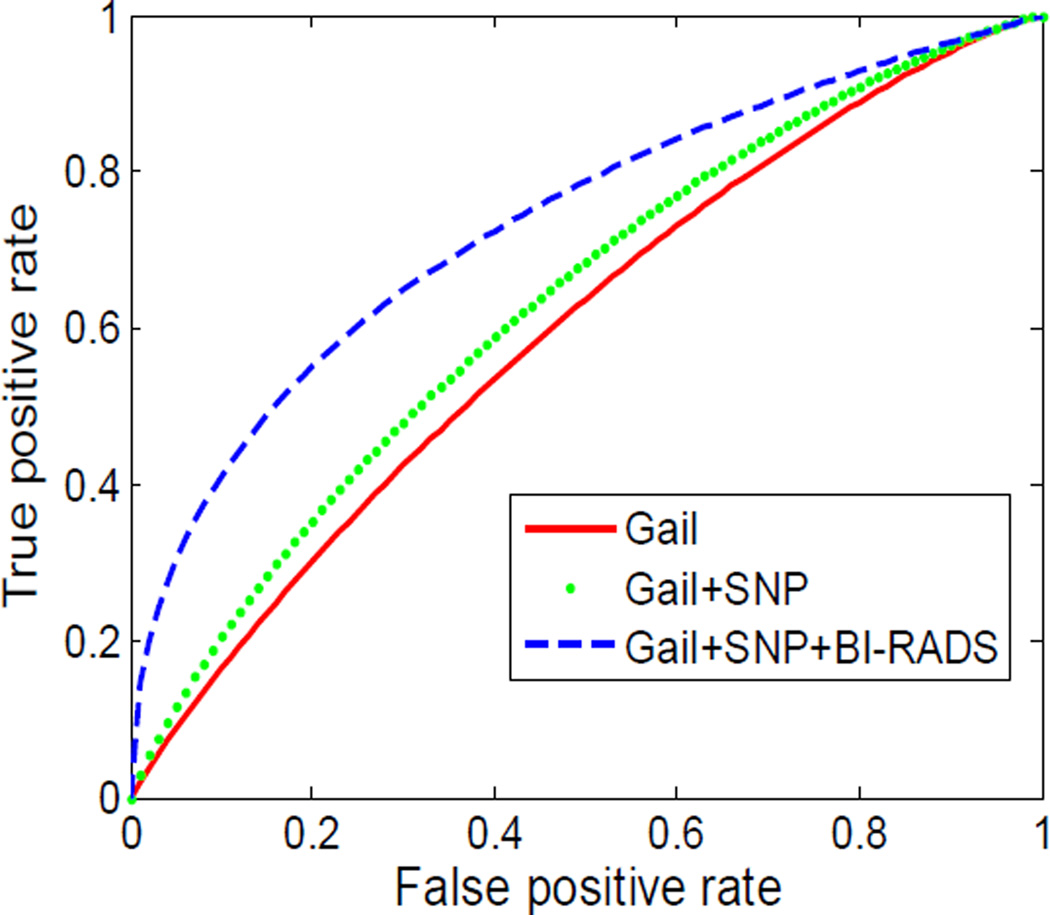
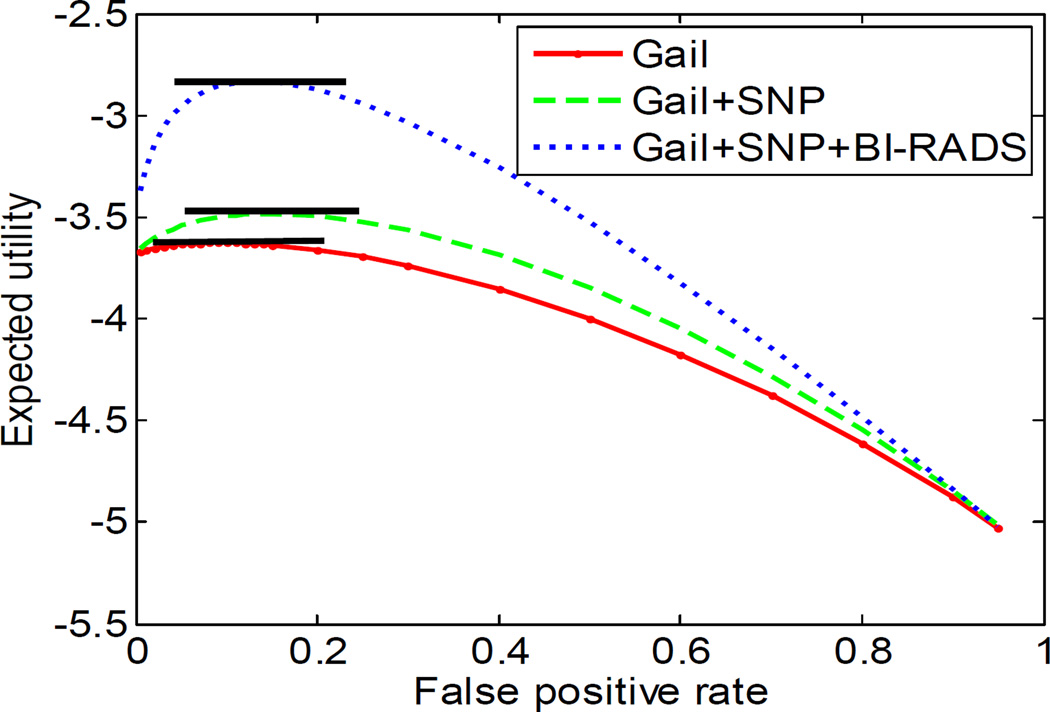
Combining imaging and genetic information to predict disease presence and behavior is being codified into an emerging discipline called "radiogenomics." Optimal evaluation methodologies for radiogenomics techniques have not been established. We aim to develop a clinical decision framework based on utility analysis to assess prediction models for breast cancer. Our data comes from a retrospective case-control study, collecting Gail model risk factors, genetic variants (single nucleotide polymorphisms-SNPs), and mammographic features in Breast Imaging Reporting and Data System (BI-RADS) lexicon. We first constructed three logistic regression models built on different sets of predictive features: (1) Gail, (2) Gail+SNP, and (3) Gail+SNP+BI-RADS. Then, we generated ROC curves for three models. After we assigned utility values for each category of findings (true negative, false positive, false negative and true positive), we pursued optimal operating points on ROC curves to achieve maximum expected utility (MEU) of breast cancer diagnosis. We used McNemar's test to compare the predictive performance of the three models. We found that SNPs and BI-RADS features augmented the baseline Gail model in terms of the area under ROC curve (AUC) and MEU. SNPs improved sensitivity of the Gail model (0.276 vs. 0.147) and reduced specificity (0.855 vs. 0.912). When additional mammographic features were added, sensitivity increased to 0.457 and specificity to 0.872. SNPs and mammographic features played a significant role in breast cancer risk estimation (p-value < 0.001). Our decision framework comprising utility analysis and McNemar's test provides a novel framework to evaluate prediction models in the realm of radiogenomics.
Keywords: ROC methodology; breast imaging; expected utility; genetics; mammography.
Figures

References
Grants and funding
LinkOut - more resources
Full Text Sources
Other Literature Sources