. 2015 Jul 6:10:2.
doi: 10.5334/1750-2187-10-2.

Inhibition of Gαs/cAMP Signaling Decreases TCR-Stimulated IL-2 transcription in CD4(+) T Helper Cells

Affiliations

Inhibition of Gαs/cAMP Signaling Decreases TCR-Stimulated IL-2 transcription in CD4(+) T Helper Cells

Thomas R Hynes et al. J Mol Signal. .

Abstract

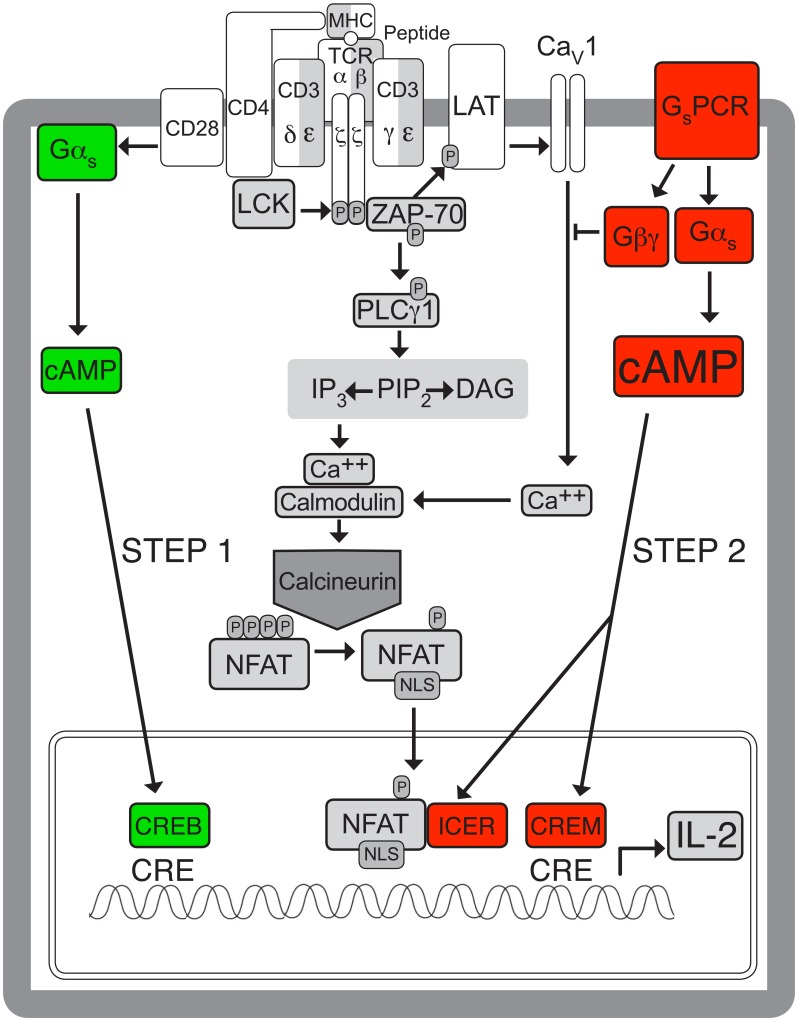
Background: The role of cAMP in regulating T cell activation and function has been controversial. cAMP is generally known as an immunosuppressant, but it is also required for generating optimal immune responses. As the effect of cAMP is likely to depend on its cellular context, the current study investigated whether the mechanism of activation of Gαs and adenylyl cyclase influences their effect on T cell receptor (TCR)-stimulated interleukin-2 (IL-2) mRNA levels.

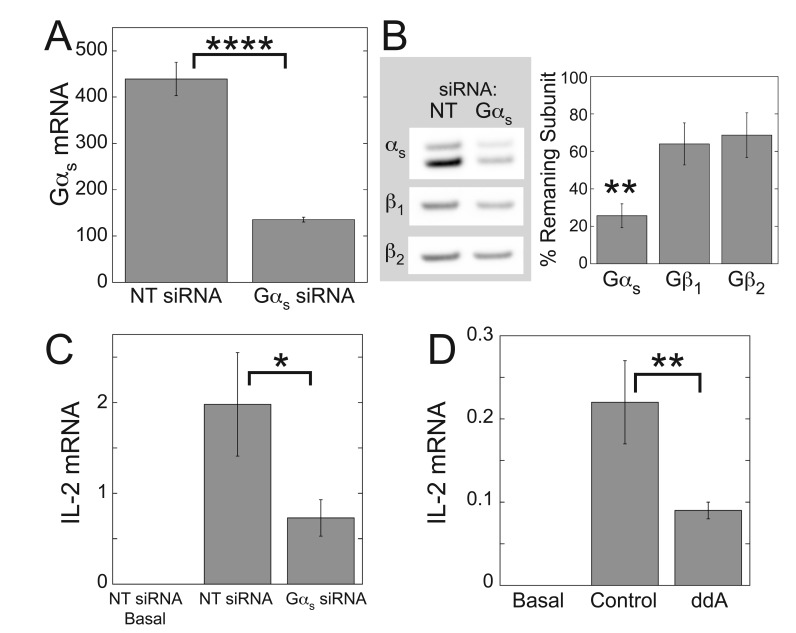
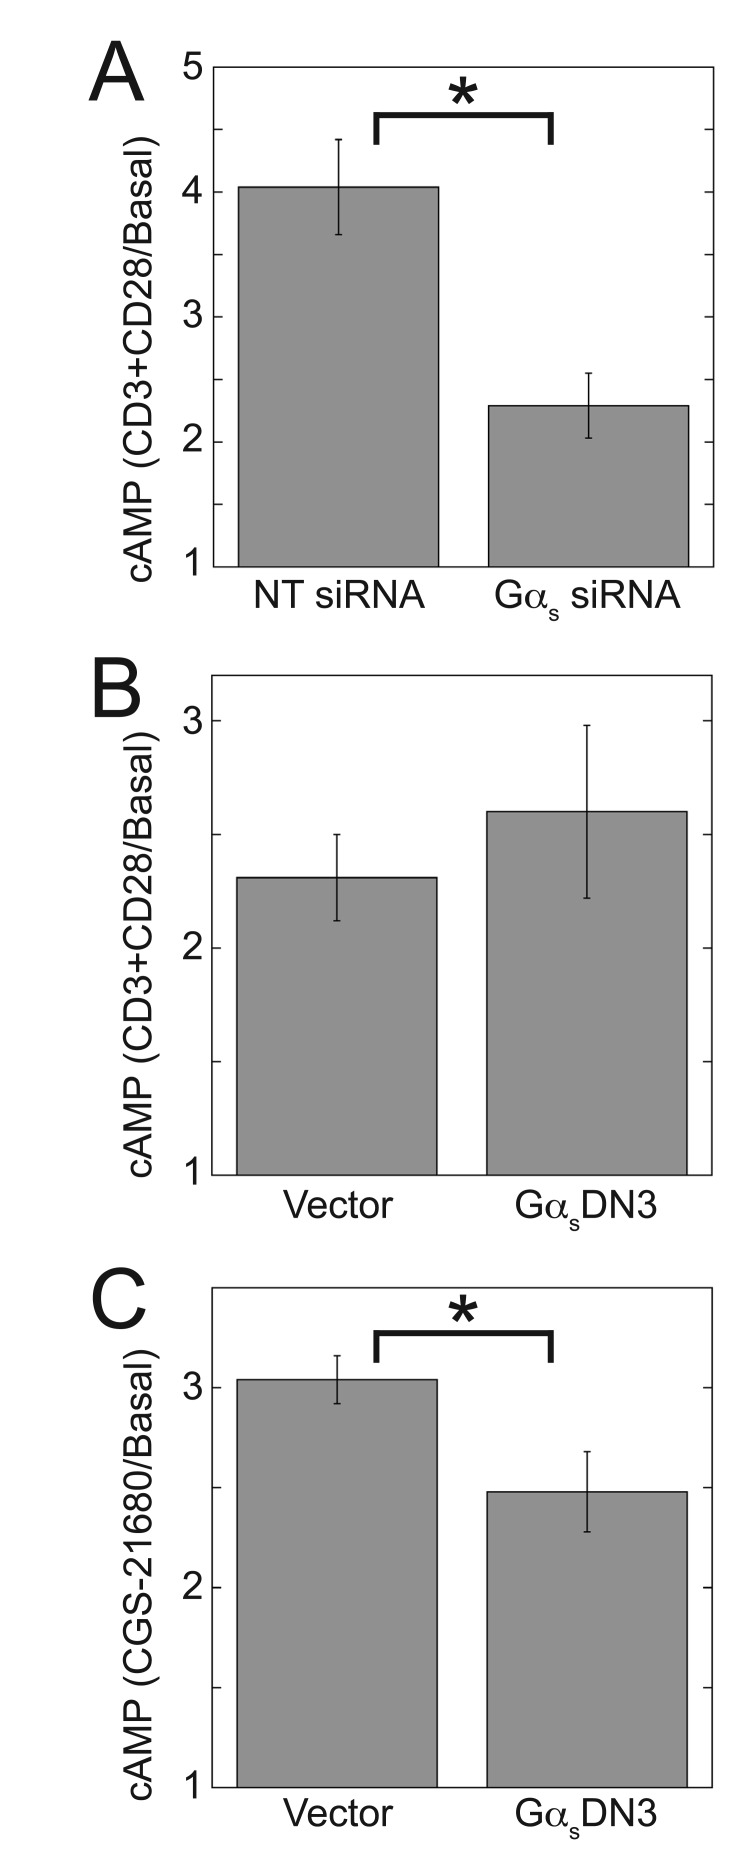
Methods: The effect of blocking Gs-coupled receptor (GsPCR)-mediated Gs activation on TCR-stimulated IL-2 mRNA levels in CD4(+) T cells was compared with that of knocking down Gαs expression or inhibiting adenylyl cyclase activity. The effect of knocking down Gαs expression on TCR-stimulated cAMP accumulation was compared with that of blocking GsPCR signaling.

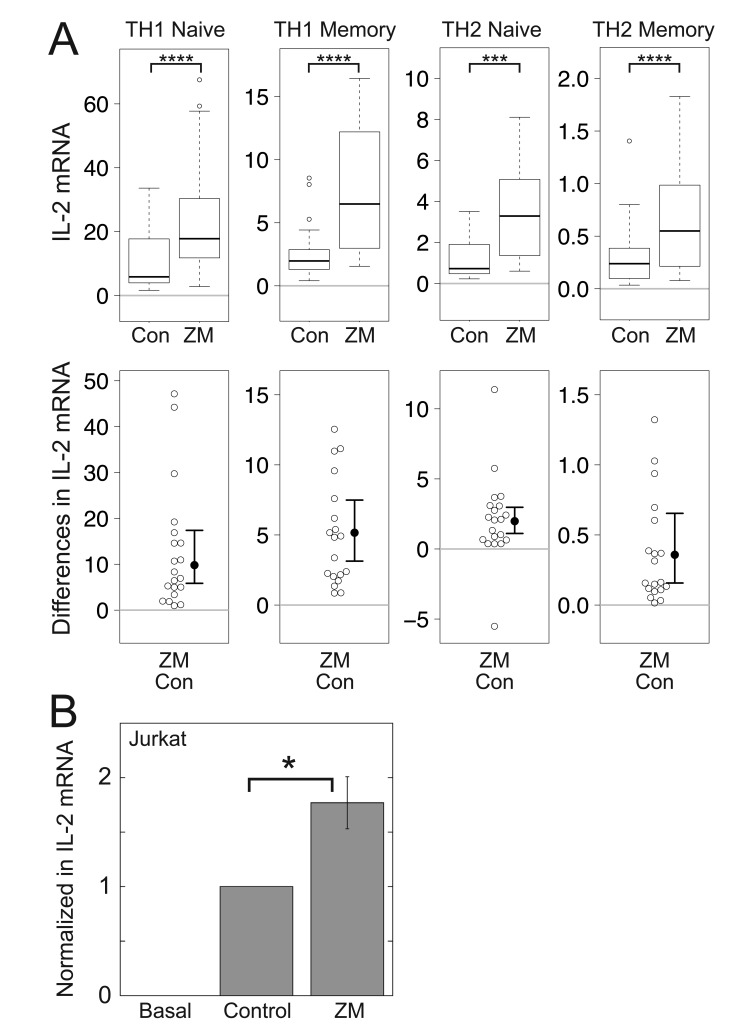
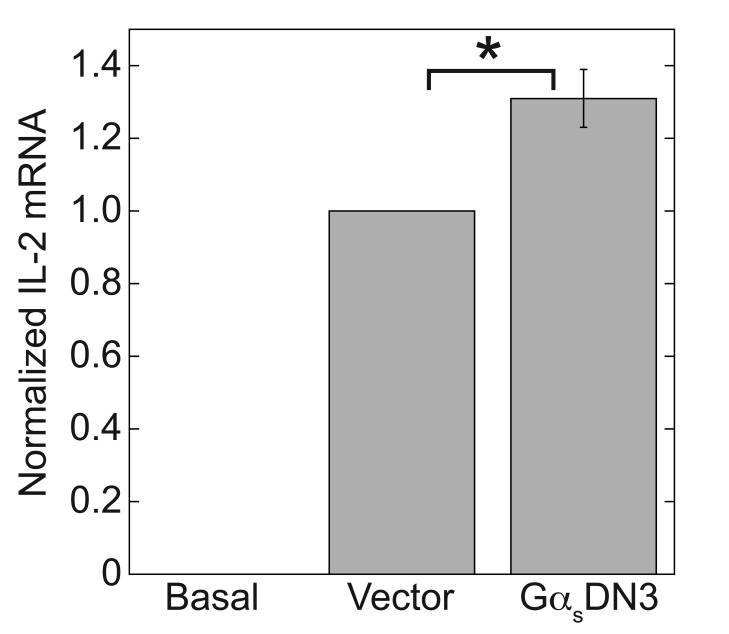
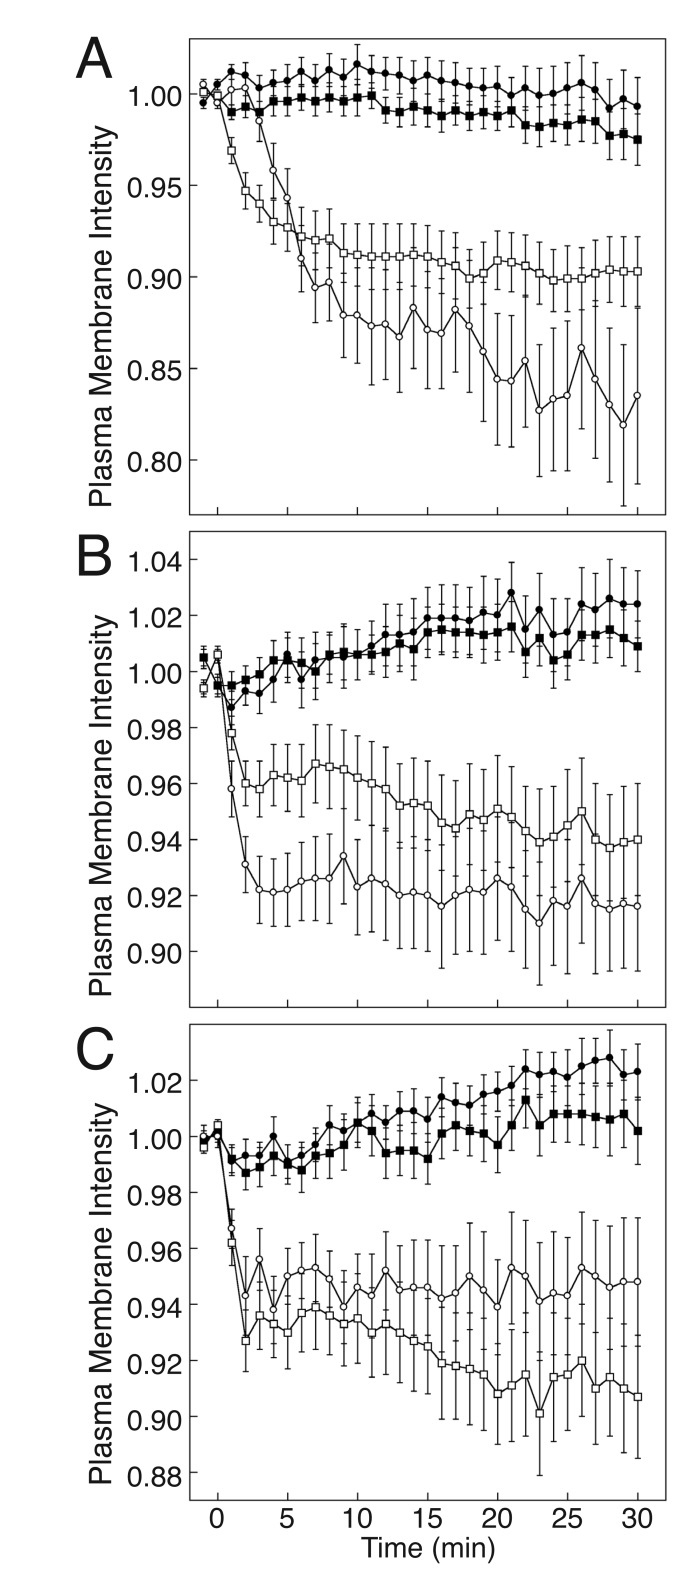
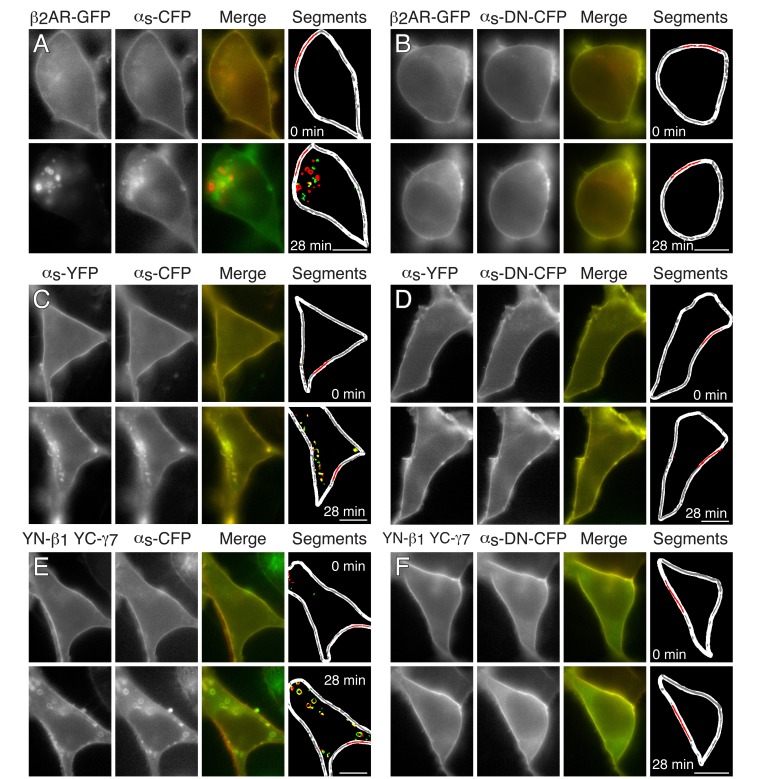
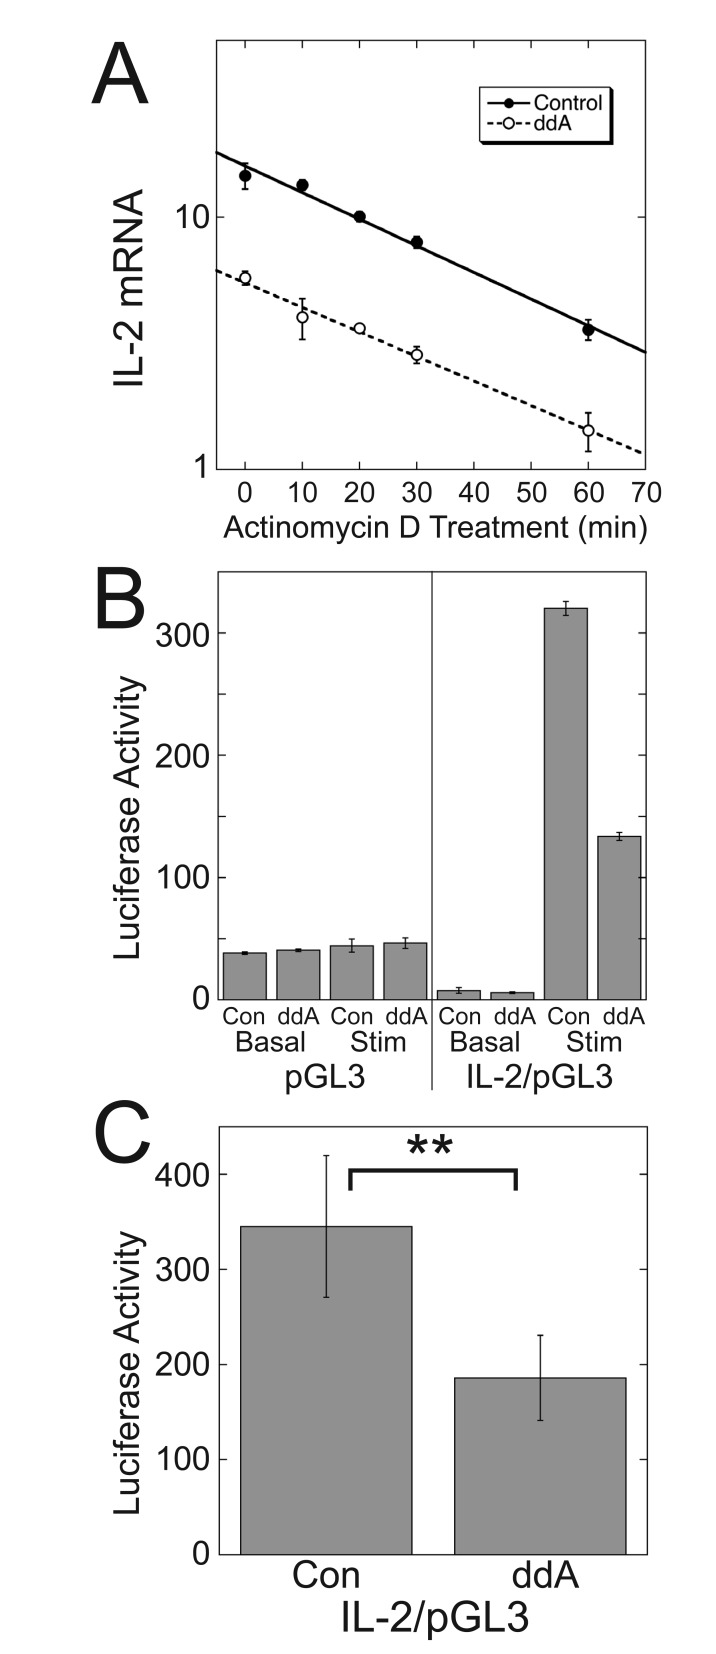
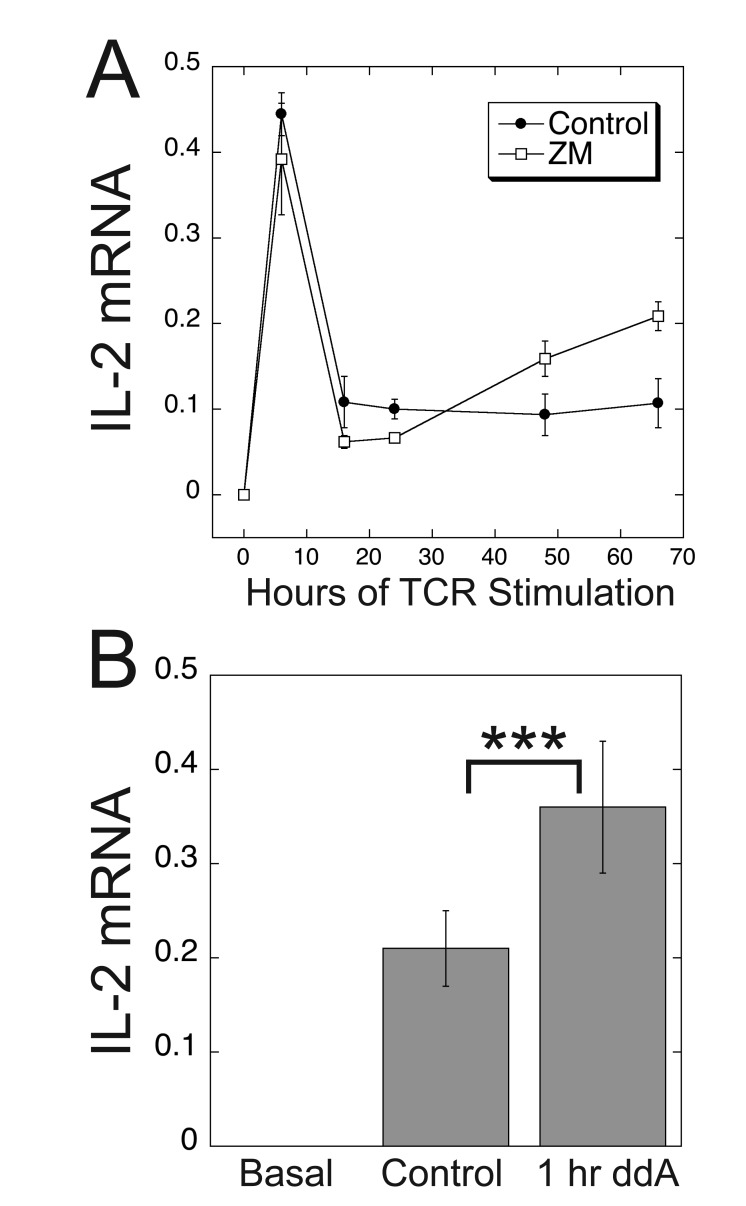
Results: ZM-241385, an antagonist to the Gs-coupled A2A adenosine receptor (A2AR), enhanced TCR-stimulated IL-2 mRNA levels in primary human CD4(+) T helper cells and in Jurkat T cells. A dominant negative Gαs construct, GαsDN3, also enhanced TCR-stimulated IL-2 mRNA levels. Similar to GsPCR antagonists, GαsDN3 blocked GsPCR-dependent activation of both Gαs and Gβγ. In contrast, Gαs siRNA and 2',5'-dideoxyadenosine (ddA), an adenylyl cyclase inhibitor, decreased TCR-stimulated IL-2 mRNA levels. Gαs siRNA, but not GαsDN3, decreased TCR-stimulated cAMP synthesis. Potentiation of IL-2 mRNA levels by ZM-241385 required at least two days of TCR stimulation, and addition of ddA after three days of TCR stimulation enhanced IL-2 mRNA levels.

Conclusions: GsPCRs play an inhibitory role in the regulation of TCR-stimulated IL-2 mRNA levels whereas Gαs and cAMP can play a stimulatory one. Additionally, TCR-dependent activation of Gαs does not appear to involve GsPCRs. These results suggest that the context of Gαs/cAMP activation and the stage of T cell activation and differentiation determine the effect on TCR-stimulated IL-2 mRNA levels.

Keywords: G-protein-coupled receptor; Gαs; IL-2; T helper cells; cAMP; heterotrimeric G-protein.


Figures

Figure 1
Figure 1
Antagonism of the A2AR enhances TCR-stimulated IL-2 mRNA increases in primary human CD4+ T cells and Jurkat T cells. (A) Box plots (top) and difference plots (bottom) show data from naïve and memory CD4+ T cells isolated from the peripheral blood of 20 healthy donors, stimulated with plate-bound anti-CD3 and soluble anti-CD28, and grown in conditions promoting TH1 or TH2 differentiation for three days in the presence or absence of ZM-241385 (ZM). IL-2 mRNA levels were determined by qPCR. In the box plots (top), the height of the box plots equals the interquartile range (IQR) and the horizontal line within the box indicates the median value. The whiskers extend to the lowest and highest data points within 1.5 X IQR and the open circles indicate the outliers, which lie above or below the whiskers. In the difference plots (bottom), open circles show pairwise differences in IL-2 mRNA for each sample when treated with ZM-241385 (ZM) or not (Con). To the right of the open circles are the median values (closed circles) and 95% confidence intervals. (B) Jurkat cells were stimulated with plate-bound anti-CD3 and soluble anti-CD28 in the absence or presence of ZM-241385 (ZM) for three days. IL-2 mRNA levels were determined by qPCR and normalized to the amount produced by the TCR-stimulated control. Data represent the mean ± SE from 8 experiments. *, p < 0.05; ***, p < 0.001; ****, p < 0.0001.
Figure 2
Figure 2
A dominant negative Gαs construct, GαsDN3, which blocks signaling from Gs-coupled receptors, enhances TCR-stimulated IL-2 mRNA increases. Jurkat cells were nucleofected with GαsDN3 or empty vector (pcDNAI/Amp) and then stimulated with plate-bound anti-CD3 and soluble anti-CD28 for 3 days. IL-2 mRNA levels were determined by qPCR and normalized to the amount produced by the TCR-stimulated control. Data represent the mean ± SE from 8 experiments. *, p < 0.05.
Figure 3
Figure 3
Quantification of the inhibitory effects of GαsDN3 on internalization of the β2AR, Gαs, and Gβ1γ7 from the plasma membrane. Fluorescent fusion protein internalization responses were measured in HEK-293 cells stimulated with 10 µM isoproterenol following the second time point. Values represent means ± SE. The number of cells analyzed in each case is indicated in parentheses. (A) GαsDN3-CFP blocks isoproterenol-mediated internalization of β2AR-GFP. 105 cells were transfected with the following plasmids: GαsDN3-CFP or Gαs-CFP, 0.15 µg; Gβ1 and Gγ7, 0.075 µg each; β2AR-GFP, 0.05 µg; mRFP-Mem, 0.0025 µg. Plasma membrane intensity values for β2AR-GFP in the presence of Gαs-CFP (open circles, 30 cells) and in the presence of GαsDN3-CFP (filled circles, 37 cells), for Gαs-CFP (open squares, 30 cells), and for GαsDN3-CFP (filled squares, 37 cells) were determined as described in Methods. (B) GαsDN3-CFP blocks isoproterenol-mediated internalization of Gαs-YFP. 105 cells were transfected with the following plasmids: GαsDN3-CFP or Gαs-CFP, 0.075 µg; Gαs-YFP, 0.075 µg; Gβ1 and Gγ7, 0.075 µg each; β2AR, 0.05 µg; mRFP-Mem, 0.0025 µg. Plasma membrane intensity values are indicated as follows: Gαs-YFP in the presence of Gαs-CFP (open circles, 29 cells) and in the presence of GαsDN3-CFP (filled circles, 37 cells), Gαs-CFP (open squares, 29 cells), and GαsDN3-CFP (filled squares, 37 cells). (C) GαsDN3-CFP blocks isoproterenol-mediated internalization of YFP-N-Gβ1/YFP-C-Gγ7. 105 cells were transfected with the following plasmids: GαsDN3-CFP or Gαs-CFP, 0.15 µg; YFP-N-Gβ1 and YFP-C-Gγ7, 0.075 µg each; β2AR, 0.05 µg; mRFP-Mem, 0.0025 µg. Plasma membrane intensity values are indicated as follows: YFP-N-Gβ1/YFP-C-Gγ7 in the presence of Gαs-CFP (open circles, 25 cells) and in the presence of GαsDN3-CFP (filled circles, 35 cells), Gαs-CFP (open squares, 25 cells), and GαsDN3-CFP (filled squares, 35 cells).
Figure 4
Figure 4
Representative images showing effects of GαsDN3 on stimulus-dependent internalization of the β2AR, Gαs, and Gβ1γ7 in HEK-293 cells. Top rows of images, before stimulation; bottom rows, 28 minutes after stimulation. (A and B) GαsDN3-CFP blocks isoproterenol-stimulated internalization of β2AR-GFP. Cells were transfected with β2AR-GFP, Gβ1, Gγ7, mRFP-Mem, and either Gαs-CFP (A) or GαsDN3-CFP (B). To compensate for the increased brightness of the β2AR-GFP image after stimulation in (A), restricted ranges of the pixel values of the β2AR-GFP images were plotted as follows: 0 min, 0-950; 28 min, 0-3800. (C and D) GαsDN3-CFP does not internalize and blocks isoproterenol-stimulated internalization of Gαs-YFP. Cells were transfected with β2AR-GFP, Gβ1, Gγ7, mRFP-Mem, and either Gαs-CFP (C) or GαsDN3-CFP (D). (E and F) GαsDN3-CFP blocks isoproterenol-stimulated internalization of YFP-N-Gβ1/YFP-C-Gγ7. Cells were transfected with β2AR, YFP-N-Gβ1, YFP-C-Gγ7, mRFP-Mem, and either Gαs-CFP (E) or GαsDN3-CFP (F). In the merge images and the cytoplasmic regions of the segments images, GFP and YFP fusion proteins are red, Gαs-CFP and GαsDN3-CFP are green, and overlap is yellow. In the segments image, the cell border is white, the segmented plasma membrane is gray, the portion of the plasma membrane segment used for analysis of intensity is red, and overlap of vesicle segments is shown in yellow. Vesicles were segmented as described [36]. Plasmid amounts used in the transfections are given in the legend for Fig. 3. αs-CFP indicates Gαs-CFP, αs-DN-CFP indicates GαsDN3-CFP, YN indicates YFP-N, and YC indicates YFP-C. (Bars = 10 µm.)
Figure 5
Figure 5
s siRNA and adenylyl cyclase inhibition with ddA decrease TCR-stimulated IL-2 mRNA levels. Jurkat cells were nucleofected with Gαs siRNA or NT siRNA as described in Methods (A-C) and stimulated with plate-bound anti-CD3 and soluble anti-CD28 for 3 days (A, C). Gαs siRNA significantly decreased levels of Gαs mRNA (A), Gαs protein (B), and IL-2 mRNA (C). Data for (A) and (C) represent the mean ± SE from 8 experiments. (B) Left, each immunoblot is representative of three immunoblots. Right, quantification of protein expression levels in the presence of Gαs siRNA relative to NT siRNA. Data represent mean ± SE from 3 experiments. (D) Jurkat cells were stimulated with plate-bound anti-CD3 and soluble anti-CD28 for 3 days in the presence or absence of ddA. Data represent the mean ± SE from 17 experiments. mRNA levels were determined by qPCR. *, p < 0.05; **, p < 0.01; ****, p < 0.0001.
Figure 6
Figure 6
Inhibiting cAMP production decreases activity of the IL-2 promoter without affecting IL-2 mRNA stability. (A) ddA does not decrease stability of IL-2 mRNA. After 3 days of TCR stimulation with plate-bound anti-CD3 and soluble anti-CD28 in the presence or absence of ddA, Jurkat cells were incubated for the indicated times with Actinomycin D to inhibit transcription, and the rate of IL-2 mRNA degradation was measured. In both cases, the rates of IL-2 mRNA degradation fit a single exponential. Data represent means ± SD from triplicate determinations from a single experiment representative of 4 experiments. (B) ddA decreases IL-2 promoter activity in a luciferase reporter assay. Jurkat cells were stimulated with plate-bound anti-CD3 and soluble anti-CD28 in the presence or absence of ddA for 3 days following nucleofection with the indicated plasmids. (B) Data represent means ± SD from triplicate determinations from a single assay representative of 6 assays. (C) Data represent the means ± SE of values from stimulated cells expressing IL2/pGL3 from the 6 assays. **, p < 0.01.
Figure 7
Figure 7
s siRNA, but not GαsDN3, decreases TCR-stimulated cAMP. Jurkat cells were nucleofected with the indicated siRNA or plasmids and then assayed for cAMP accumulation as described in Methods. The TCR was stimulated with 2.5 µg/ml plate-bound anti-CD3 and 2.5 µg/ml soluble anti-CD28 (A and B), and the A2AR was stimulated with 300 µM CGS-21680 (C). Data in (A) represent the mean ± SE from 3 experiments and data in (B and C) represent the mean ± SE from 9 experiments. *, p < 0.05.
Figure 8
Figure 8
Evidence for an inhibitory effect of cAMP on TCR-stimulated IL-2 mRNA levels after at least 2 days of TCR stimulation. (A) The potentiating effect of A2AR antagonism was only observed after at least two days of TCR stimulation. IL-2 levels peaked within 24 hours of TCR stimulation and then decreased over the next 48 hours. Jurkat cells were stimulated with plate-bound anti-CD3 and soluble anti-CD28 antibodies in the presence or absence of ZM-241385 (ZM) and IL-2 mRNA levels were determined by qPCR at the indicated times. Data represent the means ± SD from a single experiment that is representative of three such experiments. (B) Stimulation of the TCR for three days followed by one hour of ddA treatment leads to potentiation of TCR-stimulated IL-2 mRNA levels by ddA. After three days of TCR stimulation with plate-bound anti-CD3 and soluble anti-CD28, Jurkat cells were treated with ddA for one hour before determination of IL-2 mRNA levels by qPCR. Data represent the mean ± SE from 14 experiments. ***, p < 0.001.
Figure 9
Figure 9
Model of how the source and context of activated Gαs and cAMP may determine whether they enhance or inhibit TCR-stimulated IL-2 transcription. Interactions between the TCR and peptide-major histocompatibility complex (MHC) lead to recruitment of CD4 and its associated kinase, p56-Lck, which phosphorylates tyrosine residues in the cytoplasmic tails of the TCR subunits, leading to recruitment and phosphorylation of the tyrosine kinase, ZAP-70. CD28 co-stimulation provides an additional signal that is needed for complete T cell activation and regulation of IL-2 production [46]. ZAP-70 and p56-Lck then phosphorylate and activate numerous downstream target proteins, including PLC-γ, leading to Ca2+ increases and activation of a variety of downstream pathways including translocation of NFAT to the nucleus and activation of IL-2 transcription [77] (black and white pathway). Gαs stimulated by a mechanism that does not involve GsPCRs, but which could potentially involve the TCR, enhances TCR-stimulated IL-2 transcription by a mechanism that may involve binding of pCREB to the CRE site of the IL-2 promoter [68787980] during the initial stages of TCR stimulation (green pathway, Stimulatory Step 1). In contrast GsPCRs decrease TCR-stimulated IL-2 transcription, potentially by utilizing both Gαs and Gβγ signaling in cells that have been exposed to at least two days of TCR stimulation (red pathway, Inhibitory Step 2). The inhibitory GsPCR/Gαs/cAMP pathway may involve binding of CREM, which gradually replaces pCREB, to the CRE site of the IL-2 promoter [79] or the formation of NFAT/ICER complexes on NFAT/AP-1 composite sites in the IL-2 promoter [81], leading to repression of transcription (Inhibitory Step 2). Previous studies suggest that cAMP increases stimulated by the TCR are smaller and more transient than those stimulated by GsPCRs, as depicted by the relative sizes of the cAMP symbols, and this may contribute to the opposite effects on IL-2 transcription. Simultaneously, Gβγ may inhibit TCR-stimulated IL-2 transcription [56] by decreasing TCR-stimulated Ca2+ increases through Cav1 channels (Inhibitory Step 2), which are activated by the TCR by an unknown mechanism [72]. Ca2+-calmodulin-activated calcineurin dephosphorylates NFAT, exposing a nuclear localization sequence (NLS) and leading to nuclear translocation.

Similar articles

Cited by

References

    1. Pastan IH, Johnson GS, Anderson WB. Role of cyclic nucleotides in growth control. Annual review of biochemistry. 1975;44:491–522. doi: 10.1146/annurev.bi.44.070175.002423. Epub 1975/01/01. PubMed PMID: 166606. - DOI - PubMed
    1. Dumont JE, Jauniaux JC, Roger PP. The cyclic AMP-mediated stimulation of cell proliferation. Trends Biochem Sci. 1989;14(2):67–71. Epub 1989/02/01. PubMed PMID: 2539663. - PubMed
    1. Faure M, Bourne HR. Differential effects on cAMP on the MAP kinase cascade: evidence for a cAMP-insensitive step that can bypass Raf-1. Mol Biol Cell. 1995;6(8):1025–35. Epub 1995/08/01. PubMed PMID: 7579705; PubMed Central PMCID: PMC301260. - PMC - PubMed
    1. Dugan LL, Kim JS, Zhang Y, Bart RD, Sun Y, Holtzman DM, et al. Differential effects of cAMP in neurons and astrocytes. Role of B-raf. J Biol Chem. 1999;274(36):25842–8. Epub 1999/08/28. PubMed PMID: 10464325. - PubMed
    1. Scott JD, Dessauer CW, Tasken K. Creating order from chaos: cellular regulation by kinase anchoring. Annu Rev Pharmacol Toxicol. 2013;53:187–210. doi: 10.1146/annurev-pharmtox-011112-140204. Epub 2012/10/10. PubMed PMID: 23043438; PubMed Central PMCID: PMC3540170. - DOI - PMC - PubMed

LinkOut - more resources