. 2016 Apr 19;44(4):924-38.
doi: 10.1016/j.immuni.2016.03.012.

Expansion and Activation of CD103(+) Dendritic Cell Progenitors at the Tumor Site Enhances Tumor Responses to Therapeutic PD-L1 and BRAF Inhibition

Affiliations

Expansion and Activation of CD103(+) Dendritic Cell Progenitors at the Tumor Site Enhances Tumor Responses to Therapeutic PD-L1 and BRAF Inhibition

Hélène Salmon et al. Immunity. .

Abstract

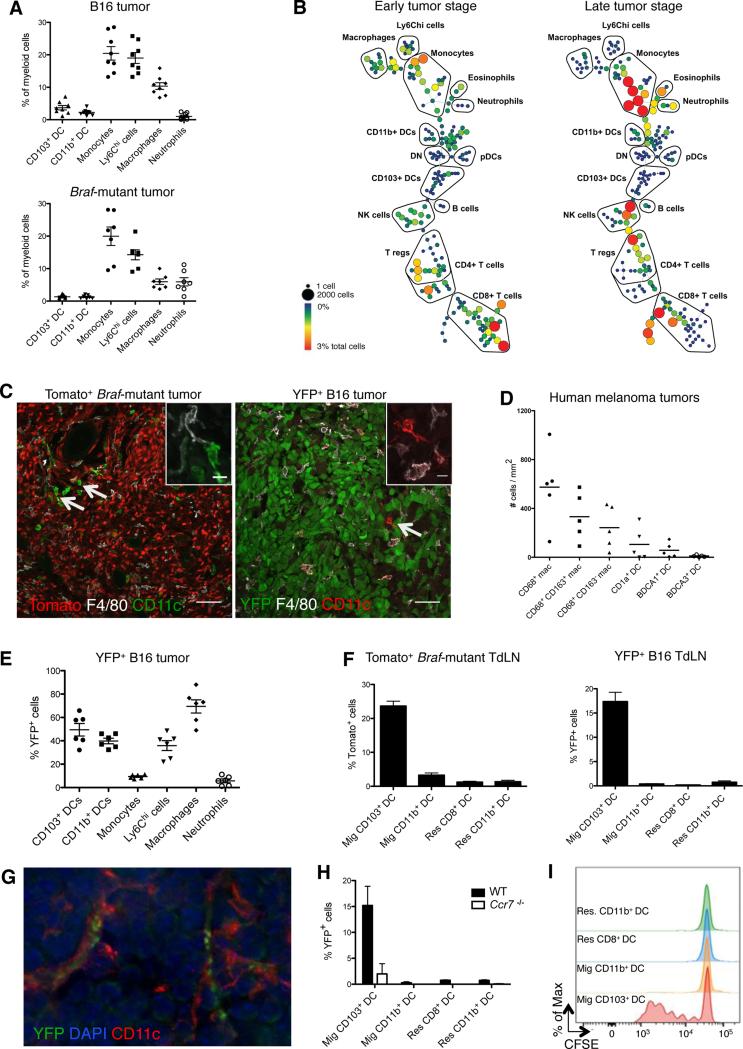
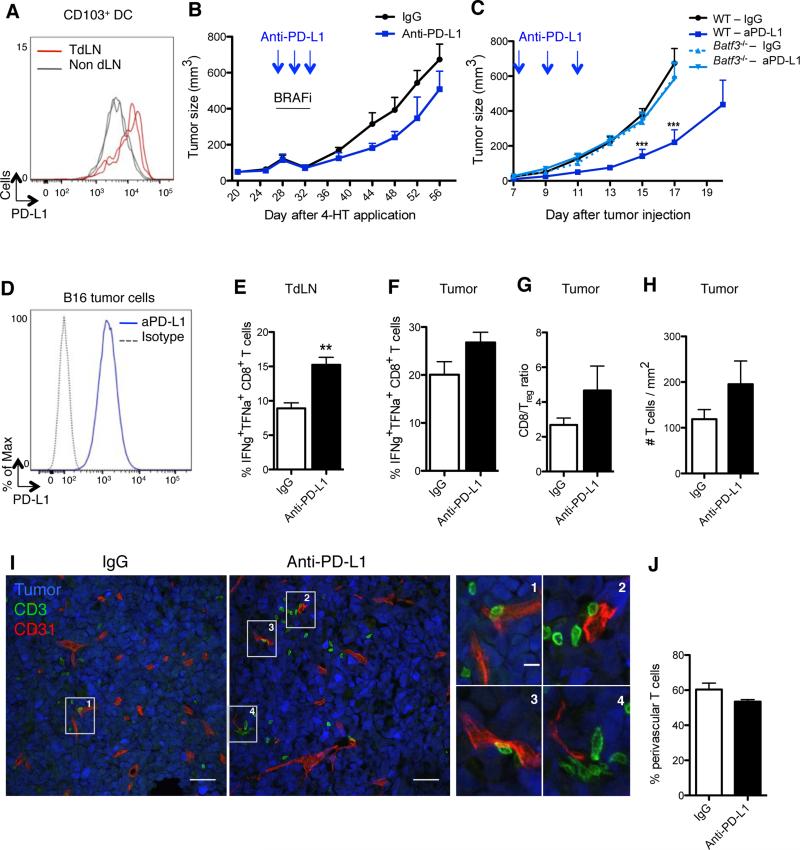
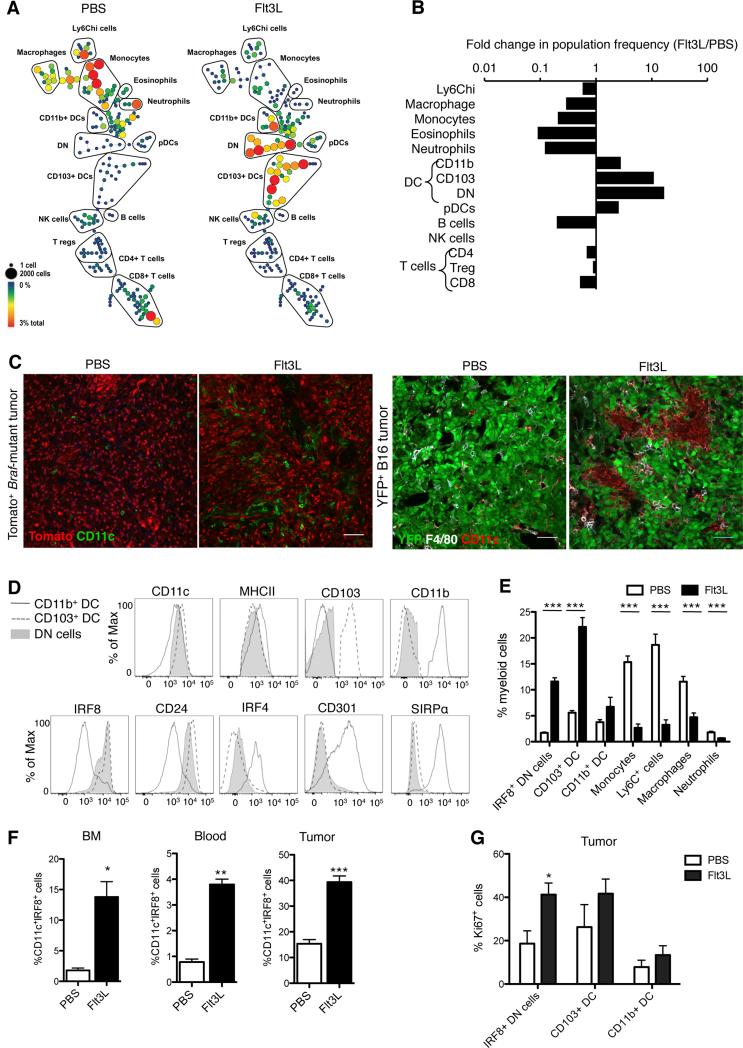
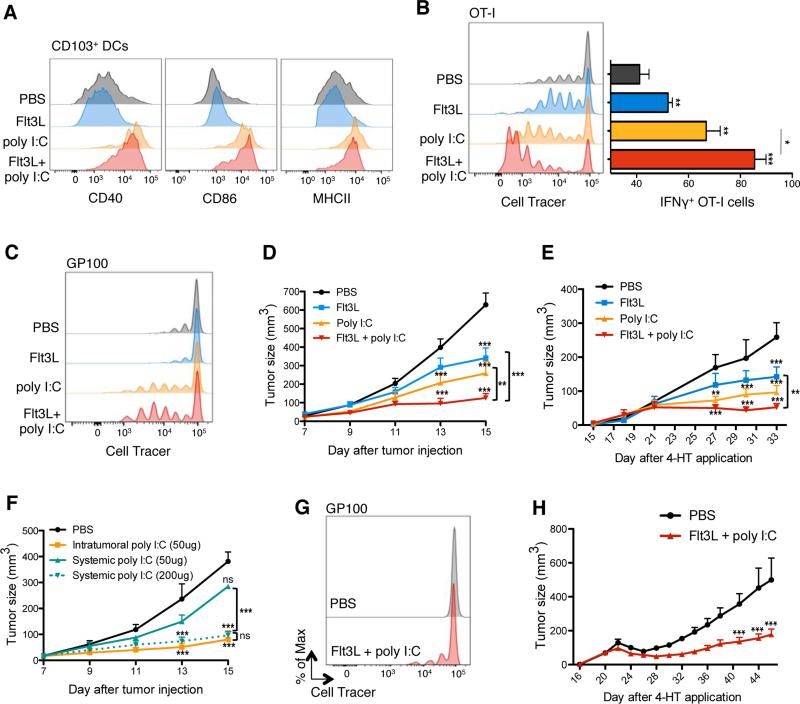
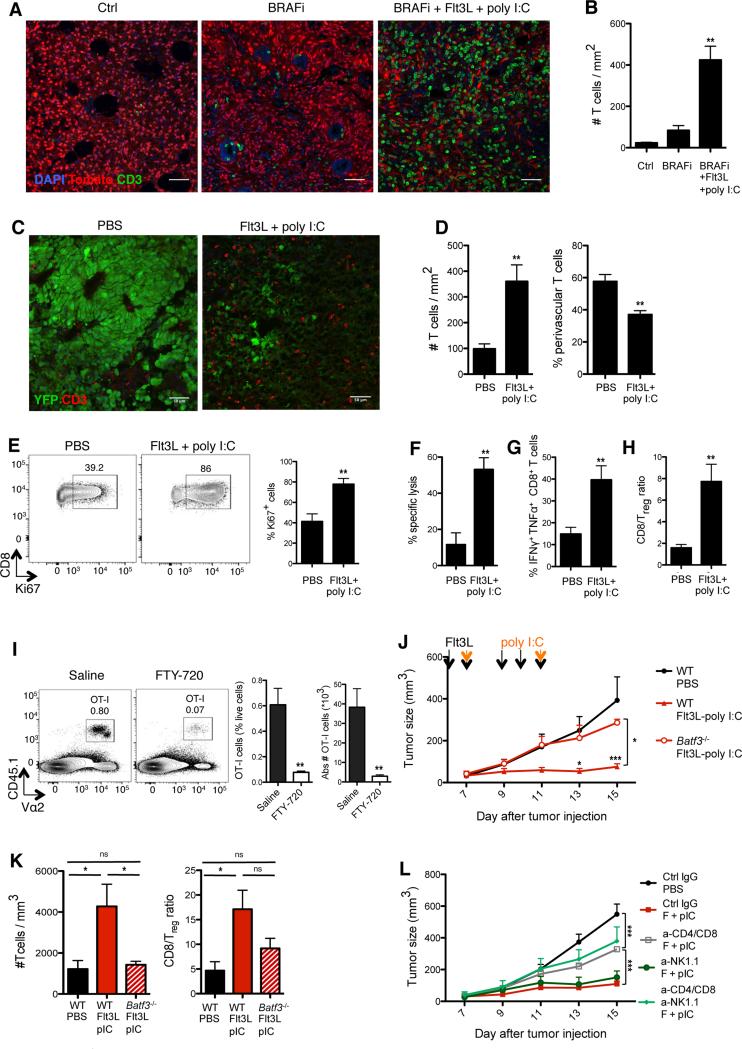
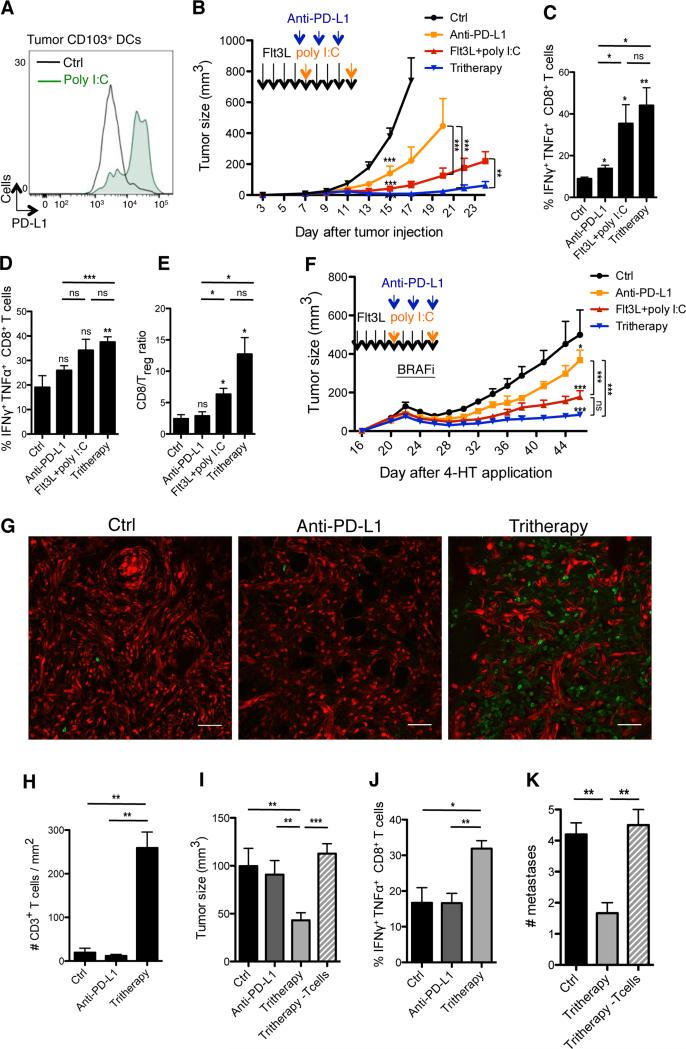
Large numbers of melanoma lesions develop resistance to targeted inhibition of mutant BRAF or fail to respond to checkpoint blockade. We explored whether modulation of intratumoral antigen-presenting cells (APCs) could increase responses to these therapies. Using mouse melanoma models, we found that CD103(+) dendritic cells (DCs) were the only APCs transporting intact antigens to the lymph nodes and priming tumor-specific CD8(+) T cells. CD103(+) DCs were required to promote anti-tumoral effects upon blockade of the checkpoint ligand PD-L1; however, PD-L1 inhibition only led to partial responses. Systemic administration of the growth factor FLT3L followed by intratumoral poly I:C injections expanded and activated CD103(+) DC progenitors in the tumor, enhancing responses to BRAF and PD-L1 blockade and protecting mice from tumor rechallenge. Thus, the paucity of activated CD103(+) DCs in tumors limits checkpoint-blockade efficacy and combined FLT3L and poly I:C therapy can enhance tumor responses to checkpoint and BRAF blockade.


Figures

Figure 1
Figure 1. CD103+ DCs uniquely transport intact antigens to the tumor-draining lymph nodes
B16 and Braf-mutant tumors and LN were analyzed at day 15 and 25, respectively, unless specified otherwise. (A) Frequency of each myeloid cell population among total myeloid cells infiltrating B16 (n=8) and Braf-mutant tumors (n=7). See Figure S1A for gating strategy. Shown is the mean ± SEM of 2-3 independent experiments. (B) CyTOF analysis of tumor-infiltrating immune cells at early (day 10) and late (day 16) stages of B16 tumor growth. Gated live CD45+ cells were clustered using SPADE based on 27 markers. Trees are representative of 2 experiments with similar results. (C) Representative confocal images showing CD11c+ F4/80 DCs and macrophage/monocyte-derived CD11c+/− F4/80+ cells in Tomato+ Braf-mutant and B16-YFP tumors, scale bar: 50μm. The right upper corners show magnification of a DC and a macrophage/monocyte-derived cell, scale bar: 10μm. Arrows show rare tumor-infiltrating DCs. (D) Density of macrophages and DCs infiltrating human melanoma primary tumors (n=5) quantified from tumor sections stained using multiplexed immunohistochemistry (Figure S1D). (E) Frequency of YFP+ cells infiltrating B16-YFP tumors. Shown is the mean ± SEM of 2 independent experiments (n=6). (F) Frequency of Tomato+ and YFP+ cells in skin migratory (CD11c+MHCIIhi) and LN-resident (CD11chiMHCII+) DCs in the LN draining Tomato+ Braf-mutant (left panel, n=9) and B16-YFP tumors (right panel, n=12). Shown are the mean ± SEM of 4 independent experiments. (G) Representative image of a CD11c+ cell harboring YFP+ vesicles in the LN draining B16-YFP tumors. (H) Frequency of YFP+ cells among migratory DCs isolated from the LN draining B16-YFP tumors in WT or Ccr7−/− mice (n=2). (I) Migratory and LN resident DCs were sorted from the LN draining B16-OVA tumors and co-cultured with CFSE-labeled OT-I T cells (DC-T ratio = 1/3). Three days later, the proliferation of OT-I T cells was determined by CFSE dilution. Histograms represent one of two independent experiments with similar results. See also Figure S1.
Figure 2
Figure 2. CD103+ DCs control tumor response to PD-L1 blockade
(A) PD-L1 expression on CD103+ DCs purified from B16 TdLN (red lines) and non-draining LN (grey lines), day 15 after tumor challenge. Representative flow cytometry histogram of 2 experiments. (B) Braf-mutant mice were treated i.p. with either anti-PD-L1 or a control mAb on days 28 (tumor size: 100-150μm3), 30 and 32 after 4-HT topical application. All mice were treated with BRAF inhibitors from day 28 to 32. Shown is mean ± SEM of 2 independent experiments (n= 5-6). (C) B16 tumor-bearing WT or Batf3−/− mice were treated i.p. with either anti-PD-L1 or a control mAb on days 7, 9 and 11 after tumor challenge. Tumor growth was followed for 17-20 days. Shown is the mean ± SEM of 2 independent experiments (n=5-8). (D) PD-L1 expression on cultured B16 tumor cells. (E-J) Mice were inoculated with B16 tumor cells and treated as in (C). (E-F) On day 15 mice were sacrificed and CD8+ T cells from TdLN (E) or tumor (F) were analyzed for the production of IFNγ and TNFα following 3-hr PMA/ionomycin stimulation. Shown is the mean ± SEM of 2 independent experiments (n= 4-5 mice). (G) CD8+ T cell/Treg cell ratio 15 days after tumor challenge is shown as the mean ± SEM of 2 independent experiments (n=4-5). (H) B16-YFP tumors were harvested on day13 (2 days after the last injection of anti-PD-L1 or control mAb) and stained with anti-CD3 mAb. The density of CD3+ T cells infiltrating B16-YFP tumors was automatically quantified with Cell Profiler software from confocal images. Shown is the mean ± SEM of 3 independent experiments (n=4-6). 12-16 tiled 20x images were analyzed per animal. (I) B16-YFP tumors (here in blue) were harvested and frozen on day 13 and stained with for T cells (CD3+, green) and blood vessels (CD31+, red). Panels show confocal images (scale bar: 50μm) representative of 3 experiments with similar results. Right panels show higher magnifications of T cells surrounding vessels (scale bar: 10μm). (J) As in (I), but the percentages of CD3+ T cells found in perivascular areas (≤30μm from a CD31+ vessel) were quantified using Cell Profiler software. Shown is the mean ± SEM of 3 independent experiments (n=4-6). See also Figure S2.
Figure 3
Figure 3. Flt3L injections dramatically expand CD103+ DC progenitors in the bone marrow and promote their accumulation and expansion in the tumor mass
(A) CyTOF analysis of tumor-infiltrating immune cells on day 13 after B16 tumor challenge in mice treated i.p. for 9 consecutive days starting at day 3 post tumor injection with 30μg FL or PBS. SPADE trees were colored by relative population frequency out of total live CD45+ cells. Five mice were pooled to build each SPADE tree. Trees are representative of 2 experiments with similar results. (B) Fold changes in relative frequency of immune cell populations (identified by SPADE clustering performed in A) between FL- and PBS-treated mice. (C) Representative confocal images of DCs infiltrating tomato+ Braf-mutant tumors (red) and B16-YFP tumors (green) treated with 9 daily injections of FL or PBS starting on day 18 after 4-HT topical application (Braf-mutant) or 3 days after tumor challenge (B16). Tumor biopsies were isolated and frozen 30 days (Braf-mutant) and 15 days (B16) after tumor challenge. In Braf-mutant tumors, DCs were identified as CD11c+ cells (green) whereas in B16 tumor DCs were identified as F4/80CD11c+ (red). Scale bar: 50μm. (D) Mice were treated as in A. Histograms show the expression of cell surface markers or transcription factors in CD103+ DCs (dashed line), CD11b+ DCs (grey line) and MHCIIhiCD11c+Ly6CCD64CD103CD11b double negative cells (DN: full grey) infiltrating B16 tumors on day 13 after tumor challenge. Results shown are representative histograms of 2 experiments. (E) Frequency of myeloid cell populations infiltrating B16 tumors in mice treated with FL or PBS as in A. Results shown are the mean ± SEM of 3 independent experiments with a total of 8 mice. (F) Frequency of MHCIIhiCD11c+Ly6CCD64CD103CD11bIRF8+ (IRF8+ DN) cells in bone marrow (BM), blood and tumors of B16 tumor-bearing mice analyzed 2 days after 9 daily injections of FL or PBS. Shown is the mean ± SEM of one experiment (n=5). (G) Frequency of Ki67+ cells among IRF8+ DN cells, CD103+ DCs and CD11b+ DCs infiltrating B16 tumors site analyzed 2 days after 9 daily injections of FL or PBS. Shown is the mean ± SEM of 2 independent experiments (n=4). See also Figure S3.
Figure 4
Figure 4. Combination of Flt3L and in situ TLR3 ligand promotes the regression of B16 and Braf-mutant lesions
(A) Expression of CD40, CD86 and MHCII on tumor-infiltrating CD103+ DCs upon treatment with i.p. FL and/or pIC or PBS as a control (treatment scheme in Figure S4A). Shown are representative histograms of 2 independent experiments. (B) B16-OVA bearing mice were treated with FL and pIC as in (A). At day 11, mice were adoptively transferred with Violet-labeled OT-I T cells, 2 hrs after the last injection of pIC/PBS. TdLN were harvested 3 days after OT-I T cell transfer and proliferation was assessed based on Violet dilution using flow cytometry. Left panels show a representative histogram showing violet cell dilution in gated transferred OT-I T cell. Bar graph (right panel) shows the mean ± SEM IFNγ production by gated OT-I cells after in vitro re-stimulation with ovalbumin257-264 peptide for 4 hrs. (C) B16-tumors bearing mice were treated with FL and pIC as in (A) and adoptively transferred with Violet-labeled gp100-specific T cells. TdLN were harvested 4 days after i.v. injection of gp100-specific T cells and their proliferation was assessed based on Violet dilution using flow cytometry. Shown is a representative histogram of 2 independent experiments. (D) B16 tumor-bearing mice were treated with FL, pIC, FL+pIC or PBS as shown in (A). Graph shows the mean tumor growth ± SEM of 4 independent experiments (n=7-12). (E) Braf-mutant tumor bearing mice were treated as in (A), with FL injections starting on day 15 after 4-HT application. Graphs show the mean tumor growth ± SEM of 2 independent experiments (n=5). (F) B16 tumor-bearing mice were treated with PBS (control) or pIC (50μg or 200μg) intratumorally or i.p.. Graph shows the mean tumor growth ± SEM of 2 independent experiments (n=3-6 mice). (G) Braf-mutant tumor mice were treated as described in Figure S4B. On day 26, 2h after the last injection of pIC/FL/PBS, mice were adoptively transferred with Violet-labeled gp100-specific T cells. TdLN were harvested 4 days after gp100-specific T cell transferred cells and proliferation was assessed through Violet-Cell trace dilution. Shown is a representative histogram of 2 independent experiments. (H) Braf-mutant tumor mice were treated as described in Figure S4B. Graph shows the mean tumor growth ± SEM of 2 independent experiments (n=5-6 mice). See also Figure S4.
Figure 5
Figure 5. Therapeutic immunity induced by Flt3L-poly I:C combined therapy requires CD103+ DCs and type I IFN
(A-B) Tomato+ Braf-mutant tumor mice were treated as described in Figure S4B. Two days after the end of treatment, tumors were harvested and frozen. (A) Representative confocal images of CD3+ T cells (green) infiltrating tumors from the indicated treatment groups. (B) CD3+ T cell density was quantified from confocal images using Cell Profiler software. Shown is the mean ± SEM of 2 independent experiments (n= 3-4;12-16 tiled 20x images were analyzed per animal). (C-D) B16-YFP tumor-bearing mice were treated as described in Figure S4A. Two days after the end of treatment, tumors were harvested and frozen. (C) Shown are representative confocal images of CD3+ T cells (red) infiltrating tumors treated with PBS or FL-pIC. (D) CD3+ T cell density (left) and proportions of perivascular CD3+ T cells (<30um from CD31+ vessels; right) were quantified from confocal images using Cell Profiler software. Shown is the mean ± SEM of 4 independent experiments (n= 4-6; 12-16 tiled 20x images were analyzed per animal). (E-H) B16 tumor-bearing mice were treated as in Figure S4A and tumor-infiltrating T cells were analyzed at day 15, unless specified otherwise. (E) Representative dot plots (left) and quantification (right) of the frequency of tumor-infiltrating CD8+ T cells expressing the cell cycle protein Ki67. Graph shows the mean ± SEM of 2 independent experiments (n= 4). (F) WT splenocytes were incubated in vitro with ovalbumin257-264 peptide and labeled with high concentration of CFSE (CFSEhi) or incubated with control medium and labeled with low CFSE concentration (CFSElow). Same numbers of CFSEhi and CFSElow splenocytes were coinjected into B16 tumor-bearing mice treated with FL+pIC or PBS at day 16 and analyzed 24hrs later. Shown is the mean ± SEM of one experiment (n=4-5). (G) CD8+ T cells were analyzed for IFNγ and TNFα production after PMA/ionomycin stimulation. Shown is the mean ± SEM of 4 independent experiments (n=8). (H) Tumor-infiltrating CD8+ T cell/Treg cell ratio as the mean ± SEM of 4 independent experiments (n=8). (I) Mice bearing B16-OVA tumors received daily FL injections from day 5 to 9 post- tumor challenge followed by one intratumoral injection of pIC at day 9. Two hours after the pIC injection, tumor-bearing mice were injected with 3×10⁶ naïve tumor antigen-specific CD8+ T cells (OT-I) in the presence or absence of the S1P receptor antagonist FTY-720 (from day 9, daily injection as described in the methods). Shown are representative dot plots (left) and quantification of the frequency and absolute numbers of tumor-infiltrating OT-I cells (right) four days after adoptive cell transfer. Graphs show the mean ± SEM of 2 independent experiments (n= 4-5). (J-K) B16 tumors were injected into WT mice or Batf3−/− mice and treated with FL+pIC. Here mice received only 5 injections because CD103+ DCs reappear in Batf3−/− mice upon 9 FL injections. (J) Graph shows the mean tumor growth ± SEM of 2 independent experiments (n= 4-6). (K) B16 tumors were harvested on day 15. Bar graphs show the intratumoral T cell density as measured by flow cytometry (left) and CD8+ cell/Treg cell ratio (right) in Batf3−/− versus WT treated mice. Results are shown as the mean ± SEM of one experiment (n=4-5). (L) B16 tumor-bearing mice treated with FL-pIC with with anti-CD4, anti-CD8, anti-NK1.1 Ab or control IgG as described in the method section. Graph shows the mean tumor growth ± SEM of 2 independent experiments (n=3-9). See also Figure S5.
Figure 6
Figure 6. Flt3L and poly I:C synergize with anti-PD-L1 Ab treatment to enhance anti-tumor responses to BRAF inhibition
(A) B16 tumors were injected with 50μg pIC or PBS, on days 7 and 11. Histograms show PD-L1 expression on tumor-infiltrating CD103+ DCs, 2 days after the last pIC or PBS injection with one representative example for each group. (B) B16 tumor-bearing mice were treated with FL-pIC and injected with anti-PD-L1 mAbs or isotype control on days 7, 9 and 11 and assessed for tumor growth. Graph shows the mean tumor growth ± SEM of 3 independent experiments (n=5-10). (C-E) B16 tumor-bearing mice were treated as in (B). On day 15, mice were sacrificed and CD8+ T cells isolated from the TdLN (C) or tumors (D) were analyzed for the production of IFNγ and TNFα. Shown is the mean ± SEM of 2 independent experiments (n=3-7). (E) Bar graph shows the intratumoral CD8+ cell/Treg cell ratio as the mean ± SEM of 2 independent experiments (n=3-7). (F) Braf-mutant tumor-bearing mice were treated as indicated by the arrows. In addition to FL-pIC±anti-PD-L1 Ab therapy (or PBS and rat IgG as a control), all mice were treated with BRAF inhibitors (BRAFi) admixed chow for 4 days from day 22 to 26. Graph shows the mean tumor growth ± SEM of 2 independent experiments (n= 6-12). (G-H) Tomato+ Braf-mutant tumor bearing mice were treated with the tritherapy, anti-PD-L1 Ab alone or PBS/IgG alone and re-challenged 4 weeks later with 4-HT on the other flank, as described in Figure S6A. (G) Representative confocal images of CD3+ T cells (green) infiltrating the re-challenged tumor. (H) T cell density quantified by histology using Cell Profiler software. Shown is the mean ± SEM of 2 independent experiments (n=3). (I-J) Braf-mutant tumor and TdLN analyses were performed 4 weeks after the tumor re-challenge, as in (G). (I) Volume of the re-challenged tumors. (J) Proportions of CD8+ T in the LN draining the re-challenged tumor producing IFNγ and TNFα after PMA-ionomycin stimulation. Shown is the mean ± SEM of 2 independent experiments (n=5). (K) Mice were treated as in Figure S6A and the number of skin tumors was assessed a month after the end of treatment. Bar graph shows the mean number of skin tumors ± SEM of 2 independent experiments (n=5-6). See also Figure S6.

Comment in

Similar articles

Cited by

References

    1. Bogunovic D, Manches O, Godefroy E, Yewdall A, Gallois A, Salazar AM, Marie I, Levy DE, Bhardwaj N. TLR4 engagement during TLR3-induced proinflammatory signaling in dendritic cells promotes IL-10-mediated suppression of antitumor immunity. Cancer research. 2011;71:5467–5476. - PMC - PubMed
    1. Bogunovic D, O'Neill DW, Belitskaya-Levy I, Vacic V, Yu YL, Adams S, Darvishian F, Berman R, Shapiro R, Pavlick AC, et al. Immune profile and mitotic index of metastatic melanoma lesions enhance clinical staging in predicting patient survival. Proceedings of the National Academy of Sciences of the United States of America. 2009;106:20429–20434. - PMC - PubMed
    1. Broz ML, Binnewies M, Boldajipour B, Nelson AE, Pollack JL, Erle DJ, Barczak A, Rosenblum MD, Daud A, Barber DL, et al. Dissecting the tumor myeloid compartment reveals rare activating antigen-presenting cells critical for T cell immunity. Cancer cell. 2014;26:638–652. - PMC - PubMed
    1. Chen DS, Mellman I. Oncology meets immunology: the cancer-immunity cycle. Immunity. 2013;39:1–10. - PubMed
    1. Cooper ZA, Juneja VR, Sage PT, Frederick DT, Piris A, Mitra D, Lo JA, Hodi FS, Freeman GJ, Bosenberg MW, et al. Response to BRAF inhibition in melanoma is enhanced when combined with immune checkpoint blockade. Cancer immunology research. 2014;2:643–654. - PMC - PubMed

Publication types

MeSH terms