. 2016 May 5;533(7601):115-9.
doi: 10.1038/nature17950. Epub 2016 Apr 20.

Noncanonical autophagy inhibits the autoinflammatory, lupus-like response to dying cells

Affiliations

Noncanonical autophagy inhibits the autoinflammatory, lupus-like response to dying cells

Jennifer Martinez et al. Nature. .

Erratum in

Retraction in

Abstract

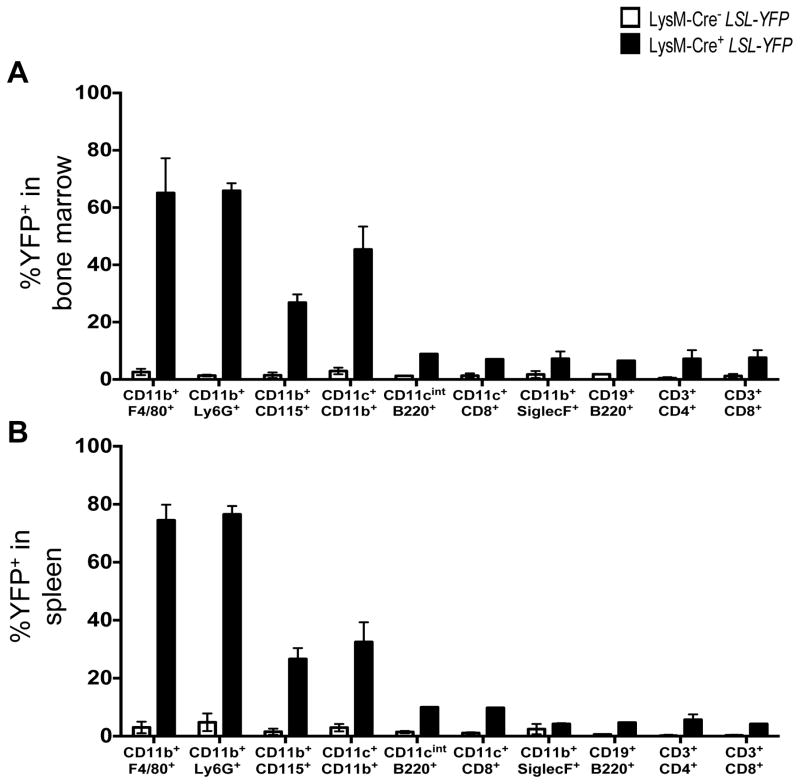
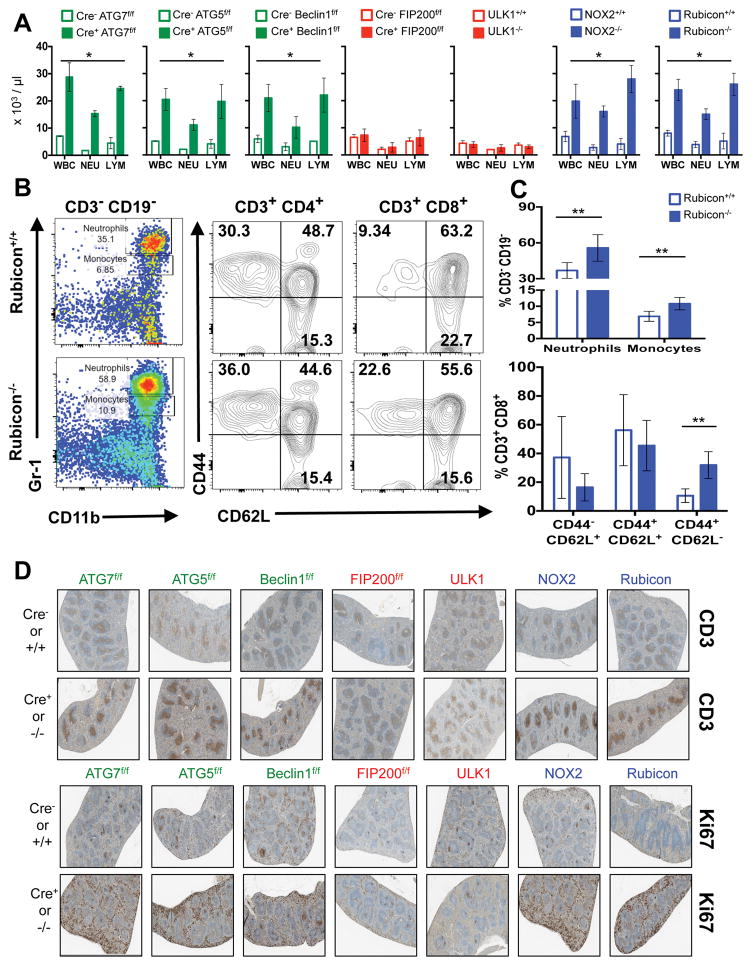
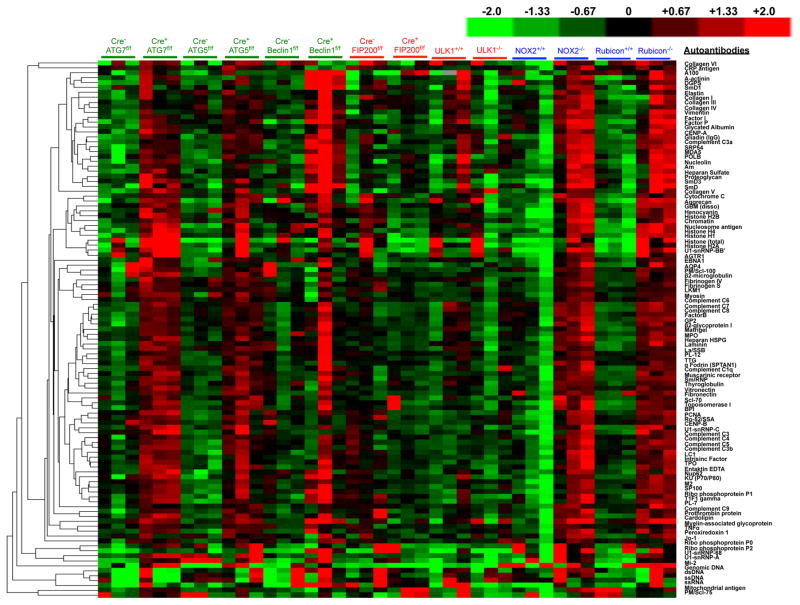
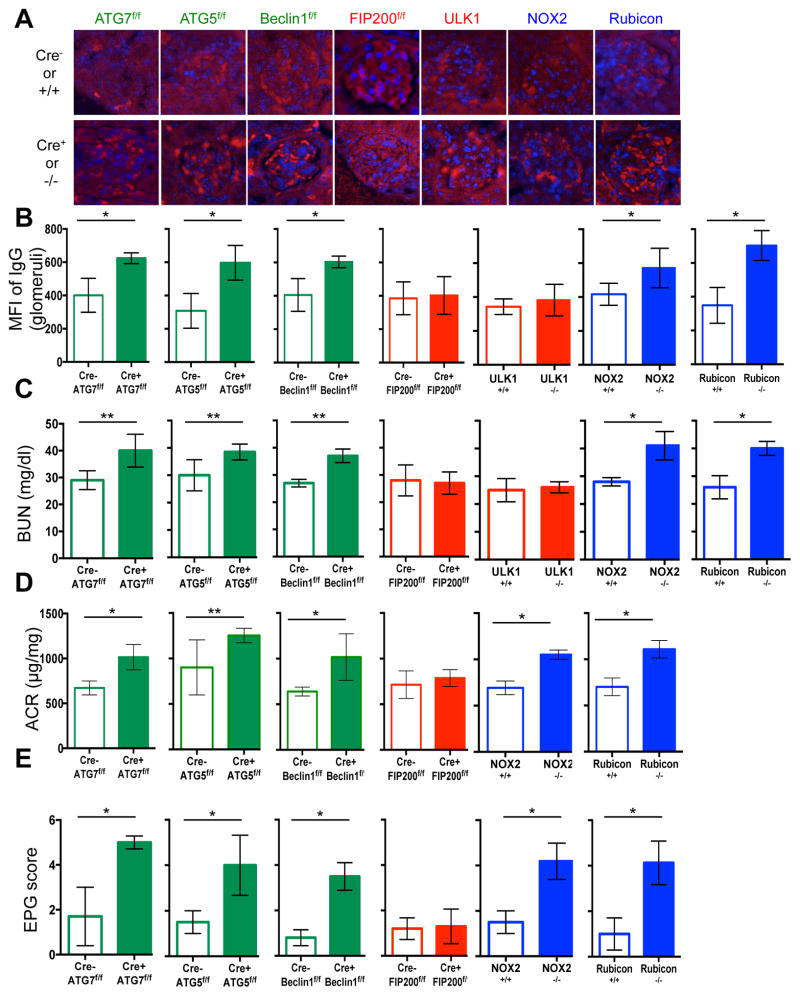
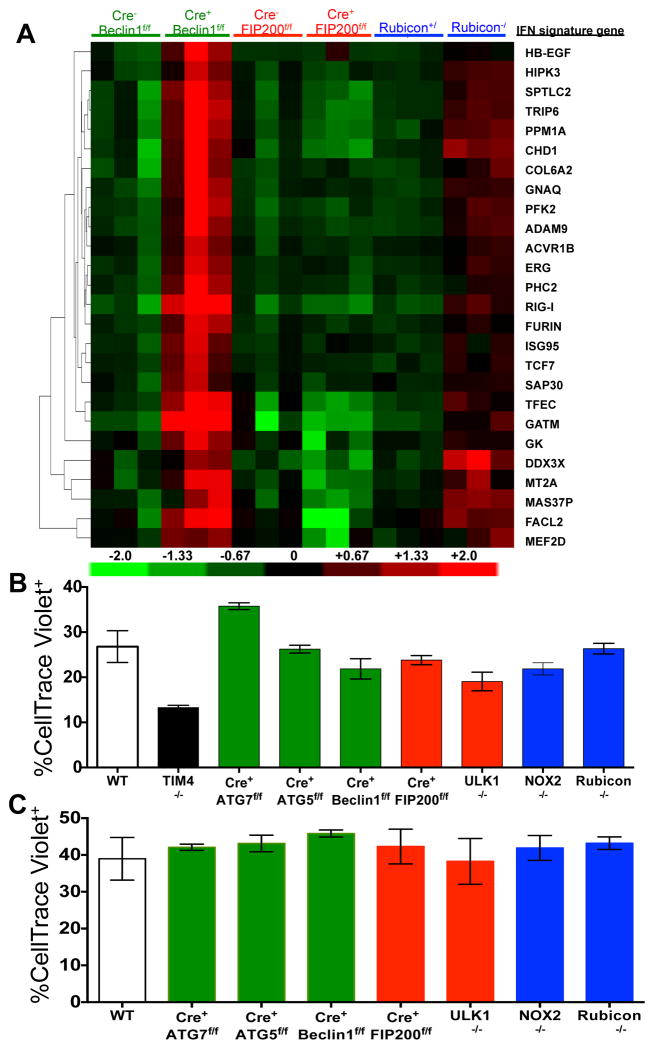
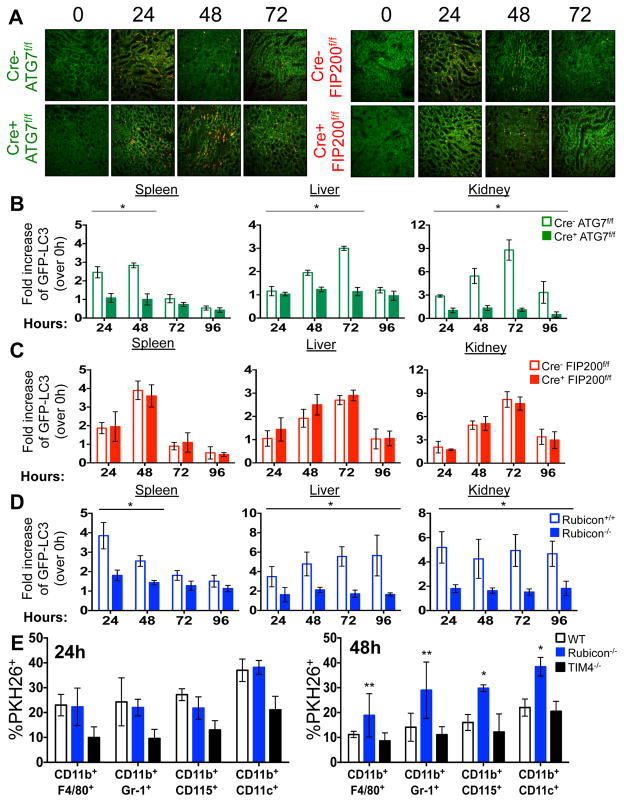
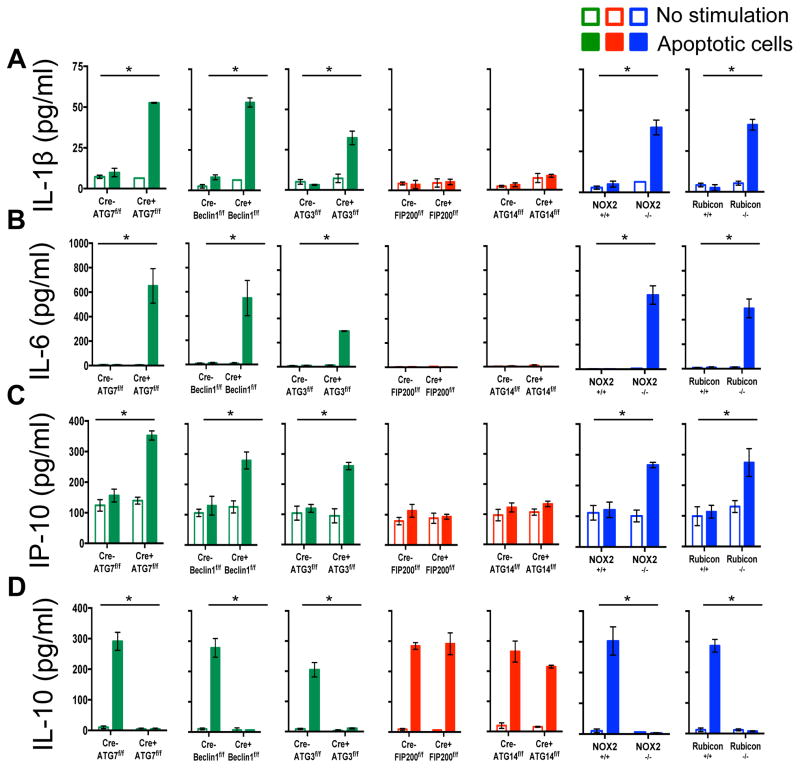
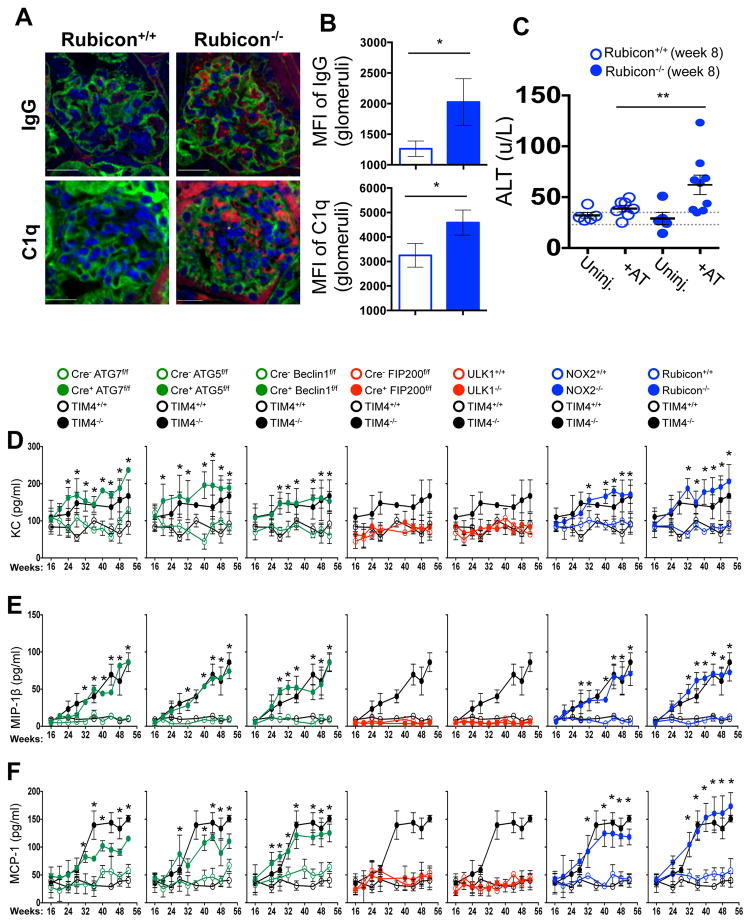
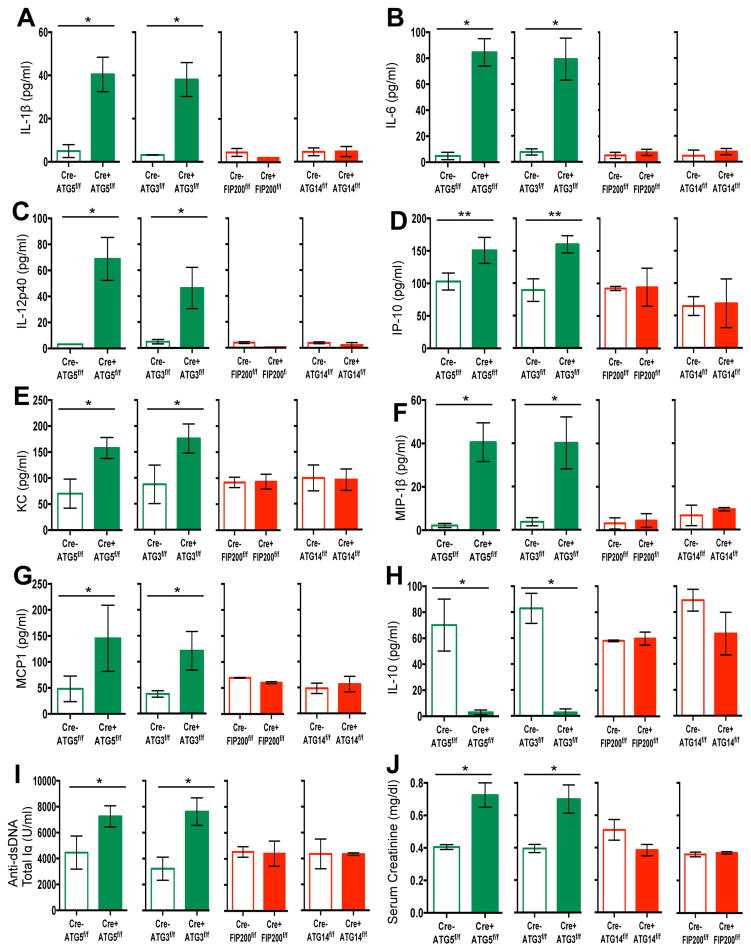
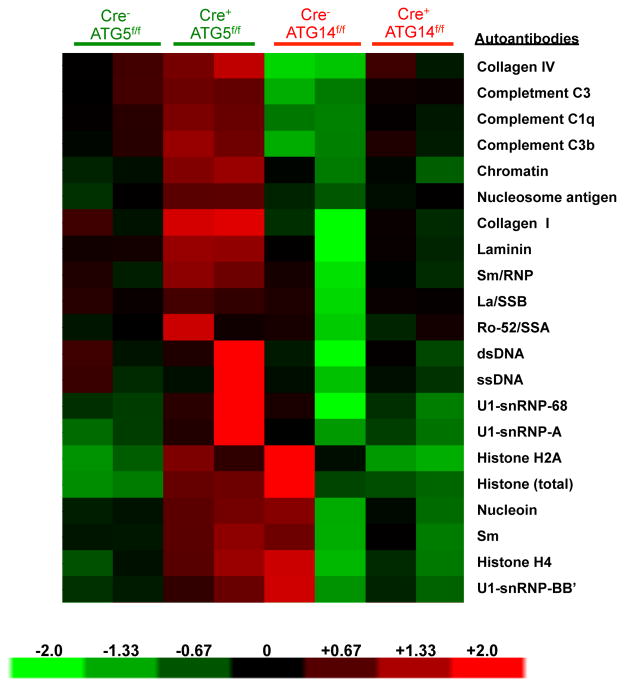
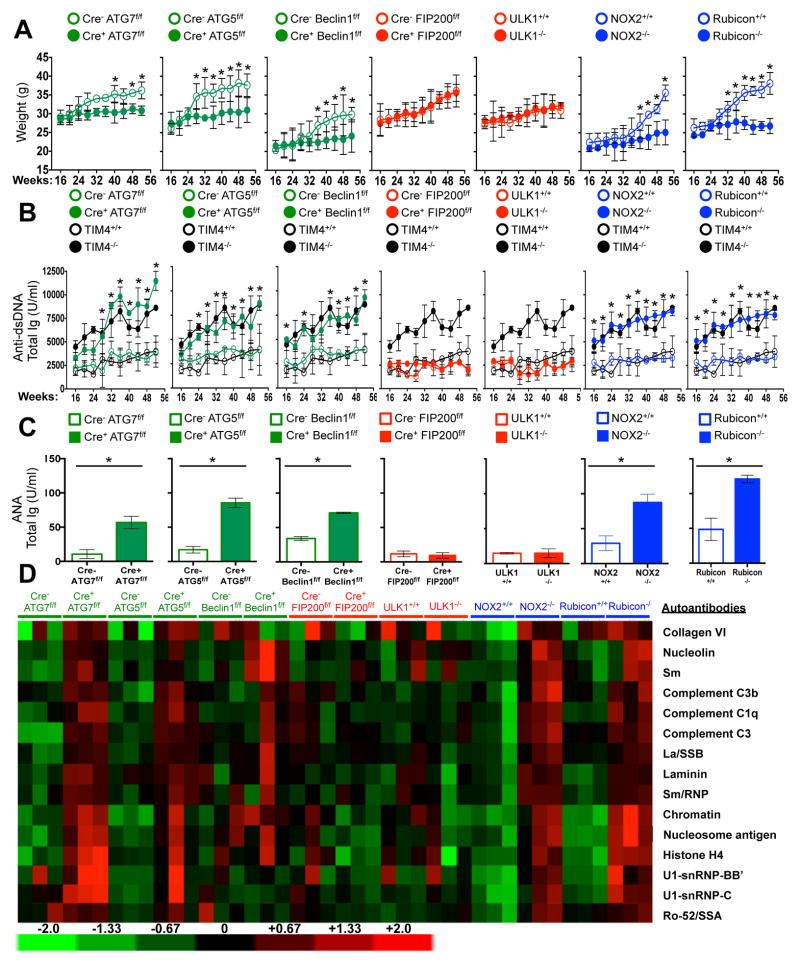
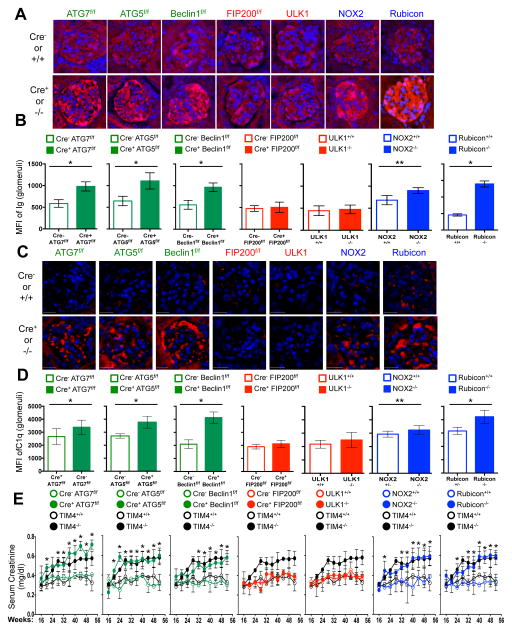
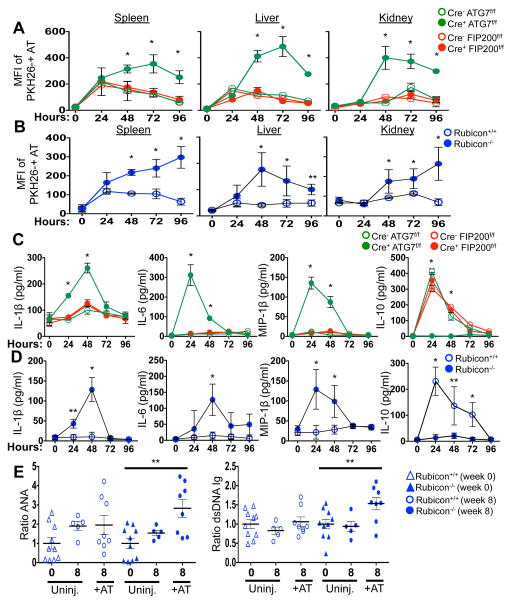
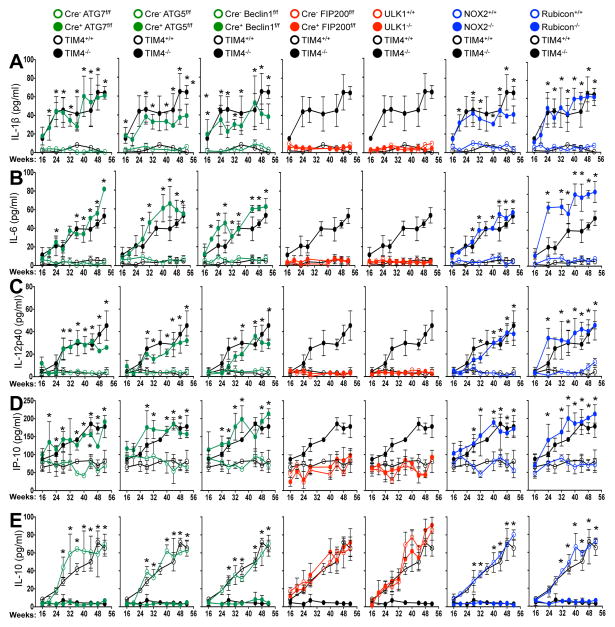
Defects in clearance of dying cells have been proposed to underlie the pathogenesis of systemic lupus erythematosus (SLE). Mice lacking molecules associated with dying cell clearance develop SLE-like disease, and phagocytes from patients with SLE often display defective clearance and increased inflammatory cytokine production when exposed to dying cells in vitro. Previously, we and others described a form of noncanonical autophagy known as LC3-associated phagocytosis (LAP), in which phagosomes containing engulfed particles, including dying cells, recruit elements of the autophagy pathway to facilitate maturation of phagosomes and digestion of their contents. Genome-wide association studies have identified polymorphisms in the Atg5 (ref. 8) and possibly Atg7 (ref. 9) genes, involved in both canonical autophagy and LAP, as markers of a predisposition for SLE. Here we describe the consequences of defective LAP in vivo. Mice lacking any of several components of the LAP pathway show increased serum levels of inflammatory cytokines and autoantibodies, glomerular immune complex deposition, and evidence of kidney damage. When dying cells are injected into LAP-deficient mice, they are engulfed but not efficiently degraded and trigger acute elevation of pro-inflammatory cytokines but not anti-inflammatory interleukin (IL)-10. Repeated injection of dying cells into LAP-deficient, but not LAP-sufficient, mice accelerated the development of SLE-like disease, including increased serum levels of autoantibodies. By contrast, mice deficient in genes required for canonical autophagy but not LAP do not display defective dying cell clearance, inflammatory cytokine production, or SLE-like disease, and, like wild-type mice, produce IL-10 in response to dying cells. Therefore, defects in LAP, rather than canonical autophagy, can cause SLE-like phenomena, and may contribute to the pathogenesis of SLE.


Conflict of interest statement

The authors declare no competing financial interests.

Figures

Extended Data Figure 1
Extended Data Figure 1. LysM-Cre recombinase activity in vivo
A–B. Bone marrow (A) and spleen (B) were harvested from WT and LysM-Cre+ LSL-YFP reporter mice (R26-stop-EYFP) at 8 weeks of age and flow cytometry was performed to examine expression of YFP in the following cellular populations: macrophages (CD11b+ F4/80+), neutrophils (CD11b+ Ly6G+), monocytes (CD11b+ CD115+), conventional dendritic cells (CD11b+ CD11c+), plasmacytoid dendritic cells (CD11cint B220+), CD8α+ dendritic cells (CD11c+ CD8α+), eosinophils (CD11b+ SiglecF+), B cells (CD19+ B220+), CD4+ T cells (CD3+ CD4+), and CD8+ T cells (CD3+ CD8+). Error bars represent standard deviation (n=4).
Extended Data Figure 2
Extended Data Figure 2. Mice with LAP deficiencies display symptoms of immune activation
A. Wild-type and deficient littermates were co-housed and aged for 52 weeks at St. Jude Children’s Research Hospital (SJCRH). Whole blood was collected at 52 weeks and analyzed for differential blood count. Error bars represent standard deviation. B–C. Peripheral blood from Rubicon+/+ and Rubicon−/− animals aged 52 weeks was analyzed for immune cell population. Neutrophils (Singlets/CD3 CD19/Gr-1hi CD11b+), monocytes (Singlets/CD3 CD19/Gr-1int CD11b+), activated T cells (Singlets/CD3+ CD4+/CD44+ CD62L and Singlets/CD3+ CD8+/CD44+ CD62L), and central memory T cells (Singlets/CD3+ CD4+/CD44+ CD62L+ and Singlets/CD3+ CD8+/CD44+ CD62L+) were analyzed and quantified. Error bars represent standard deviation (n=5, **p < 0.05). D. Spleens from wild-type and deficient littermates aged for 52 weeks were stained for anti-CD3 (top) or Ki67 (bottom) using immunohistochemistry. Representative images are shown (n=4/genotype). In all cases, Cre indicates LysM-Cre. Error bars represent standard deviation. The color scheme throughout represents LAP-deficient, autophagy-deficient genotypes (green), autophagy-deficient, LAP-sufficient (red), and autophagy-sufficient, LAP-deficient (blue).
Extended Data Figure 3
Extended Data Figure 3. Mice with LAP deficiencies display increased levels of circulating autoantibodies
Serum from animals aged 52 weeks at St. Jude Children’s Research Hospital (SJCRH) was analyzed for autoantigens commonly associated with autoimmune and autoinflammatory disorders. The background subtracted signal intensity of each autoantigen was normalized to the average intensity of the total mouse IgG, which was included on the array as an internal control. IgG autoantibodies are shown, in triplicates per genotype.
Extended Data Figure 4
Extended Data Figure 4. Mice with LAP deficiencies display kidney pathology
Wild-type and deficient littermates were co-housed and aged for 52 weeks at St. Jude Children’s Research Hospital (SJCRH). At 32 weeks, kidneys were harvested and stained for anti-IgG (red) and DAPI (blue) (A). Mean fluorescent intensity (MFI) of anti-IgG staining in the glomeruli was calculated using Slidebook6 software (B). Error bars represent standard deviation. (n>15 glomeruli/genotype, *p < 0.001). C. At 52 weeks, serum was collected and analyzed for blood urea nitrogen (BUN). D. At 52 weeks, urine was collected, and proteinuria was calculated as the ratio of albumin to creatinine (ACR). Error bars represent standard deviation. (n>4/genotype, *p < 0.001, **p < 0.05). E. At 52 weeks, kidneys were harvested and stained for haematoxylin and eosin (H&E). Kidneys were scored blindly for endocapillary proliferative glomerulonephritis (EPG) on a scale of 1 (no damage) to 5 (clear damage). For histological assessment, at least 24 glomeruli were evaluated for each genotype. Error bars represent standard deviation (*p < 0.001).
Extended Data Figure 5
Extended Data Figure 5. Mice with LAP deficiencies display increased expression of the IFN signature but normal phagocytic capacity
A. Wild-type and deficient littermates were co-housed and aged for 52 weeks at St. Jude Children’s Research Hospital (SJCRH). RNA was extracted from 52 week old spleens and analyzed for expression of genes associated with the IFN signature using Nanostring technology. Heat map of Nanostring counts from the top 26 regulated genes in the IFN signature are shown in triplicate per genotype. B. UV-irradiated wild-type thymocytes were stained with CellTrace Violet and co-cultured (5:1) with bone marrow-derived macrophages from wild-type and deficient genotypes for 45 minutes. Percent phagocytosis (% Cell Trace Violet) was quantified by flow cytometry (Singlets/GFP+ Cell Trace Violet+). C. Wild-type and deficient littermates were co-housed and aged for 52 weeks at St. Jude Children’s Research Hospital (SJCRH). Peritoneal macrophages were isolated after 3 days of intra-peritoneal injection of thioglycolate. UV-irradiated wild-type thymocytes were stained with CellTrace Violet and co-cultured (2:1) with peritoneal macrophages from wild-type and deficient genotypes for 1 hour. Phagocytic efficiency (Singlets/Cell Trace Violet+/F4/80+) was quantified by flow cytometry (% Cell Trace Violet). Error bars represent standard deviation. Data shown is representative of two independent experiments.
Extended Data Figure 6
Extended Data Figure 6. Mice with LAP deficiencies display defective clearance of engulfed, dying cells
A. 1×10⁷, PKH26-labeled UV-irradiated wild-type thymocytes were injected intravenously into Cre ATG7flox/flox, Cre+ ATG7flox/flox, Cre FIP200flox/flox, or Cre+ FIP200flox/flox animals (all GFP-LC3+). Presence of labeled, apoptotic thymocytes was measured in kidney sections at 0, 24, 48, 72, and 96 hours after transfer. Red cells are PKH26-labeled apoptotic thymocytes, and the kidney tissue is GFP-LC3. Representative images from two independent experiments are shown. B–D. Co-localization of lipidated GFP-LC3-II with engulfed dead cells was analyzed by flow cytometry using digitonin treatment of spleen, liver, and kidney of Cre and Cre+ ATG7flox/flox mice (B), Cre and Cre+ FIP200flox/flox mice (C), and Rubicon+/+ and Rubicon−/− mice (D) at the indicated time points. E. 1×10⁷, PKH26-labeled UV-irradiated wild-type thymocytes were injected intravenously into WT, Rubicon−/−, or TIM4−/− animals. After 24 and 48 hours, spleens were harvested and stained with fluorescently conjugated surface markers for macrophages (CD11b+ F4/80+), neutrophils (CD11b+ Gr-1+), monocytes (CD11b+ CD115+), and dendritic cells (CD11b+ CD11c+). Phagocytic efficiency of each cell type (Singlets/cell surface markers+/PKH26+) was quantified by flow cytometry (% PKH26). Data shown is representative of two independent experiments. Error bars represent standard deviation (**p < 0.05, *p < 0.001). In all cases, Cre indicates LysM-Cre. The color scheme represents LAP-deficient, autophagy-deficient genotypes (green), autophagy-deficient, LAP-sufficient (red), autophagy-sufficient, LAP-deficient (blue), and TIM4+/+ and TIM4−/− (black).
Extended Data Figure 7
Extended Data Figure 7. LAP is required for the anti-inflammatory response to apoptotic cell engulfment in vitro
A–D. UV-irradiated wild-type thymocytes were co-cultured with bone marrow-derived macrophages from wild-type and deficient genotypes. Supernatant was collected at 24 hours and analyzed for IL-1β (A), IL-6 (B), IP-10 (C), and IL-10 (D) using Luminex technology. In all cases, Cre indicates LysM-Cre. Error bars represent standard deviation (n=4, *p < 0.001). The color scheme represents LAP-deficient, autophagy-deficient genotypes (green), autophagy-deficient, LAP-sufficient (red), autophagy-sufficient, and LAP-deficient (blue).
Extended Data Figure 8
Extended Data Figure 8. Mice with LAP deficiencies display symptoms of an autoinflammatory disorder
A–C. 2×10⁷, UV-irradiated wild-type thymocytes were injected intravenously for 8 consecutive weeks into Rubicon+/+ or Rubicon−/− animals (aged 6 weeks). After 8 weeks, kidneys were harvested and stained with DAPI (blue), wheat germ agglutinin (green), anti-IgG (red, top) and anti-C1q (red, bottom) (A). Mean fluorescent intensity (MFI) of anti-IgG (top) and anti-C1q (bottom) staining in the glomeruli was calculated using Slidebook6 software (B). Error bars represent standard deviation. (n>15 glomeruli/genotype, *p < 0.001). After 8 weeks (Week 8), serum was collected from uninjected (Uninj.) and injected (+AT) animals (all 16 weeks of age) and analyzed for alanine aminotransferase (ALT). Dots represent values from individual animals (C). Error bars represent standard error of measurement (**p < 0.05). D–F. Wild-type and deficient littermates were co-housed and aged for 52 weeks at St. Jude Children’s Research Hospital (SJCRH). Serum was collected every 4 weeks and analyzed for KC (D), MIP-1β (E), and MCP1 (F) using Luminex technology. In all cases, Cre indicates LysM-Cre. Error bars represent standard deviation. The color scheme throughout represents LAP-deficient, autophagy-deficient genotypes (green), autophagy-deficient, LAP-sufficient (red), and autophagy-sufficient, LAP-deficient (blue). Values for one cohort of TIM4+/+ and TIM4−/− animals are shown for comparison in all cases (black) in A–C.
Extended Data Figure 9
Extended Data Figure 9. Mice with LAP deficiencies display symptoms of an autoinflammatory disorder
Wild-type and deficient littermates were co-housed and aged for 52 weeks at Washington University (WU). Serum was collected at 48–52 weeks and analyzed for IL-1β (A), IL-6 (B), IL-12p40 (C), IP-10 (D), KC (E), MIP-1β (F), MCP1 (G), and IL-10 (H) using Luminex technology. Serum was analyzed for anti-dsDNA antibodies (Total Ig, I) and creatinine (J). In all cases, Cre indicates LysM-Cre. Error bars represent standard deviation (**p < 0.001). The color scheme throughout represents LAP-deficient, autophagy-deficient genotypes (green) and autophagy-deficient, LAP-sufficient (red).
Extended Data Figure 10
Extended Data Figure 10. Mice with LAP deficiencies display increased levels of circulating autoantibodies
Serum from animals aged 52 weeks at Washington University (WU) was analyzed for autoantigens commonly associated with autoimmune and autoinflammatory disorders. IgG autoantibodies are shown, in duplicates per genotype.
Figure 1
Figure 1. Mice with LAP deficiencies display symptoms of autoinflammatory disorder
Wild-type and deficient littermates were co-housed and aged for 52 weeks at St. Jude Children’s Research Hospital (SJCRH). A. Weights.. B. Anti-dsDNA antibodies (Total Ig). C–D. Antinuclear antigens (ANA, Total Ig) in animals aged 52 wks, C). Antibodies to autoantigens commonly associated with autoimmune and autoinflammatory disorders. 3 mice per genotype, normalized background signals (D). In all cases, Cre indicates LysM-Cre. Error bars represent standard deviation (*p < 0.001). Animal numbers are provided in Supplemental Methods. Color scheme represents LAP-deficient, autophagy-deficient genotypes (green), autophagy-deficient, LAP-sufficient (red), and autophagy-sufficient, LAP-deficient (blue). Values for one cohort of TIM4+/+ and TIM4−/− animals are shown for comparison in all cases (black) in A and B.
Figure 2
Figure 2. Mice with LAP deficiencies display kidney pathology
A–D. Appearance of kidneys of co-housed, 52 wk. animals. DAPI (blue), anti-IgG (red, A), anti-C1q (red, C). Mean fluorescent intensity (MFI) of anti-IgG (B) and anti-C1q (D) in glomeruli E. Serum creatinine. Animal numbers are provided in Supplemental Methods. Error bars represent standard deviation (*p < 0.001, **p < 0.05). For histological assessment, at least 15 glomeruli were evaluated for each genotype. Color scheme represents LAP-deficient, autophagy-deficient genotypes (green), autophagy-deficient, LAP-sufficient (red), and autophagy-sufficient, LAP-deficient (blue). Values for one cohort of TIM4+/+ and TIM4−/− animals are shown for comparison in all cases (black) in E.
Figure 3
Figure 3. Mice with LAP deficiencies display defective clearance of engulfed, dying cells, resulting in increased production of pro-inflammatory cytokines
A–D. 1×10⁷, PKH26-labeled UV-irradiated wild-type thymocytes were injected intravenously into indicated animals expressing GFP-LC3. (A, B) Apoptotic thymocytes in spleen, liver, and kidney of indicated animals measured by flow cytometry. (C, D) Indicated serum cytokines. Error bars represent standard deviation (n=4, *p < 0.001, **p < 0.05). E. 2×10⁷, UV-irradiated wild-type thymocytes were injected intravenously six times over 8 weeks into indicated animals (aged 6 weeks). Serum anti-nuclear antibodies (ANA, Total Ig) and anti-dsDNA antibodies (Total Ig) are shown at 16 wks. Results are presented as ratio to average value prior to injection for each individual animal. Error bars represent standard error (n=4, **p < 0.05). Cre indicates LysM-Cre. The color scheme represents LAP-deficient, autophagy-deficient genotypes (green), autophagy-deficient, LAP-sufficient (red), and autophagy-sufficient, LAP-deficient (blue).
Figure 4
Figure 4. Mice with LAP deficiencies display symptoms of an autoinflammatory disorder
(A–E). Indicated serum cytokines in co-housed 52 wk old animals. In all cases, Cre indicates LysM-Cre. Error bars represent standard deviation (*p < 0.001). Numbers of animals are provided in Supplemental Methods. Color scheme represents LAP-deficient, autophagy-deficient genotypes (green), autophagy-deficient, LAP-sufficient (red), and autophagy-sufficient, LAP-deficient (blue). Values for one cohort of TIM4+/+ and TIM4−/− animals are shown for comparison in all cases (black) in A–E.

Comment in

References

    1. Ravichandran KS. Find-me and eat-me signals in apoptotic cell clearance: progress and conundrums. The Journal of experimental medicine. 2010;207:1807–1817. doi: 10.1084/jem.20101157. - DOI - PMC - PubMed
    1. Rodriguez-Manzanet R, et al. T and B cell hyperactivity and autoimmunity associated with niche-specific defects in apoptotic body clearance in TIM-4-deficient mice. Proceedings of the National Academy of Sciences of the United States of America. 2010;107:8706–8711. doi: 10.1073/pnas.0910359107. - DOI - PMC - PubMed
    1. Kim JY, et al. Noncanonical autophagy promotes the visual cycle. Cell. 2013;154:365–376. doi: 10.1016/j.cell.2013.06.012. - DOI - PMC - PubMed
    1. Martinez J, et al. Microtubule-associated protein 1 light chain 3 alpha (LC3)-associated phagocytosis is required for the efficient clearance of dead cells. Proceedings of the National Academy of Sciences of the United States of America. 2011;108:17396–17401. doi: 10.1073/pnas.1113421108. - DOI - PMC - PubMed
    1. Martinez JM, RK, Lu Q, Cunha LD, Pelletier S, Gingras S, Orchard R, Guan JL, Tan H, Peng J, Kanneganti TD, Virgin HW, Green DR. Molecular characterization of LC3-assMolecular characterization of LC3-associated phagocytosis (LAP) reveals distinct roles for Rubicon, NOX2, and autophagy proteins. Nature cell biology. 2015 - PMC - PubMed

Publication types

MeSH terms