. 2016 Apr 20;12(4):e1004874.
doi: 10.1371/journal.pcbi.1004874. eCollection 2016 Apr.

A Computational Model of the Rainbow Trout Hypothalamus-Pituitary-Ovary-Liver Axis

Affiliations

A Computational Model of the Rainbow Trout Hypothalamus-Pituitary-Ovary-Liver Axis

Kendall Gillies et al. PLoS Comput Biol. .

Abstract

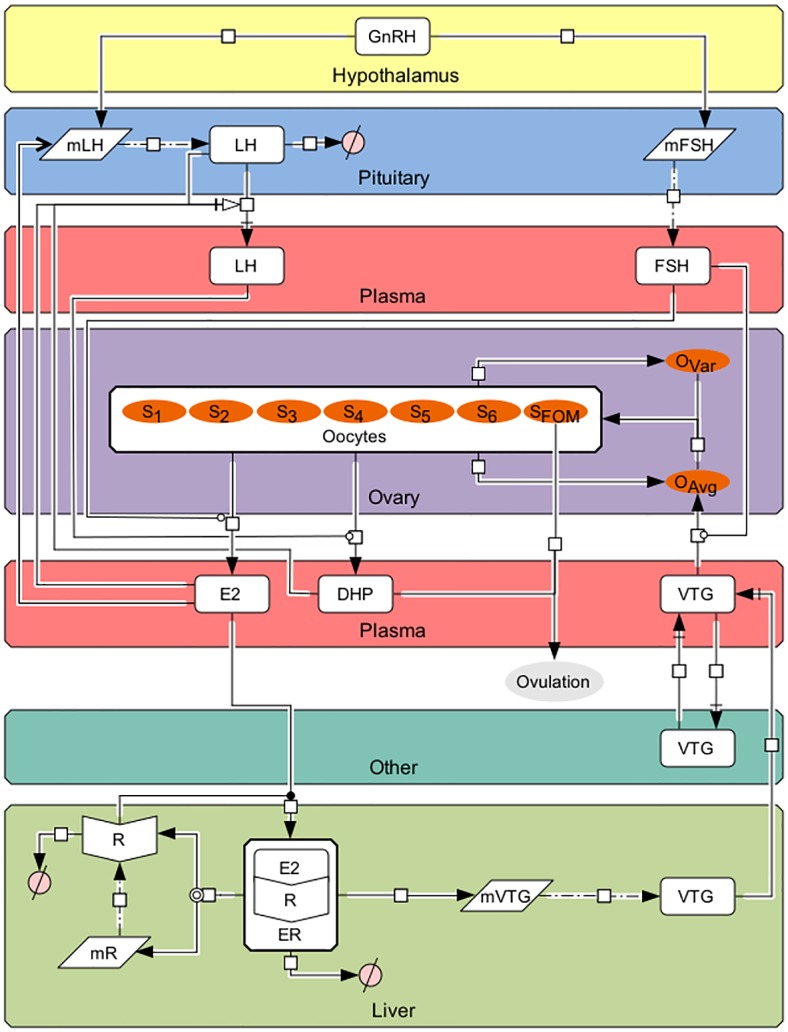
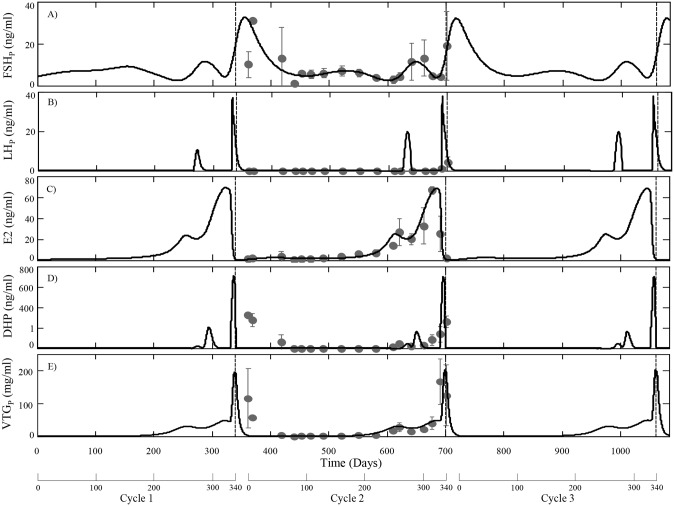
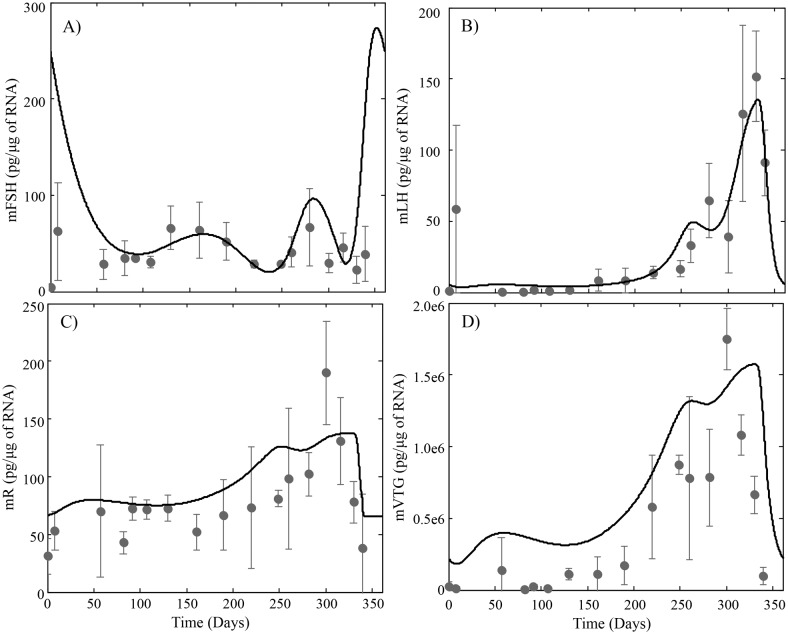
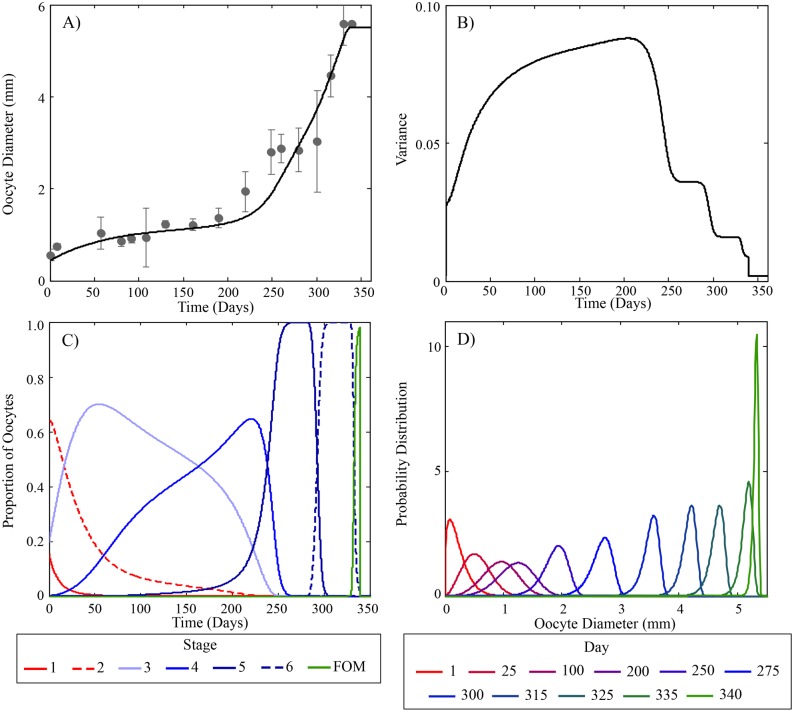
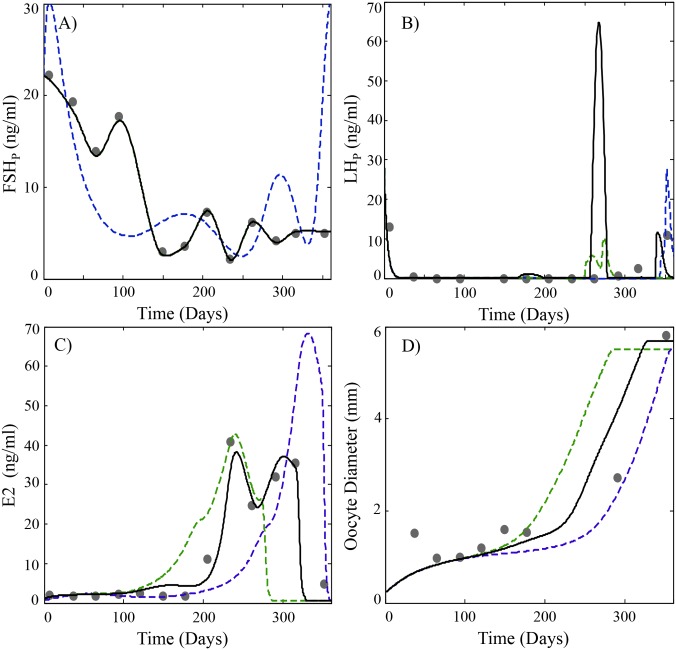
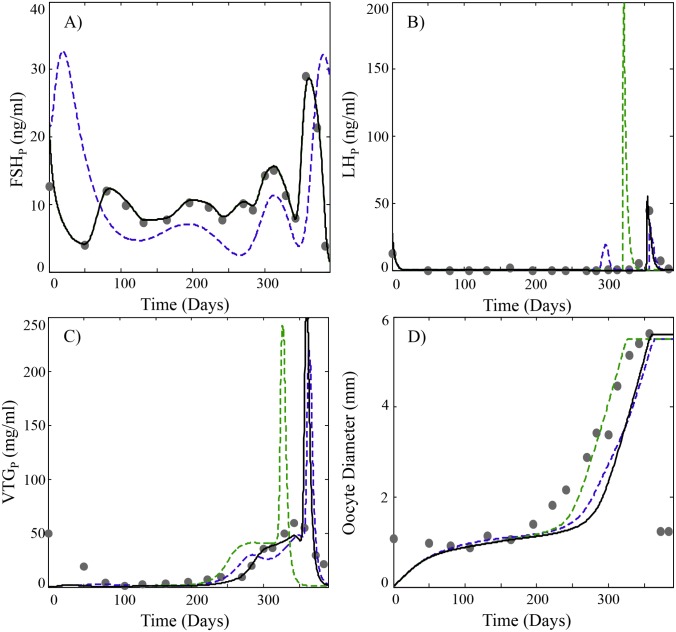
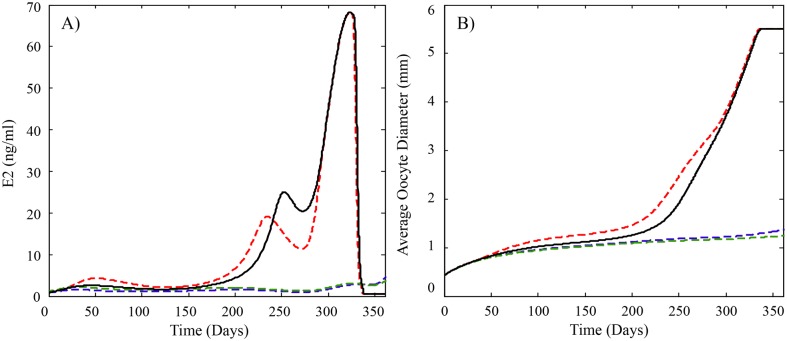
Reproduction in fishes and other vertebrates represents the timely coordination of many endocrine factors that culminate in the production of mature, viable gametes. In recent years there has been rapid growth in understanding fish reproductive biology, which has been motivated in part by recognition of the potential effects that climate change, habitat destruction and contaminant exposure can have on natural and cultured fish populations. New approaches to understanding the impacts of these stressors are being developed that require a systems biology approach with more biologically accurate and detailed mathematical models. We have developed a multi-scale mathematical model of the female rainbow trout hypothalamus-pituitary-ovary-liver axis to use as a tool to help understand the functioning of the system and for extrapolation of laboratory findings of stressor impacts on specific components of the axis. The model describes the essential endocrine components of the female rainbow trout reproductive axis. The model also describes the stage specific growth of maturing oocytes within the ovary and permits the presence of sub-populations of oocytes at different stages of development. Model formulation and parametrization was largely based on previously published in vivo and in vitro data in rainbow trout and new data on the synthesis of gonadotropins in the pituitary. Model predictions were validated against several previously published data sets for annual changes in gonadotropins and estradiol in rainbow trout. Estimates of select model parameters can be obtained from in vitro assays using either quantitative (direct estimation of rate constants) or qualitative (relative change from control values) approaches. This is an important aspect of mathematical models as in vitro, cell-based assays are expected to provide the bulk of experimental data for future risk assessments and will require quantitative physiological models to extrapolate across biological scales.


Conflict of interest statement

The authors have declared that no competing interests exist.

Figures

Fig 1
Fig 1. The HPOL signaling network in rainbow trout as formulated in our model.
Arrows and symbols on graph follow CellDesigner vs. 4.4 notation (www.celldesigner.org). GnRH is secreted from the hypothalamus into the pituitary stimulating the production of mFSH and mLH, which then leads to formation of FSH and LH, respectively. FSH, which is being continuously secreted from the pituitary, travels to the ovaries to stimulate production of E2. E2 then travels to the liver to bind with E2 receptors (R; translated from mR) to form ER. ER then stimulates the production of mVTG, which produces VTGL. Secreted VTG then travels from the liver to the ovaries via the plasma (VTGP) where it is absorbed by follicles in stages 3 through 6 (the proportion of follicles in these stages are denoted by Sj, j = 3, 4, 5, and 6) during vitellogenesis, the rate of which is affected by FSHP, to promote oocyte growth (OAvg). Oocyte growth then progresses the oocytes through the stages using a Weibull distribution created from OAvg together with OVar. In the later stages LHP stimulates the oocytes to produce DHP. Finally, oocytes undergo final maturation (SFOM) and combined with DHP, determine when the fish ovulates. Description of symbols are found in Table 1.
Fig 2
Fig 2. HPOL model predictions for circulating levels of FSH (A), LH (B), E2 (C), DHP (D) and VTG (E) over three reproductive cycles (approximately three years) using the parameters in Table 2.
Observed data (mean ± SD, n = 3) measured from a cohort of second time spawning female trout is shown as dark grey circles. The observed data for FSH, LH and DHP was measured as part of this study or from [45]. Three weeks after spawning average oocyte growth was reset to OAvg(0). Circulating DHP is shown on a nonlinear scale to emphasize low levels (less than 1 ng/ml) of DHP before FOM.
Fig 3
Fig 3. HPOL model predictions for (A) pituitary levels of FSHβ subunit mRNA, (B) pituitary levels of LHβ subunit mRNA, (C) Hepatic levels of E2 receptor mRNA and (D) Hepatic levels of VTG mRNA using the parameters in Table 2.
Observed data (dark grey circles; mean ±TG mRn = 3) was measured from the same individuals used for Fig 2.
Fig 4
Fig 4. Predicted oocyte growth and staging during a second reproductive cycle in rainbow trout.
(A) Predicted average oocyte growth and experimentally measured values [41]. Measured values were determined from the same individuals used for Figs 2 and 3. (B) Model predicted variance of oocyte diameters. (C) Model predicted proportion and duration of oocyte stages during a second reproductive cycle. Solid and dashed red lines are pre-vitellogenic stages (1 and 2), light to dark blue lines (stages 3–6) are early, mid and late vitellogenic stages and green line is the proportion of oocytes at FOM. (D) Model predictions of the distribution of oocyte diameter at various times during the reproductive cycle. Note the variability of oocyte diameter rapidly increases at the beginning of the cycle and decreases prior to ovulation.
Fig 5
Fig 5. Predicted plasma profiles of (A) FSH, (B) LH, (C) E2 and (D) average oocyte diameter (OAvg) compared to experimental data (black circles) obtained from [59].
Model simulations using parameter estimates listed in Table 2 and the same GnRH function used in Figs 2–4 are shown as dashed blue lines. Simulations using a customized GnRH function based on measured FSH levels in [59] (see also Appendix S5) are shown as a green dashed line. Simulations with the customized GnRH function and altered vitellogenic staging parameters (s3 = 1.19, s4 = 1.74, s5 = 3.51 and s6 = 5.48) are shown as a black solid line. A regression curve was used to map the GSI data in [59] to the average oocyte diameter (See Appendix S1).
Fig 6
Fig 6. Predicted plasma profiles of (A) FSH, (B) LH, (C) E2 and (D) average oocyte diameter (OAvg) compared to experimental data (black circles) obtained from [53,60].
Model simulations using parameter estimates listed in Table 2 and the same GnRH function used in Figs 2–4 are shown as dashed blue lines. Simulations using a customized GnRH function based on measured FSH levels in [53,60] (see also Appendix S5) are shown as a green dashed line. Simulations with the customized GnRH function and altered vitellogenic staging parameters (s3 = 1.21, s4 = 1.76, s5 = 3.48 and s6 = 5.39) are shown as a black solid line. A regression curve was used to map the GSI data in [53] to the average oocyte diameter (See Appendix S1).
Fig 7
Fig 7. Model predicted profiles of plasma levels of (A) E2 and (B) average oocyte growth for rainbow trout exposed to trenbolone.
Previously published studies suggest trenbolone exposure may decrease E2 synthesis to varying degrees depending on exposure levels, and also increase the clearance of E2 from plasma and increase the secretion of FSH in trout. The solid black line is the model predictions for fish not exposed to trenbolone and uses the parameter values found in Table 2. The dashed lines depict model predictions of known effects of trout that are exposed to trenbolone and use parameter values found in Table 2 except for ClE2,Sj = 0.54*ClE2,Sj for j = 4 and 5, ks,FSH = 4*ks,FSH during Stages 1 and 2. The blue dashed line also uses ClE2 = 1.41*ClE2 and the green dashed line uses ks,mVTG = 0.6*ks,mVTG. The model predicts that ovulation is unlikely to occur when an increase in E2 clearance and/or a decrease in mVTG synthesis is added to the effects because the delay in ovulation is more than 50 days.

Similar articles

Cited by

References

    1. Nagahama Y, Yoshikuni M, Yamashita M, Tanaka M. Regulation of Oocyte Maturation in Fish. Fish Physiology. 1994;13:393–439.
    1. Zohar Y, Mun˜oz-Cueto J, Elizur A, Kah O. Neuroendocrinology of reproduction in teleost fish. General and Comparative Endocrinology. 2010;165:438–455. 10.1016/j.ygcen.2009.04.017 - DOI - PubMed
    1. Yaron Z, Gur G, Melamed P, Rosenfeld H, Elizur A, Levavi-Sivan B. Regulation of Rish Gonadotropins. International Review of Cytology. 2003;225:131–185. - PubMed
    1. Swanson P. Salmon gonadotropins: Reconciling old and new ideas. In: Proceedings of the fourth international symposium on the reproductive physiology of fish; 1991. p. 2–7.
    1. Tyler C, Sumpter J. Oocyte growth and development in teleosts. Reviews in Fish Biology and Fisheries. 1996;6:287–318.

Publication types

LinkOut - more resources