

Morphometric Differences of Vocal Tract Articulators in Different Loudness Conditions in Singing
- PMID: 27096935
- PMCID: PMC4838265
- DOI: 10.1371/journal.pone.0153792
Morphometric Differences of Vocal Tract Articulators in Different Loudness Conditions in Singing
Abstract
Introduction: Dynamic MRI analysis of phonation has gathered interest in voice and speech physiology. However, there are limited data addressing the extent to which articulation is dependent on loudness.
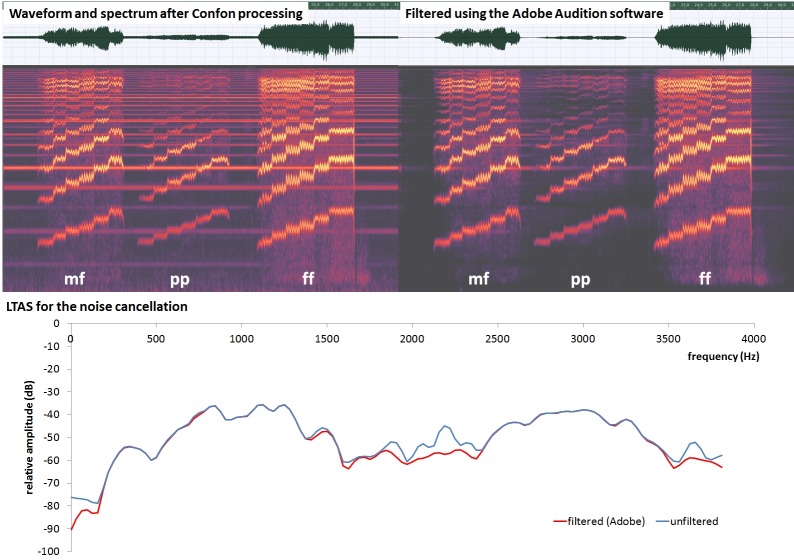
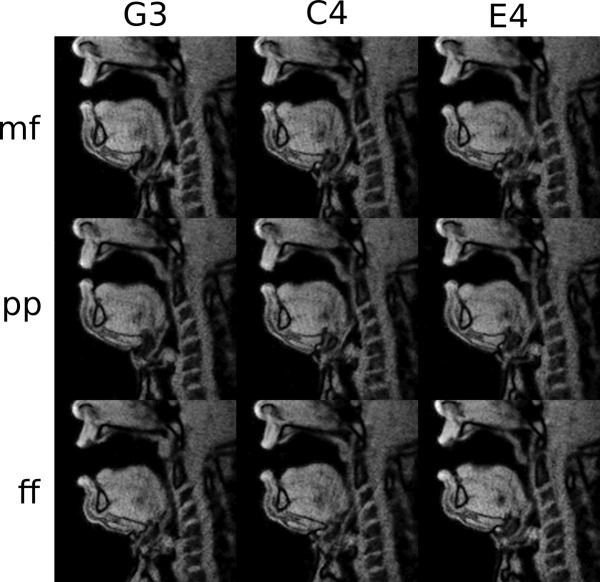
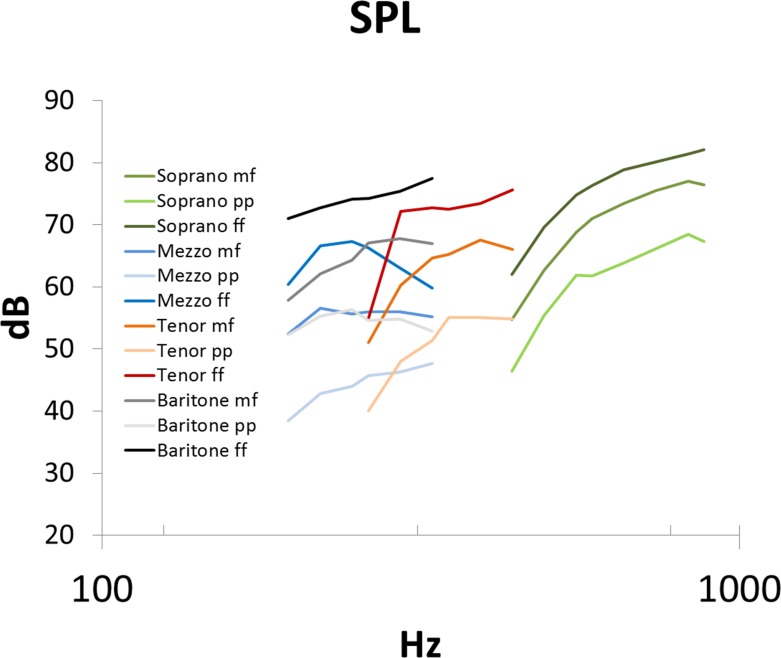
Material and methods: 12 professional singer subjects of different voice classifications were analysed concerning the vocal tract profiles recorded with dynamic real-time MRI with 25fps in different pitch and loudness conditions. The subjects were asked to sing ascending scales on the vowel /a/ in three loudness conditions (comfortable=mf, very soft=pp, very loud=ff, respectively). Furthermore, fundamental frequency and sound pressure level were analysed from the simultaneously recorded optical audio signal after noise cancellation.
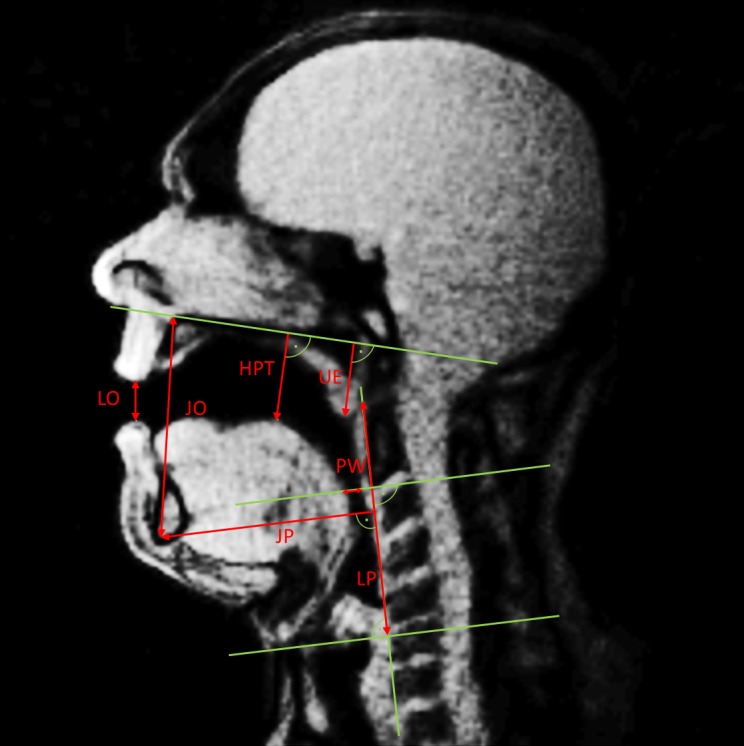
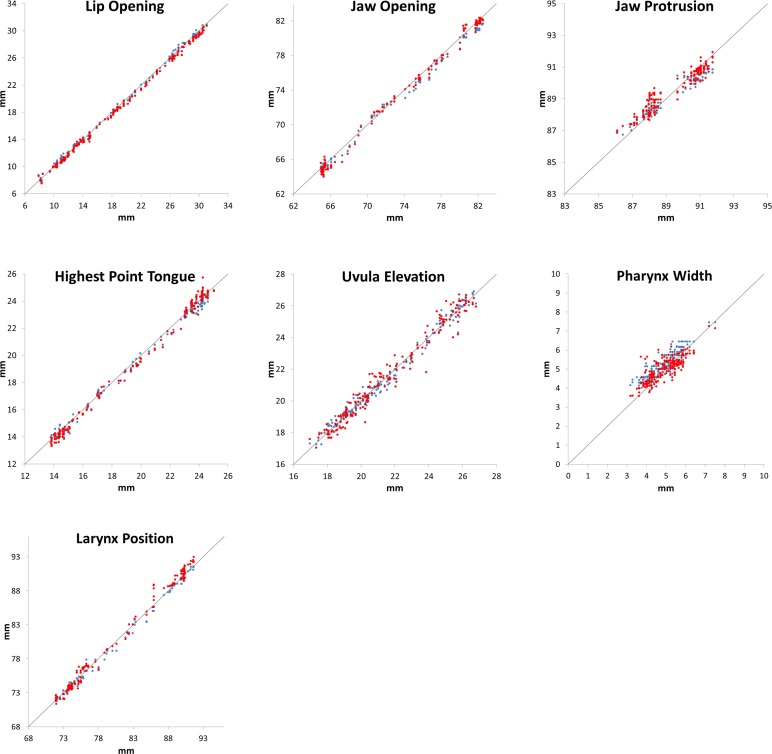
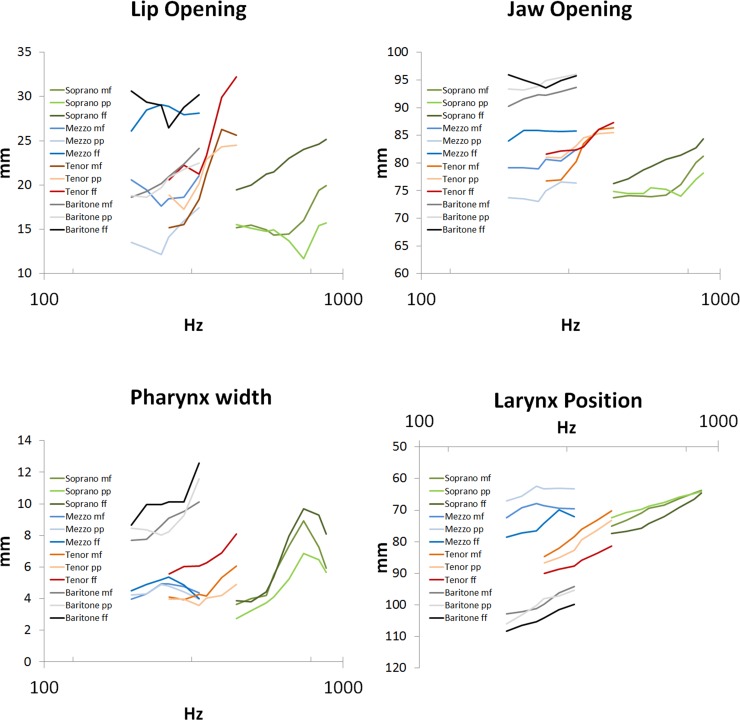
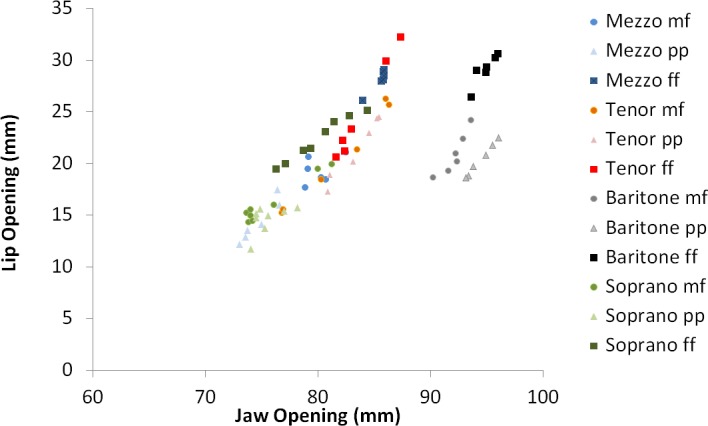
Results: The data show articulatory differences with respect to changes of both pitch and loudness. Here, lip opening and pharynx width were increased. While the vertical larynx position was rising with pitch it was lower for greater loudness. Especially, the lip opening and pharynx width were more strongly correlated with the sound pressure level than with pitch.
Conclusion: For the vowel /a/ loudness has an effect on articulation during singing which should be considered when articulatory vocal tract data are interpreted.
Conflict of interest statement
Figures
Similar articles
-
The effect of supine and upright position on vocal tract configurations during singing--a comparative study in professional tenors.J Voice. 2013 Mar;27(2):141-8. doi: 10.1016/j.jvoice.2012.11.002. Epub 2013 Feb 4. J Voice. 2013. PMID: 23380394
-
Vocal tract configurations in tenors' passaggio in different vowel conditions-a real-time magnetic resonance imaging study.J Voice. 2014 Mar;28(2):262.e1-262.e8. doi: 10.1016/j.jvoice.2013.10.009. Epub 2014 Jan 9. J Voice. 2014. PMID: 24412038
-
Weight-bearing MR imaging as an option in the study of gravitational effects on the vocal tract of untrained subjects in singing phonation.PLoS One. 2014 Nov 7;9(11):e112405. doi: 10.1371/journal.pone.0112405. eCollection 2014. PLoS One. 2014. PMID: 25379885 Free PMC article.
-
Perceptual aspects of singing.J Voice. 1994 Jun;8(2):106-22. doi: 10.1016/s0892-1997(05)80303-0. J Voice. 1994. PMID: 8061767 Review.
-
The aging voice.Semin Speech Lang. 1997 May;18(2):159-68; quiz 168-9. doi: 10.1055/s-2008-1064070. Semin Speech Lang. 1997. PMID: 9195688 Review.
Cited by
-
Where did language come from? Precursor mechanisms in nonhuman primates.Curr Opin Behav Sci. 2018 Jun;21:195-204. doi: 10.1016/j.cobeha.2018.06.003. Epub 2018 Jul 2. Curr Opin Behav Sci. 2018. PMID: 30778394 Free PMC article.
-
Dark tone quality and vocal tract shaping in soprano song production: Insights from real-time MRI.JASA Express Lett. 2021 Jul;1(7):075202. doi: 10.1121/10.0005109. Epub 2021 Jul 9. JASA Express Lett. 2021. PMID: 34291230 Free PMC article.
-
Exploring voice as a digital phenotype in adults with ADHD.Sci Rep. 2025 May 24;15(1):18076. doi: 10.1038/s41598-025-01989-x. Sci Rep. 2025. PMID: 40413201 Free PMC article.
-
Realistic Dynamic Numerical Phantom for MRI of the Upper Vocal Tract.J Imaging. 2020 Aug 27;6(9):86. doi: 10.3390/jimaging6090086. J Imaging. 2020. PMID: 34460743 Free PMC article.
-
Vocal fold oscillation pattern changes related to loudness in patients with vocal fold mass lesions.J Otolaryngol Head Neck Surg. 2020 Nov 23;49(1):80. doi: 10.1186/s40463-020-00481-y. J Otolaryngol Head Neck Surg. 2020. PMID: 33228812 Free PMC article.
References
Publication types
MeSH terms
LinkOut - more resources
Full Text Sources
Other Literature Sources
Medical
Miscellaneous
