

Disease Burden of 32 Infectious Diseases in the Netherlands, 2007-2011
- PMID: 27097024
- PMCID: PMC4838234
- DOI: 10.1371/journal.pone.0153106
Disease Burden of 32 Infectious Diseases in the Netherlands, 2007-2011
Abstract
Background: Infectious disease burden estimates provided by a composite health measure give a balanced view of the true impact of a disease on a population, allowing the relative impact of diseases that differ in severity and mortality to be monitored over time. This article presents the first national disease burden estimates for a comprehensive set of 32 infectious diseases in the Netherlands.
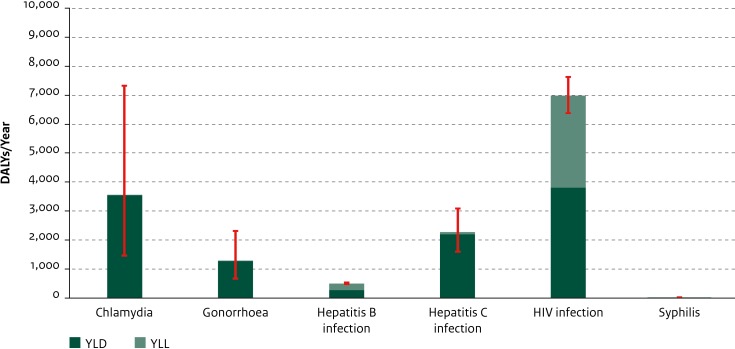
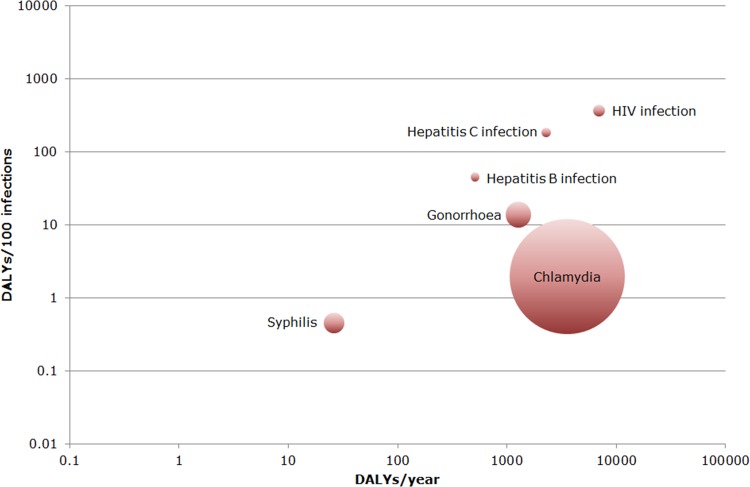
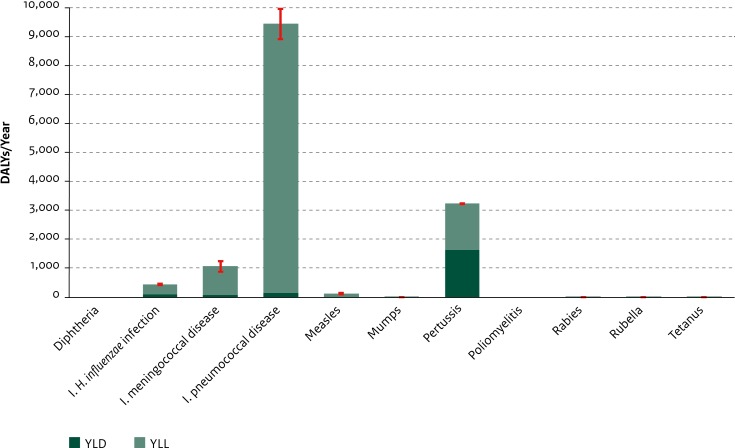
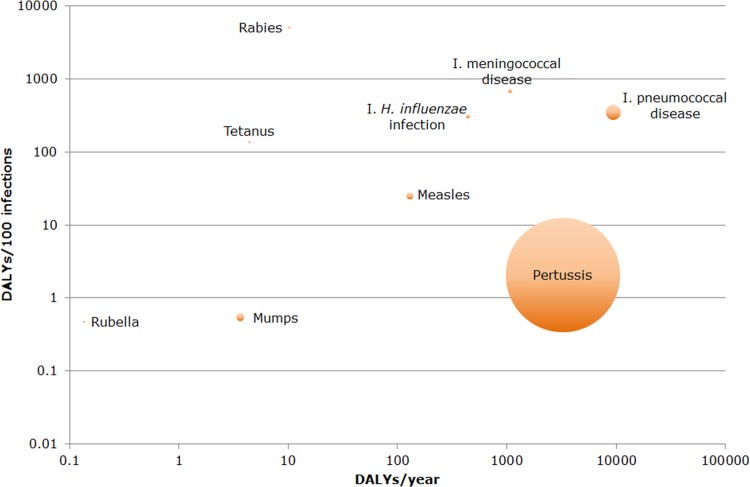
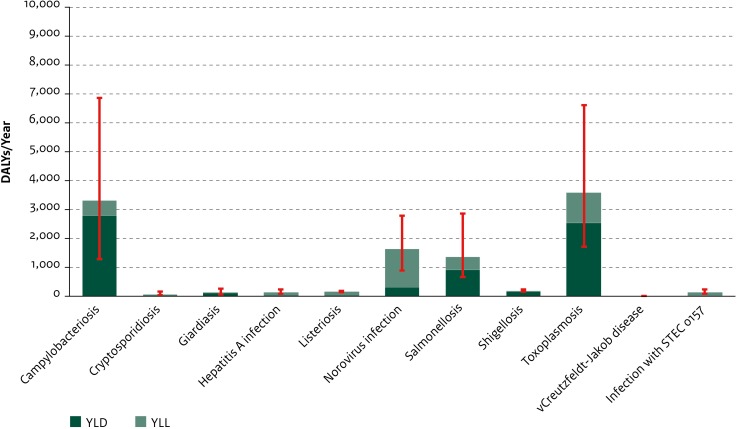
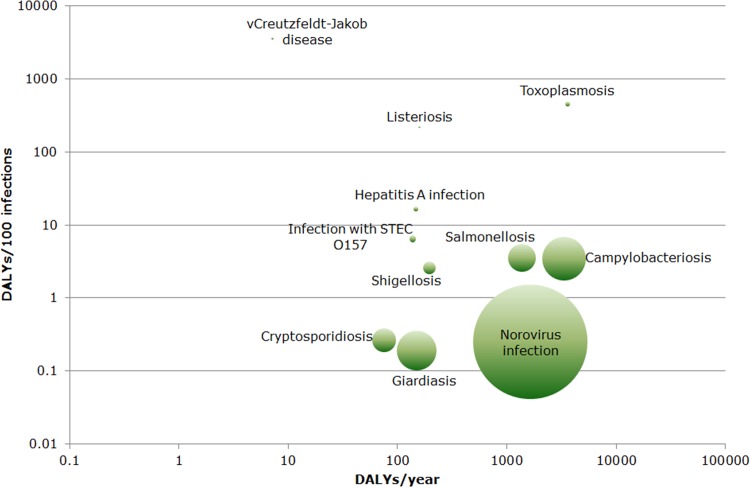
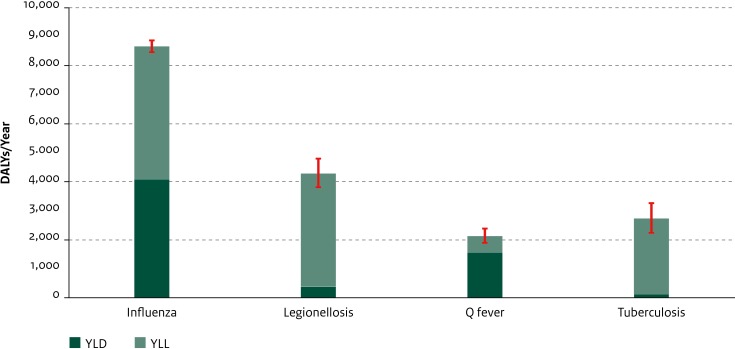
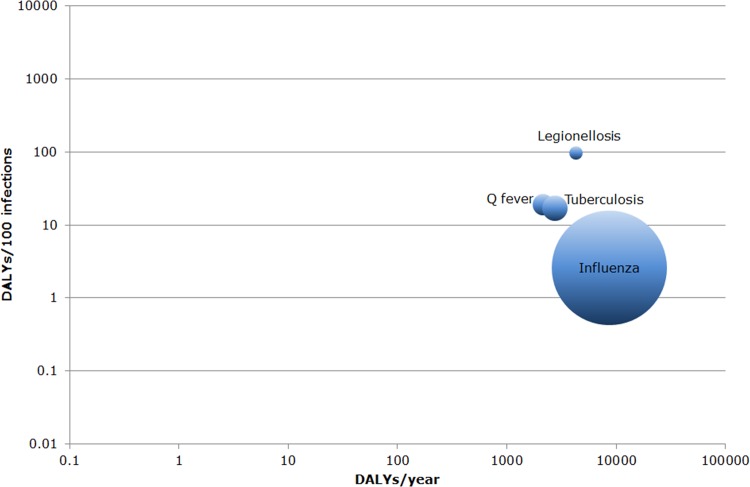
Methods and findings: The average annual disease burden was computed for the period 2007-2011 for selected infectious diseases in the Netherlands using the disability-adjusted life years (DALY) measure. The pathogen- and incidence-based approach was adopted to quantify the burden due to both morbidity and premature mortality associated with all short and long-term consequences of infection. Natural history models, disease progression probabilities, disability weights, and other parameters were adapted from previous research. Annual incidence was obtained from statutory notification and other surveillance systems, which was corrected for under-ascertainment and under-reporting. The highest average annual disease burden was estimated for invasive pneumococcal disease (9444 DALYs/year; 95% uncertainty interval [UI]: 8911-9961) and influenza (8670 DALYs/year; 95% UI: 8468-8874), which represents 16% and 15% of the total burden of all 32 diseases, respectively. The remaining 30 diseases ranked by number of DALYs/year from high to low were: HIV infection, legionellosis, toxoplasmosis, chlamydia, campylobacteriosis, pertussis, tuberculosis, hepatitis C infection, Q fever, norovirus infection, salmonellosis, gonorrhoea, invasive meningococcal disease, hepatitis B infection, invasive Haemophilus influenzae infection, shigellosis, listeriosis, giardiasis, hepatitis A infection, infection with STEC O157, measles, cryptosporidiosis, syphilis, rabies, variant Creutzfeldt-Jakob disease, tetanus, mumps, rubella, diphtheria, and poliomyelitis. The very low burden for the latter five diseases can be attributed to the National Immunisation Programme. The average disease burden per individual varied from 0.2 (95% UI: 0.1-0.4) DALYs per 100 infections for giardiasis, to 5081 and 3581 (95% UI: 3540-3611) DALYs per 100 infections for rabies and variant Creutzfeldt-Jakob disease, respectively.
Conclusions: For guiding and supporting public health policy decisions regarding the prioritisation of interventions and preventive measures, estimates of disease burden and the comparison of burden between diseases can be informative. Although the collection of disease-specific parameters and estimation of incidence is a process subject to continuous improvement, the current study established a baseline for assessing the impact of future public health initiatives.
Conflict of interest statement
Figures
References
-
- Gold MR, Muennig P . Measure-dependent variation in burden of disease estimates: implications for policy. Med Care. 2002;40(3):260–6. - PubMed
-
- Mangen MJJ, Plass D, Kretzschmar MEE. Estimating the current and future burden of communicable diseases in the European Union and EEA/EFTA. Bilthoven: National Institute for Public Health and the Environment (RIVM); 2014 (RIVM report 210474001).
-
- Murray CJL, Lopez AD. The Global Burden of Disease—a comprehensive assessment of mortality and disability from diseases, injuries, and risk factors in 1990 and projected to 2020 (Global burden of disease and injuries series; I) Cambridge: Harvard School of Public Health on behalf of the World Health Organization and the World Bank; 1996.
Publication types
MeSH terms
LinkOut - more resources
Full Text Sources
Other Literature Sources
Medical
