. 2016 Apr 20;11(4):e0154056.
doi: 10.1371/journal.pone.0154056. eCollection 2016.

New Cysteine-Rich Ice-Binding Protein Secreted from Antarctic Microalga, Chloromonas sp

Affiliations

New Cysteine-Rich Ice-Binding Protein Secreted from Antarctic Microalga, Chloromonas sp

Woongsic Jung et al. PLoS One. .

Abstract

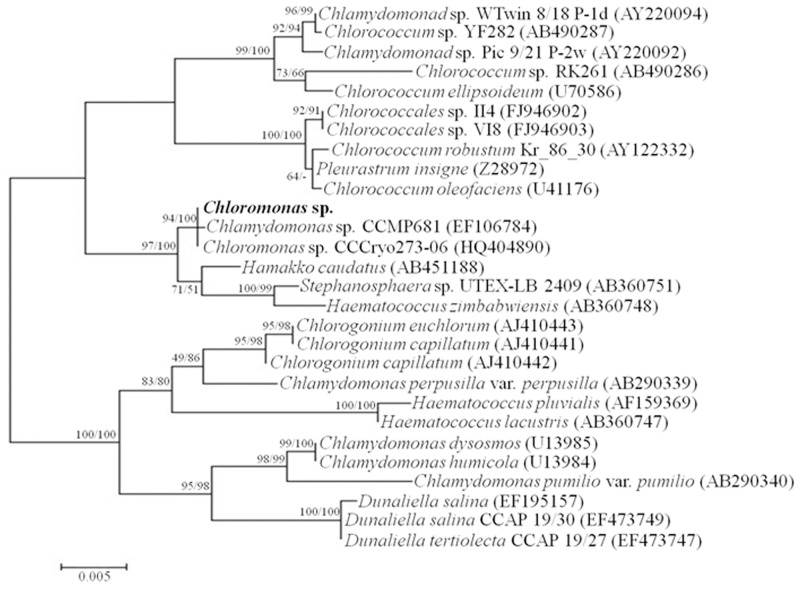
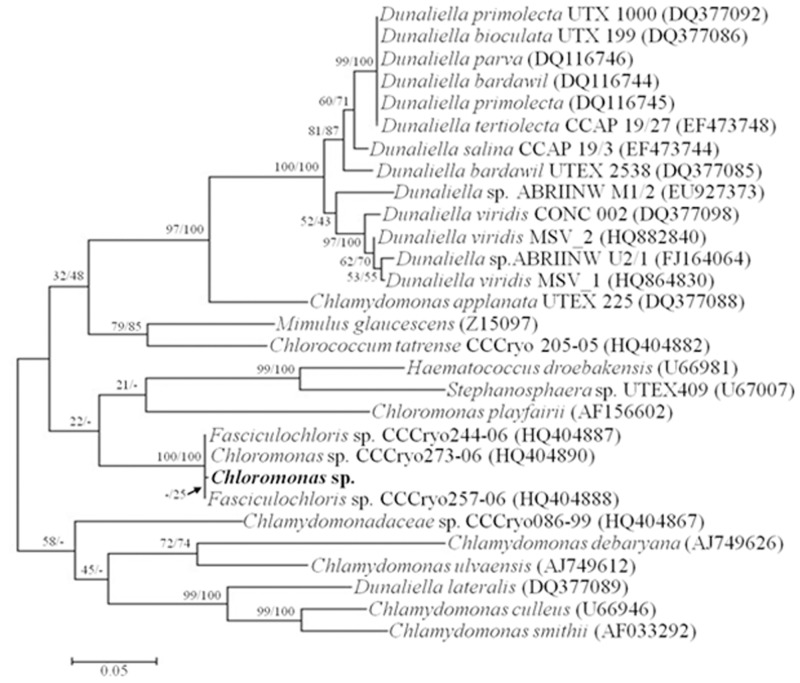
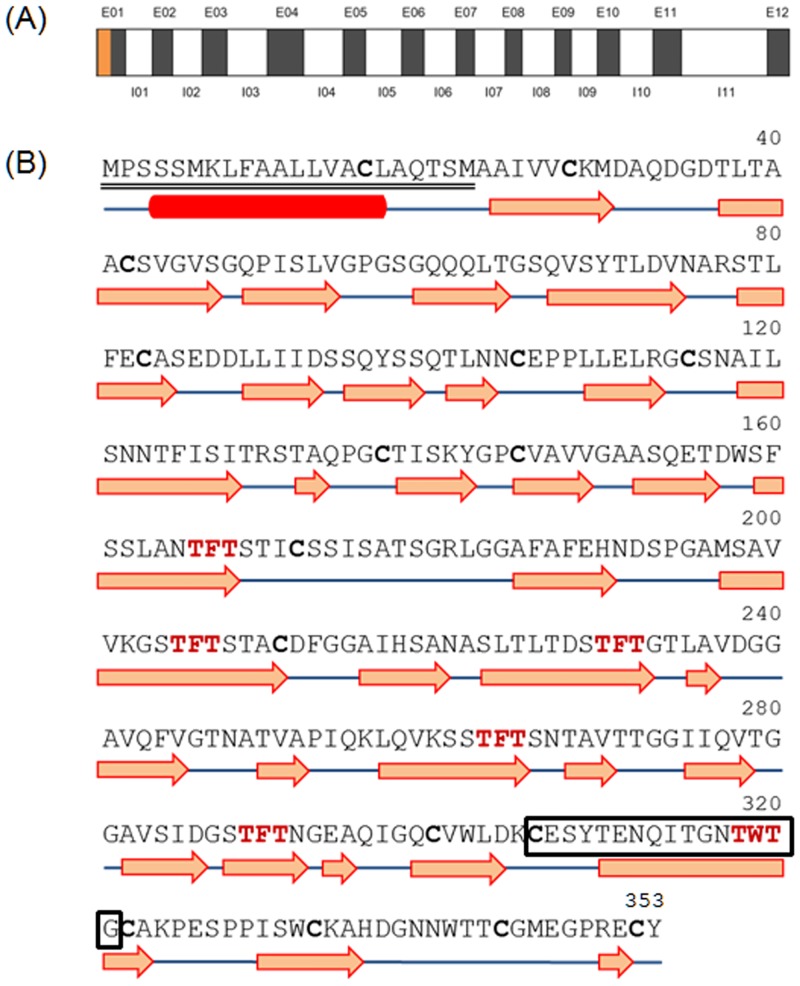
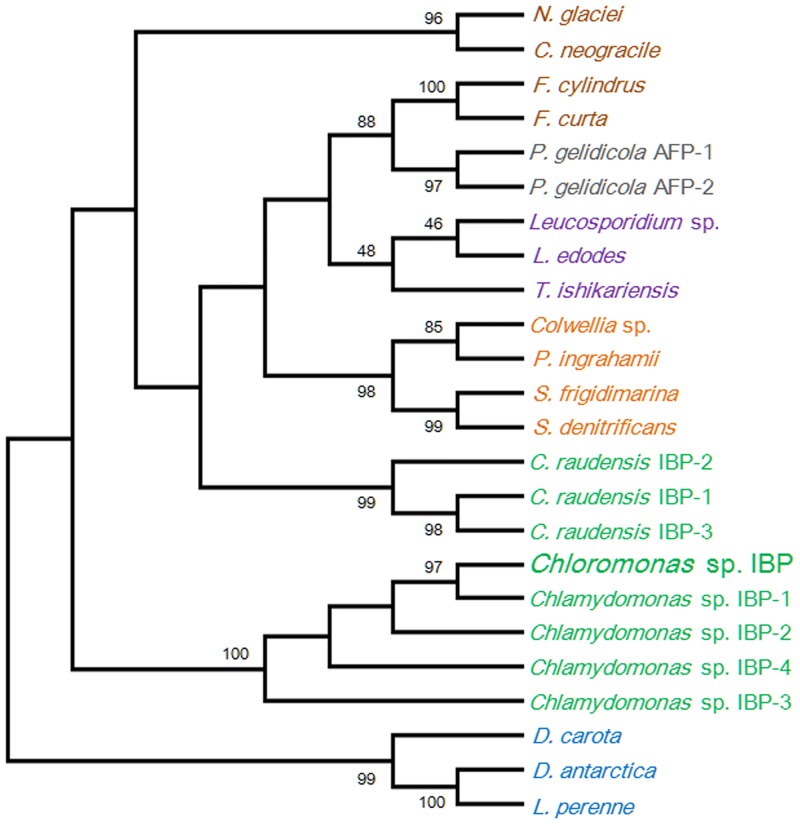
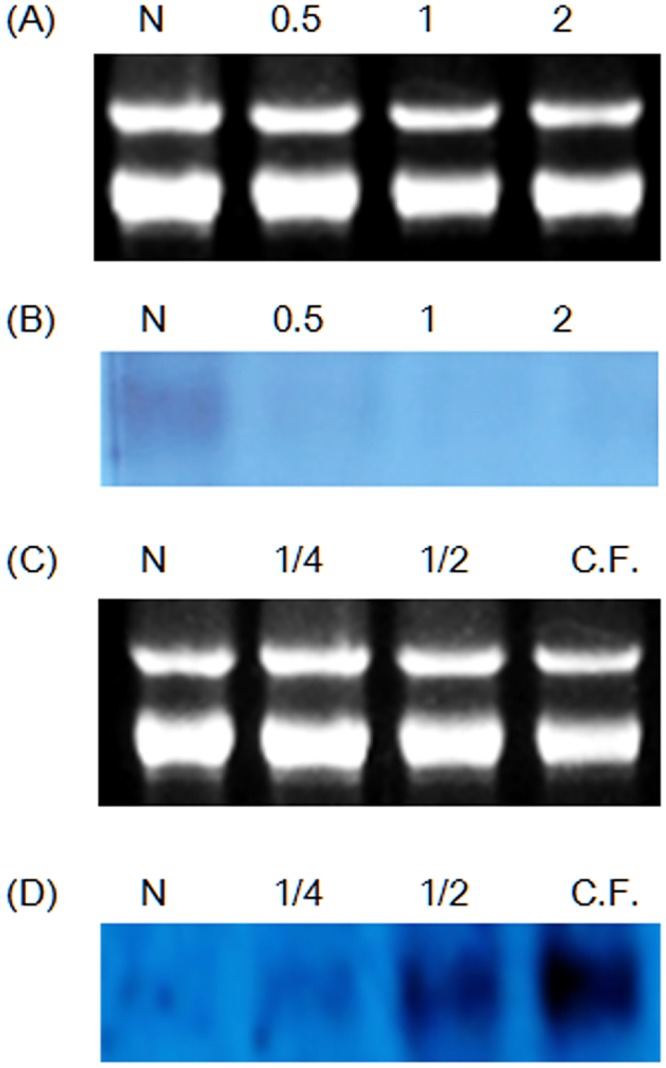
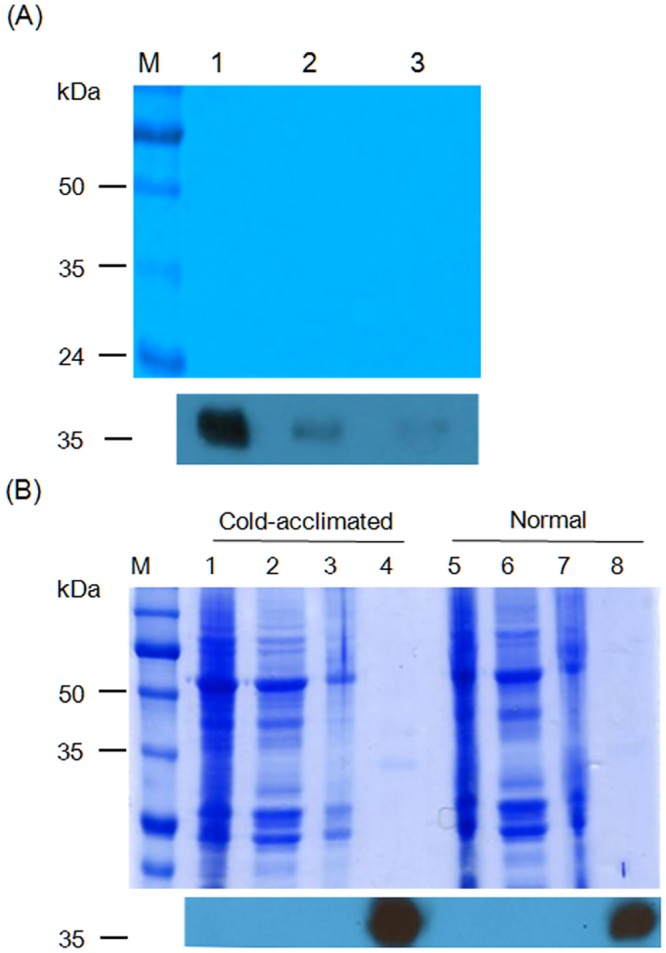
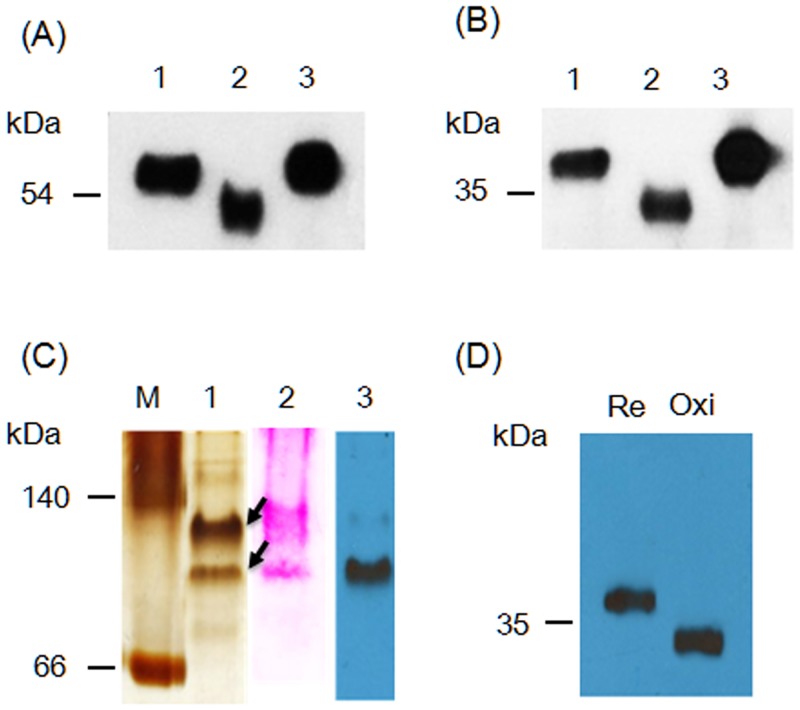
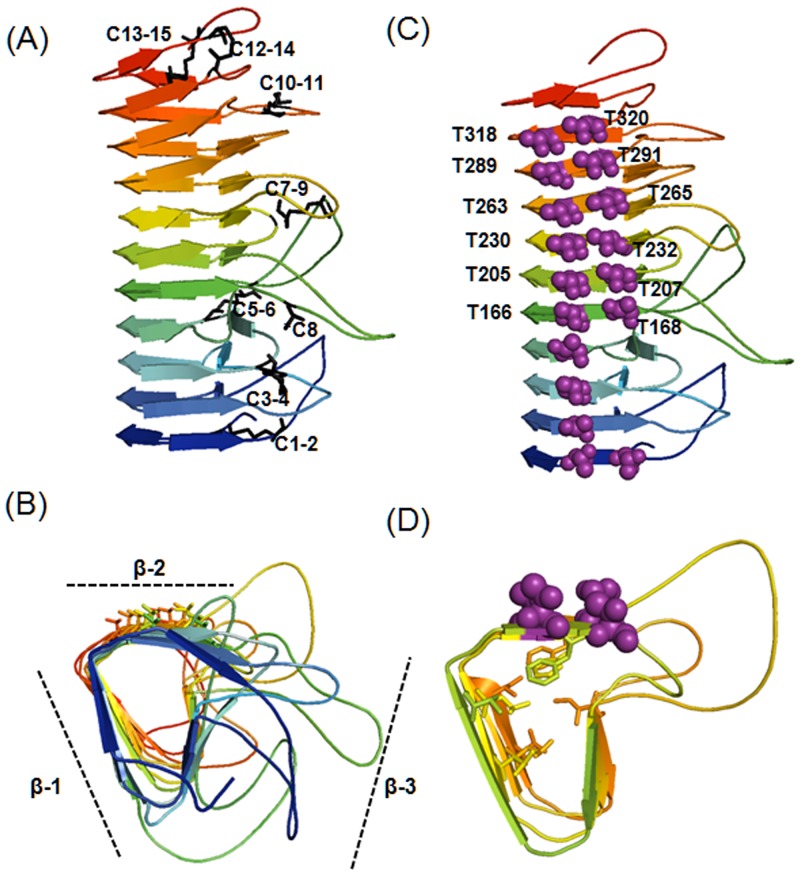
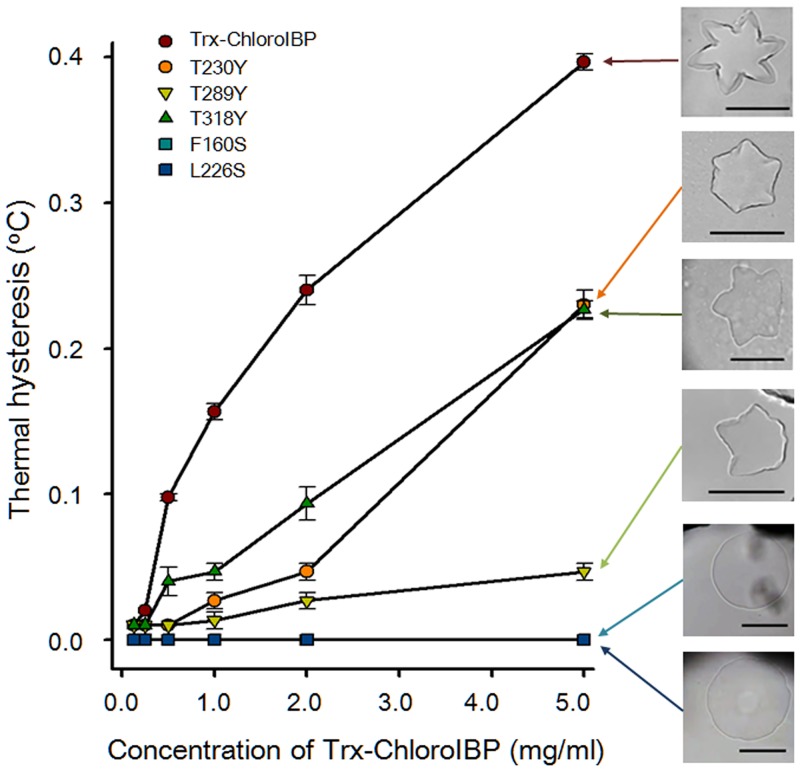
Many microorganisms in Antarctica survive in the cold environment there by producing ice-binding proteins (IBPs) to control the growth of ice around them. An IBP from the Antarctic freshwater microalga, Chloromonas sp., was identified and characterized. The length of the Chloromonas sp. IBP (ChloroIBP) gene was 3.2 kb with 12 exons, and the molecular weight of the protein deduced from the ChloroIBP cDNA was 34.0 kDa. Expression of the ChloroIBP gene was up- and down-regulated by freezing and warming conditions, respectively. Western blot analysis revealed that native ChloroIBP was secreted into the culture medium. This protein has fifteen cysteines and is extensively disulfide bonded as shown by in-gel mobility shifts between oxidizing and reducing conditions. The open-reading frame of ChloroIBP was cloned and over-expressed in Escherichia coli to investigate the IBP's biochemical characteristics. Recombinant ChloroIBP produced as a fusion protein with thioredoxin was purified by affinity chromatography and formed single ice crystals of a dendritic shape with a thermal hysteresis activity of 0.4±0.02°C at a concentration of 5 mg/ml. In silico structural modeling indicated that the three-dimensional structure of ChloroIBP was that of a right-handed β-helix. Site-directed mutagenesis of ChloroIBP showed that a conserved region of six parallel T-X-T motifs on the β-2 face was the ice-binding region, as predicted from the model. In addition to disulfide bonding, hydrophobic interactions between inward-pointing residues on the β-1 and β-2 faces, in the region of ice-binding motifs, were crucial to maintaining the structural conformation of ice-binding site and the ice-binding activity of ChloroIBP.


Conflict of interest statement

Competing Interests: The authors have declared that no competing interests exist.

Figures

Fig 1
Fig 1. Pictures of Chloromonas sp., and single ice crystal shapes from the extracellular fraction of Chloromonas sp.
(A) light micrograph showing chloroplast and flagella; (b) electron micrographs showing ultrastructural features by longitudinal and cross-section views (Cp, Chloroplast; F, Flagella; G, Golgi complex; L, Lumen; Mt, Mitochondria; N, Nucleus; S, Starch (C and D) ice crystal shapes formed by ice-binding proteins secreted from Chloromonas sp showing hexagonal morphology.
Fig 2
Fig 2. Phylogenetic tree of SSU (18S rDNA) sequences among microorganisms genetically-close to Chloromonas sp.
The sequences used for analysis were acquired from the NCBI database and aligned by the ClustalW algorithm [24]. The tree was generated by the maximum likelihood (ML) method. The probabilities from maximum parsimony and distance methods (left and right values, respectively) were obtained by bootstrap analysis of 5000 repetitions.
Fig 3
Fig 3. Phylogenetic tree of intergenic transcribed spacer (ITS) sequences among microorganisms genetically-close to Chloromonas sp.
The tree was generated as described in the legend to Fig 2.
Fig 4
Fig 4. Genomic DNA structure of the ChloroIBP gene and prediction of secondary structure of ChloroIBP.
(A) The genomic structure consisted of 11 introns (I) and 12 exons (E) presented by white and gray boxes, respectively. The signal peptide is coloured orange. Lengths of the introns and exons are shown in S2 Table. (B) Deduced amino acid sequence of ChloroIBP with the signal peptide sequence double-underlined. A box with black colour shows the peptide sequences for detection of ChloroIBP in western blot analysis. Potential T-X-T ice-binding motifs are displayed in a bold, red font. Cysteine residues are shown in bold letters. The red box and blue lines indicate α-helix and coils, respectively. Orange arrows indicate β-strands.
Fig 5
Fig 5. Southern blotting of Chloromonas genomic DNA to analyze the gene family encoding ChloroIBP.
Left: Ethidium bromide-stained agarose gel showing: M, 1 kb DNA ladder; B, BamHI-digested Chloromonas genomic DNA; K, KpnI-digested Chloromonas genomic DNA; Xb, XbaI-digested Chloromonas genomic DNA; U, Undigested nuclear DNA as a control. Right: Autoradiogram of the probed blot from the gel on the left.
Fig 6
Fig 6. Phylogenetic relationship of ChloroIBP and various types of IBPs originating from plants and microorganisms.
Amino acid sequences were aligned by the ClustalW program [24]. The phylogenetic tree was constructed by the neighbor-joining method from the MEGA 6 program [25]. The numbers in each node of the branches indicate the bootstrap values of 5,000 repetitions. Bootstrap values below 40% were rejected. Green and brown represent the Antarctic Chlorophyta and Bacillariophyceae, respectively. Orange and violet indicate bacteria and fungi, respectively. Blue represents the Planta, while grey indicates Prasinophyta.
Fig 7
Fig 7. Northern blot analysis of thermal and freezing stresses.
(A and C) Electrophoretic data for control RNAs. (B) Autoradiogram of transcriptional change in ChloroIBP mRNA levels with thermal conditions. N, normal cells; 0.5, 30-min incubation at 25°C; 1, 1 h-incubation at 25°C; 2, 2-h incubation at 25°C. (D) Autoradiogram of transcriptional change in ChloroIBP mRNA levels with freezing condition. N, normal cells; 1/4, 25% of medium occupied by ice slush; 1/2, 50% of medium occupied by ice slush; C.F., 100% of medium occupied by ice slush.
Fig 8
Fig 8. Localization and levels of ChloroIBP production according to freezing condition.
(A) Top—SDS-PAGE analysis of extracellular proteins from frozen cultures (1); culture where one quarter of the volume is ice slush (2); and culture grown under normal conditions (3). Bottom—immunoblot of the gel transfer where ChoroIBP migrates. (B) SDS-PAGE and immunoblot analysis. Top—Coomassie blue staining of samples prepared at the cold-acclimated (0°C, shaking incubation for 3 days, lanes 1–4) and normal (4°C, lanes 5–8) conditions. M, Marker proteins; 1 and 5, Total crude extracts; 2 and 6, Intracellular soluble proteins; 3 and 7, Cell debris samples; 4 and 8, Extracellular proteins. Bottom—immunoblot of the gel transfer where ChoroIBP migrates.
Fig 9
Fig 9. In-gel mobility of ChloroIBP.
(A) Extracellular recombinant Trx-ChloroIBP visualized by immunoblotting following SDS-PAGE analysis in a redox experiment. 1, Trx-ChloroIBP treated with β-mercaptoethanol; 2, Trx-ChloroIBP oxidized by ambient air; 3, Trx-ChloroIBP alkylated by iodoacetamide after treatment with β-mercaptoethanol. (B) Topological change of native ChloroIBP. Treatment with reagents was the same as for (A). (C) Location of native ChloroIBP secreted into culture media on a native polyacrylamide gel. (M, protein markers representing bovine serum albumin based on the protein structure of P.69 pertactin (66) and L-lactic dehydrogenase (140); 1, silver staining of extracellular proteins secreted from Chloromonas sp.; 2, Periodic-acid staining of extracellular proteins from Chloromonas sp.; 3, Immunoblot band detected by anti-ChloroIBP antibody to a blot of Lane 1. (D) Topological movement of native ChloroIBP separated on a native polyacrylamide gel after reduction (Re) or under oxidizing conditions (Oxi).
Fig 10
Fig 10. Thermal hysteresis activity as a function of Trx-ChloroIBP concentration.
Insets show the morphological changes of single ice crystals at different recombinant ChloroIBP concentrations. BSA solution (5 mg/ml) was used as a control. Scale bars indicate 100 μm.
Fig 11
Fig 11. Overall in silico three dimensional structure of ChloroIBP from Bordetella pertussis (1DAB).
Homology modeling was performed by the Modeller v.9.9 program [40]. The results of protein modeling were visualized by the program PyMol v1.3 [79]. (A) Rainbow colours blue to red mark the progression along the protein backbone from N to C termini, respectively. Possible formation of disulfide bonds was predicted by the DIpro program [44] in the SCRATCH protein predictor. Residue numbers of the Cys are indicated as follows. C1, Cys28; C2, Cys42; C3, Cys83; C4, Cys105 C5, Cys115; C6, Cys137; C7, Cys145; C8, Cys172; C9, Cys211; C10, Cys300; C11, Cys306; C12, Cys322; C13, Cys333; C14, Cys344; C15, Cys352. C8 (denoted by an asterisk) was assumed to be a free Cys residue retaining a free thiol group. All other Cys are paired according to the modeling prediction. (B) The end-on view of ChloroIBP is displayed with the same colour scheme as in (A). ChloroIBP showed three β-faces including the β-2 face analyzed to have the T-X-T motifs indicated by sticks. (C) The ChloroIBP β-2 face showing the disposition of Thr residues (purple spheres). The numbers of Thr in T-X-T motifs substituted with Tyr in site-directed mutagenesis are indicated along the corresponding residues. (D) The hydrophobic core of ChloroIBP composed of Val, Leu, Ile, Phe, and Trp as indicated by the stick representation of their side chains.
Fig 12
Fig 12. Plot of thermal hysteresis activity as a function of protein concentration of wild-type and mutant Trx-ChloroIBP.
Colours and symbols indicate the different ChloroIBP mutants. Values shown are averaged S.D. of three replicates of the measurement of TH. Insets show single ice crystal morphology obtained with each Trx-ChloroIBP at the highest protein concentration assayed. Scale bars indicate 100 μm.
Fig 13
Fig 13. Regularity of ice-binding motifs (IBMs) on the β-2 face of ChloroIBP.
(A) Six ice-binding IBMs of ChloroIBP. T-F-T and T-W-T as IBMs were illustrated by the PyMol program [79]. Red and blue indicate O and N atoms, respectively. (B) Location of some residues targeted for mutagenesis including Thr on the β-2 face. These hydrophobic residues were located closely in the hydrophobic core. (C) Alignment of amino acid sequences between ChloroIBP and pertactin P.69 in one section of the IBM region of ChloroIBP. IBMs are indicated by underlining. Hydrophobic residues predicted to interact with Phe residues in IBMs are indicated by asterisks.

Similar articles

Cited by

References

    1. Priddle J, Hawes I, Ellis-Evans JC. Antarctic aquatic ecosystems as habitats for phytoplankton. Biol Rev. 1986; 61(3):199–238.
    1. Ehn JK, Mundy CJ. Assessment of light absorption within highly scattering bottom sea ice from under-ice light measurements: Implications for Arctic ice algae primary production. Limnol Oceanogr. 2013; 58(3):893–902.
    1. Thomas DN, Dieckmann GS. Antarctic sea ice-a habitat for extremophiles. Science. 2002; 295(5555):641–4. - PubMed
    1. Mock T, Thomas DN. Recent advances in sea-ice microbiology. Environ Microbiol. 2005; 7(5):605–19. - PubMed
    1. Eicken H, Bock C, Wittig R, Miller H, Poertner HO. Magnetic resonance imaging of sea-ice pore fluids: methods and thermal evolution of pore microstructure. Cold Reg Sci Technol. 2000; 31(3):207–25.

Publication types

MeSH terms

Associated data