

Dynamic assessment of exposure to air pollution using mobile phone data
- PMID: 27097526
- PMCID: PMC4839157
- DOI: 10.1186/s12942-016-0042-z
Dynamic assessment of exposure to air pollution using mobile phone data
Abstract
Background: Exposure to air pollution can have major health impacts, such as respiratory and cardiovascular diseases. Traditionally, only the air pollution concentration at the home location is taken into account in health impact assessments and epidemiological studies. Neglecting individual travel patterns can lead to a bias in air pollution exposure assessments.
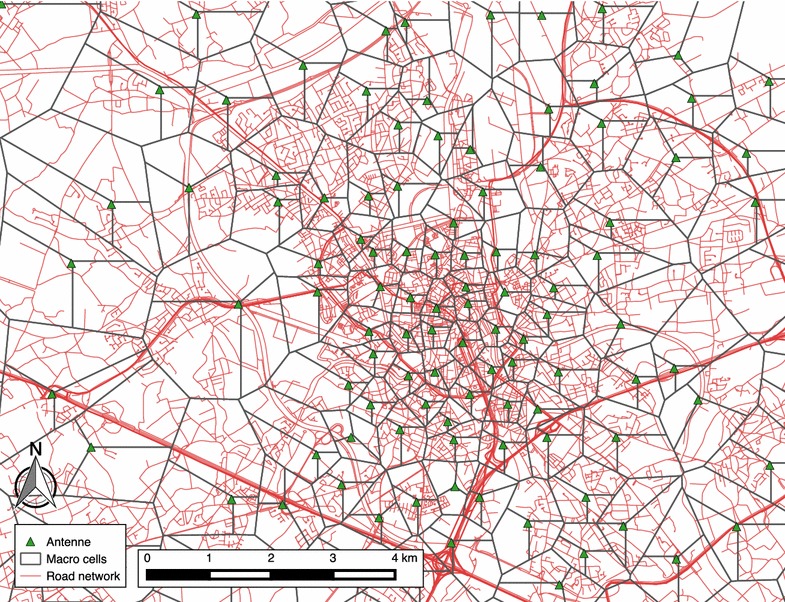
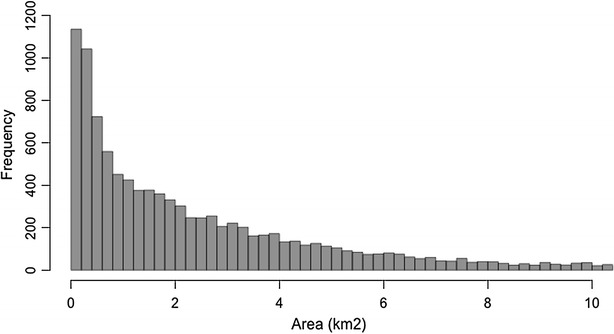
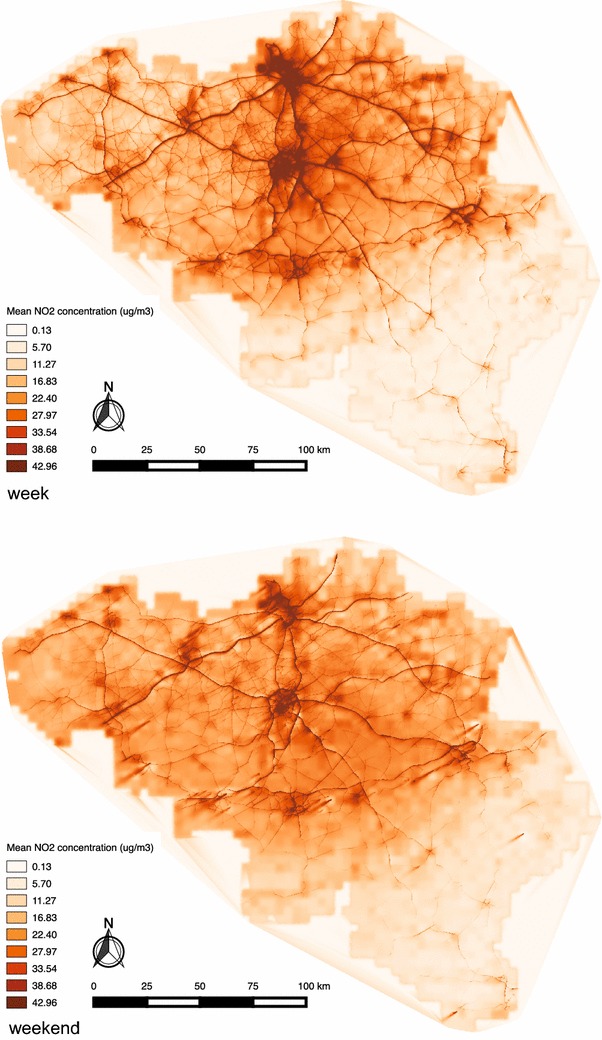
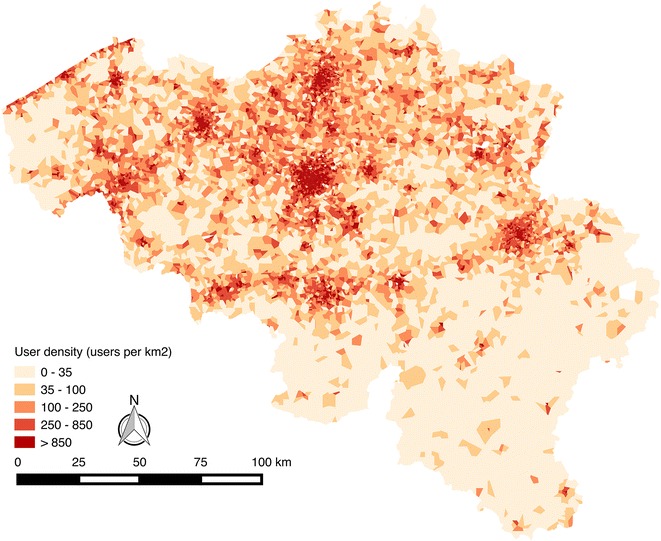
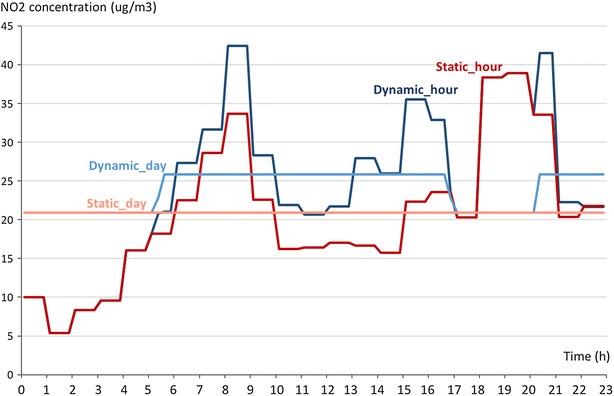
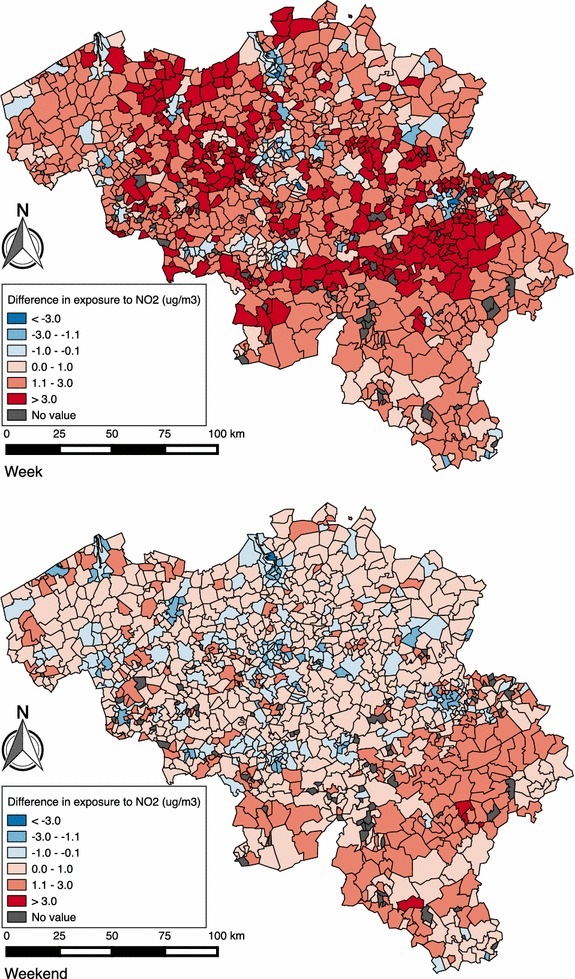
Methods: In this work, we present a novel approach to calculate the daily exposure to air pollution using mobile phone data of approximately 5 million mobile phone users living in Belgium. At present, this data is collected and stored by telecom operators mainly for management of the mobile network. Yet it represents a major source of information in the study of human mobility. We calculate the exposure to NO2 using two approaches: assuming people stay at home the entire day (traditional static approach), and incorporating individual travel patterns using their location inferred from their use of the mobile phone network (dynamic approach).
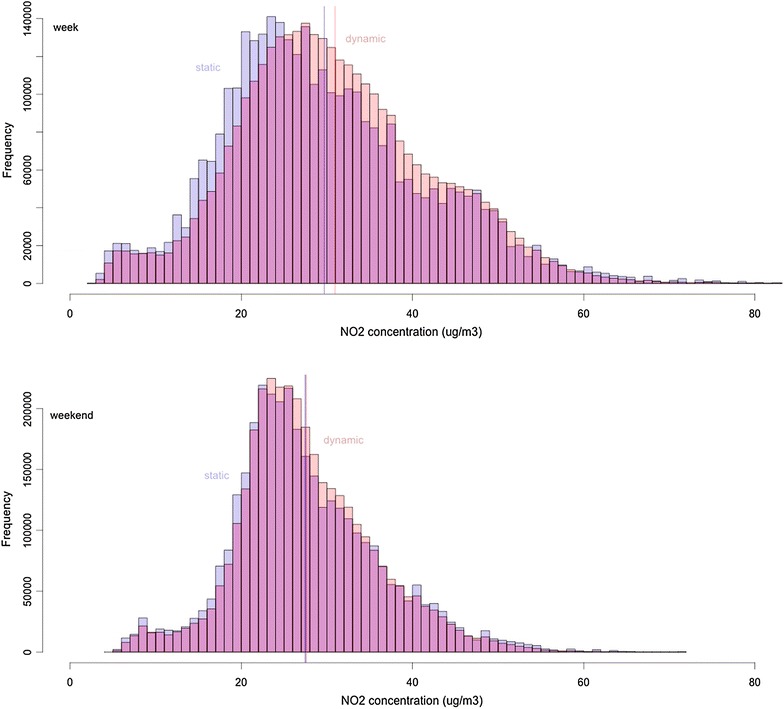
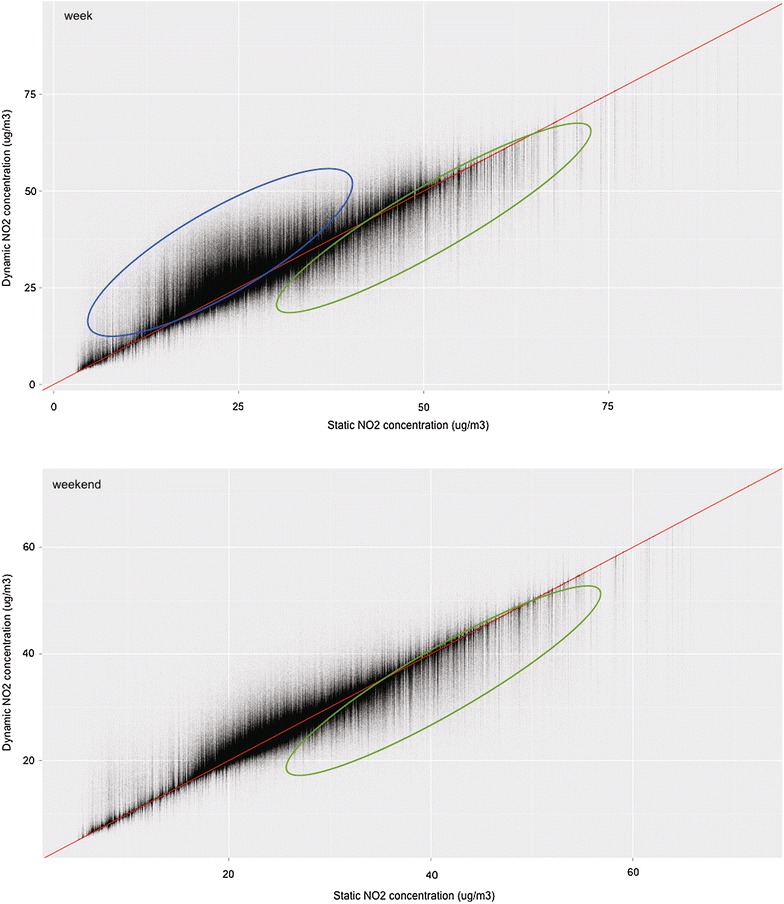
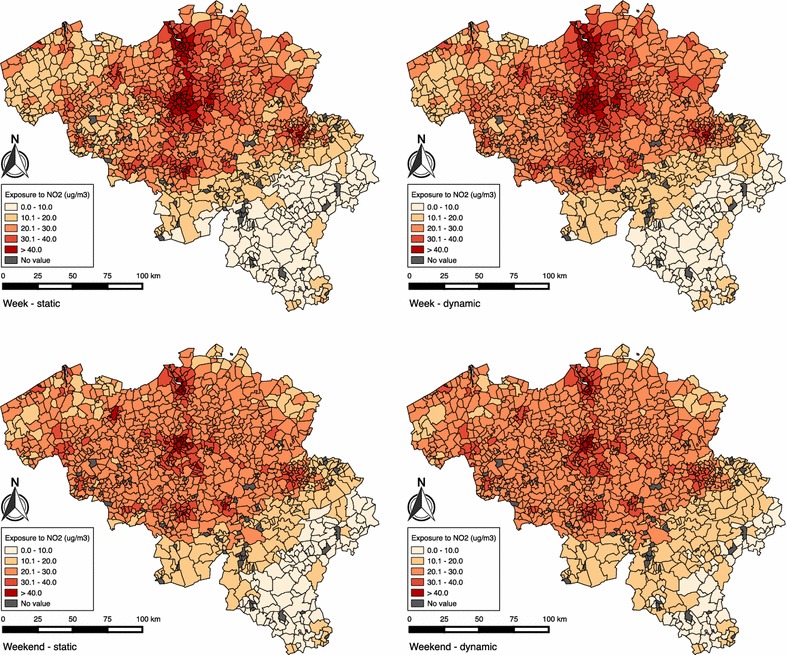
Results: The mean exposure to NO2 increases with 1.27 μg/m(3) (4.3%) during the week and with 0.12 μg/m(3) (0.4%) during the weekend when incorporating individual travel patterns. During the week, mostly people living in municipalities surrounding larger cities experience the highest increase in NO2 exposure when incorporating their travel patterns, probably because most of them work in these larger cities with higher NO2 concentrations.
Conclusions: It is relevant for health impact assessments and epidemiological studies to incorporate individual travel patterns in estimating air pollution exposure. Mobile phone data is a promising data source to determine individual travel patterns, because of the advantages (e.g. low costs, large sample size, passive data collection) compared to travel surveys, GPS, and smartphone data (i.e. data captured by applications on smartphones).
Keywords: Air pollution; Dynamic assessment; Exposure; Mobile phone data; Travel patterns.
Figures
References
-
- Beelen R, Stafoggia M, Raaschou-Nielsen O, Andersen ZJ, Xun WW, Katsouyanni K, Dimakopoulou K, Brunekreef B, Weinmayr G, Hoffmann B, Wolf K, Samoli E, Houthuijs D, Nieuwenhuijsen M, Oudin A, Forsberg B, Olsson D, Salomaa V, Lanki T, Yli-Tuomi T, Oftedal B, Aamodt G, Nafstad P, De Faire U, Pedersen NL, Östenson C-G, Fratiglioni L, Penell J, Korek M, Pyko A, et al. Long-term exposure to air pollution and cardiovascular mortality: an analysis of 22 European cohorts. Epidemiology. 2014;25:368–378. doi: 10.1097/EDE.0000000000000076. - DOI - PubMed
-
- Brook RD, Rajagopalan S, Pope CA, Brook JR, Bhatnagar A, Diez-Roux AV, Holguin F, Hong Y, Luepker RV, Mittleman MA, Peters A, Siscovick D, Smith SC, Whitsel L, Kaufman JD. Particulate matter air pollution and cardiovascular disease: an update to the scientific statement from the American Heart Association. Circulation. 2010;121:2331–2378. doi: 10.1161/CIR.0b013e3181dbece1. - DOI - PubMed
-
- HEI. Traffic-related air pollution: a critical review of the literature on emissions, exposure, and health effects. 2010. http://pubs.healtheffects.org/getfile.php?u=553. Accessed 13 Apr 2015.
Publication types
MeSH terms
Substances
LinkOut - more resources
Full Text Sources
Other Literature Sources
Medical
