

Genome-wide association studies for fatty acid metabolic traits in five divergent pig populations
- PMID: 27097669
- PMCID: PMC4838829
- DOI: 10.1038/srep24718
Genome-wide association studies for fatty acid metabolic traits in five divergent pig populations
Abstract
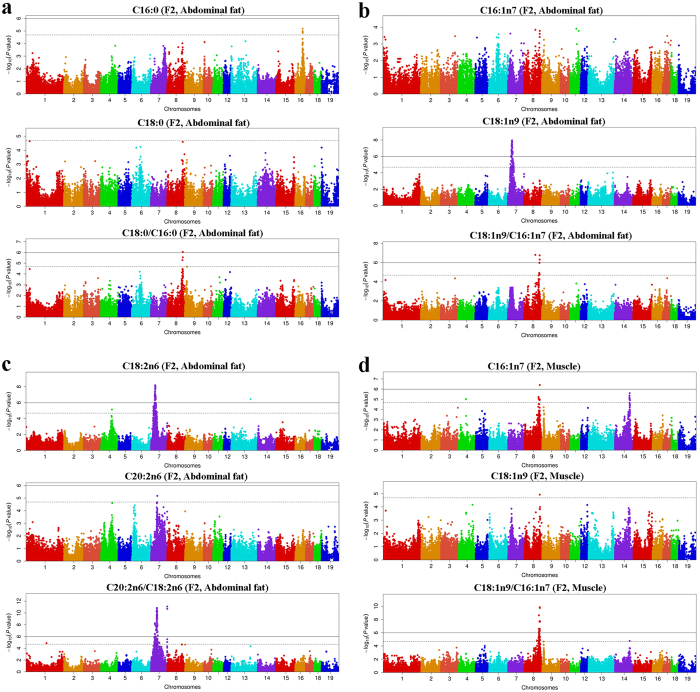
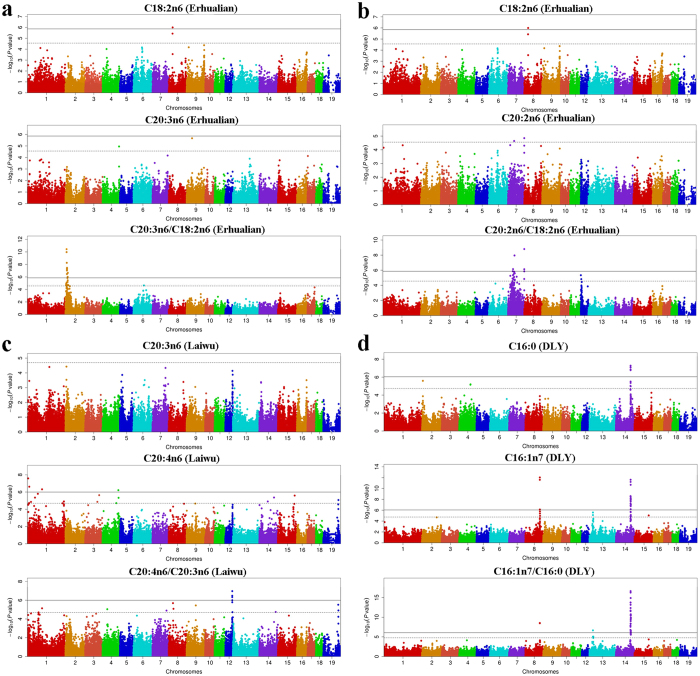
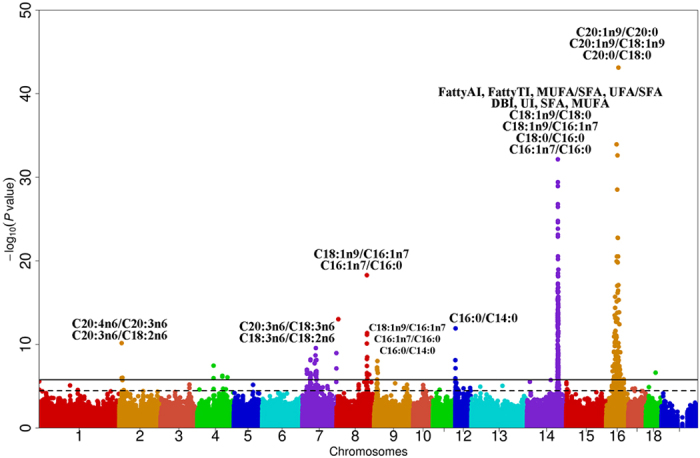
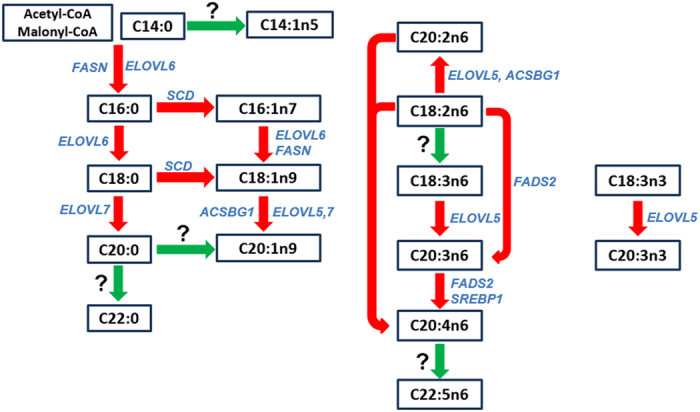
Fatty acid composition profiles are important indicators of meat quality and tasting flavor. Metabolic indices of fatty acids are more authentic to reflect meat nutrition and public acceptance. To investigate the genetic mechanism of fatty acid metabolic indices in pork, we conducted genome-wide association studies (GWAS) for 33 fatty acid metabolic traits in five pig populations. We identified a total of 865 single nucleotide polymorphisms (SNPs), corresponding to 11 genome-wide significant loci on nine chromosomes and 12 suggestive loci on nine chromosomes. Our findings not only confirmed seven previously reported QTL with stronger association strength, but also revealed four novel population-specific loci, showing that investigations on intermediate phenotypes like the metabolic traits of fatty acids can increase the statistical power of GWAS for end-point phenotypes. We proposed a list of candidate genes at the identified loci, including three novel genes (FADS2, SREBF1 and PLA2G7). Further, we constructed the functional networks involving these candidate genes and deduced the potential fatty acid metabolic pathway. These findings advance our understanding of the genetic basis of fatty acid composition in pigs. The results from European hybrid commercial pigs can be immediately transited into breeding practice for beneficial fatty acid composition.
Figures
Similar articles
-
Multi-breed genome-wide association study reveals novel loci associated with the weight of internal organs.Genet Sel Evol. 2015 Nov 17;47:87. doi: 10.1186/s12711-015-0168-7. Genet Sel Evol. 2015. PMID: 26576866 Free PMC article.
-
Genome-wide association study confirm major QTL for backfat fatty acid composition on SSC14 in Duroc pigs.BMC Genomics. 2017 May 11;18(1):369. doi: 10.1186/s12864-017-3752-0. BMC Genomics. 2017. PMID: 28494783 Free PMC article.
-
Genome-wide association study for conformation traits in three Danish pig breeds.Genet Sel Evol. 2017 Jan 24;49(1):12. doi: 10.1186/s12711-017-0289-2. Genet Sel Evol. 2017. PMID: 28118822 Free PMC article.
-
Genetics of Adiposity in Large Animal Models for Human Obesity-Studies on Pigs and Dogs.Prog Mol Biol Transl Sci. 2016;140:233-70. doi: 10.1016/bs.pmbts.2016.01.001. Epub 2016 Mar 5. Prog Mol Biol Transl Sci. 2016. PMID: 27288831 Review.
-
Current opportunities and challenges: genome-wide association studies on pigmentation and skin cancer.Pigment Cell Melanoma Res. 2012 Sep;25(5):612-7. doi: 10.1111/j.1755-148X.2012.01023.x. Epub 2012 Jul 12. Pigment Cell Melanoma Res. 2012. PMID: 22762390 Review.
Cited by
-
Effects of Adipose Tissue-Specific Knockout of Delta-like Non-Canonical Notch Ligand 1 on Lipid Metabolism in Mice.Int J Mol Sci. 2023 Dec 21;25(1):132. doi: 10.3390/ijms25010132. Int J Mol Sci. 2023. PMID: 38203302 Free PMC article.
-
Genome-Wide Association Study of Body Weight Traits in Chinese Fine-Wool Sheep.Animals (Basel). 2020 Jan 19;10(1):170. doi: 10.3390/ani10010170. Animals (Basel). 2020. PMID: 31963922 Free PMC article.
-
Application of GWAS and mGWAS in Livestock and Poultry Breeding.Animals (Basel). 2024 Aug 16;14(16):2382. doi: 10.3390/ani14162382. Animals (Basel). 2024. PMID: 39199916 Free PMC article. Review.
-
Genome-wide analysis of expression QTL (eQTL) and allele-specific expression (ASE) in pig muscle identifies candidate genes for meat quality traits.Genet Sel Evol. 2020 Oct 9;52(1):59. doi: 10.1186/s12711-020-00579-x. Genet Sel Evol. 2020. PMID: 33036552 Free PMC article.
-
Association of IFNA16 and TNFRSF19 Polymorphisms with Intramuscular Fat Content and Fatty Acid Composition in Pigs.Biology (Basel). 2022 Jan 10;11(1):109. doi: 10.3390/biology11010109. Biology (Basel). 2022. PMID: 35053107 Free PMC article.
References
-
- Wood J. D. et al. Fat deposition, fatty acid composition and meat quality: A review. Meat Sci 78, 343–358 (2008). - PubMed
-
- Fats and fatty acids in human nutrition. Report of an expert consultation. FAO Food Nutr Pap 91, 1–166 (2010). - PubMed
-
- Jimenez-Colmenero F., Ventanas J. & Toldra F. Nutritional composition of dry-cured ham and its role in a healthy diet. Meat Sci 84, 585–93 (2010). - PubMed
Publication types
MeSH terms
Substances
LinkOut - more resources
Full Text Sources
Other Literature Sources
Miscellaneous
