. 2016 Apr 21:6:24631.
doi: 10.1038/srep24631.

Perturbed rhythmic activation of signaling pathways in mice deficient for Sterol Carrier Protein 2-dependent diurnal lipid transport and metabolism

Affiliations

Perturbed rhythmic activation of signaling pathways in mice deficient for Sterol Carrier Protein 2-dependent diurnal lipid transport and metabolism

Céline Jouffe et al. Sci Rep. .

Abstract

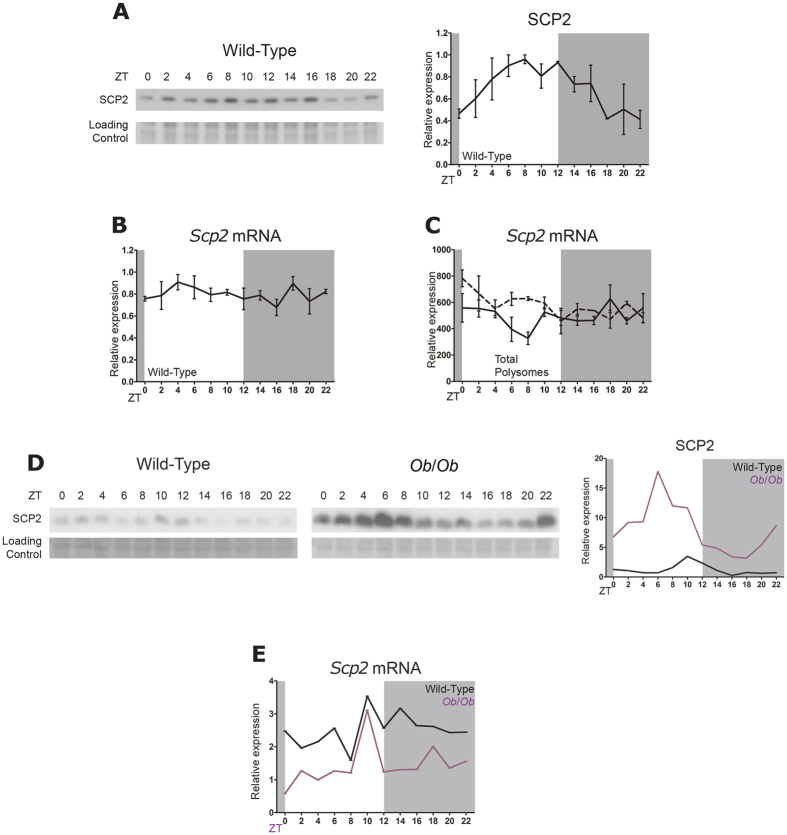
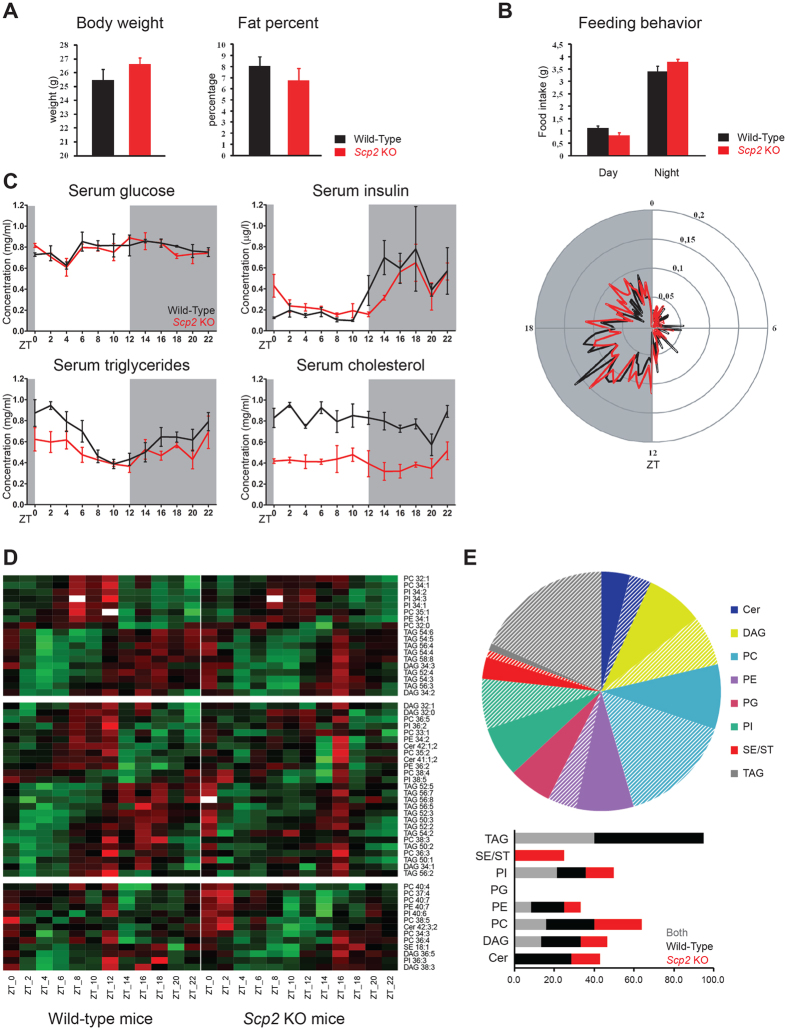
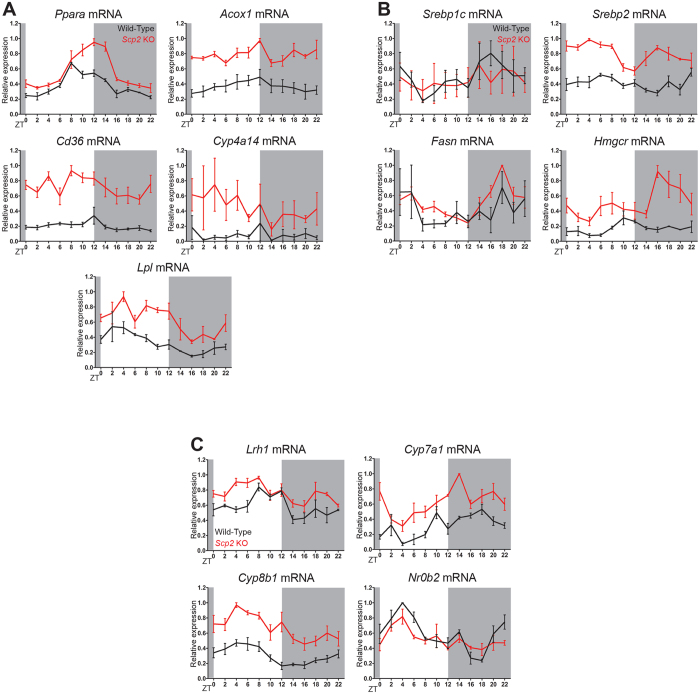
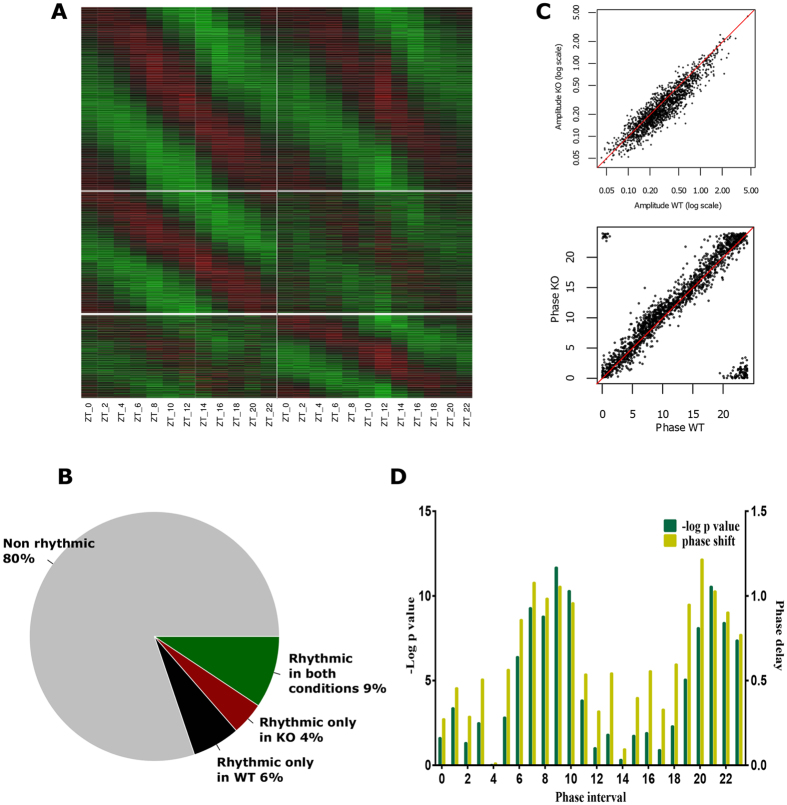
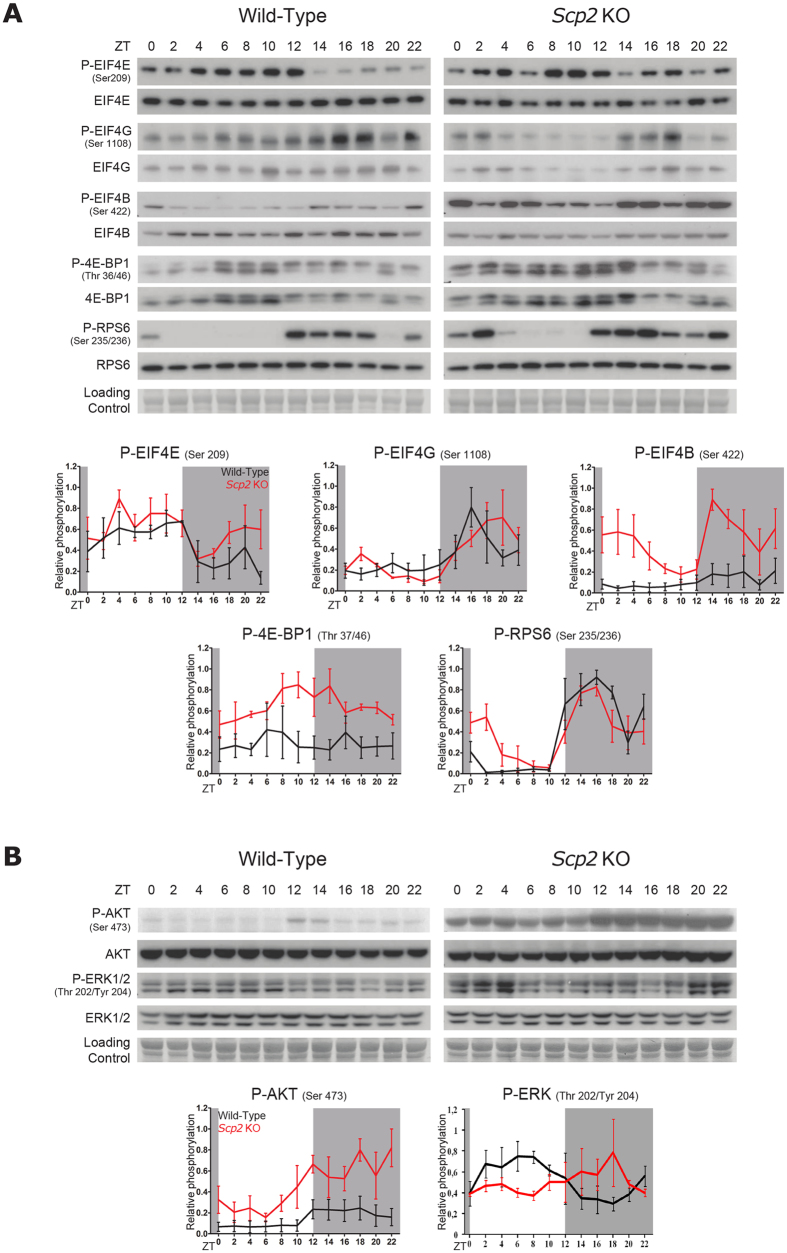
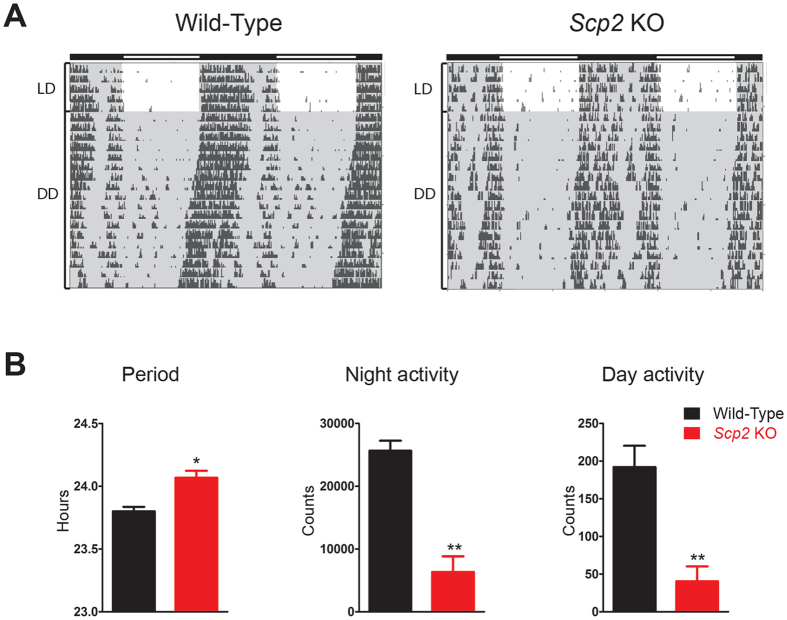
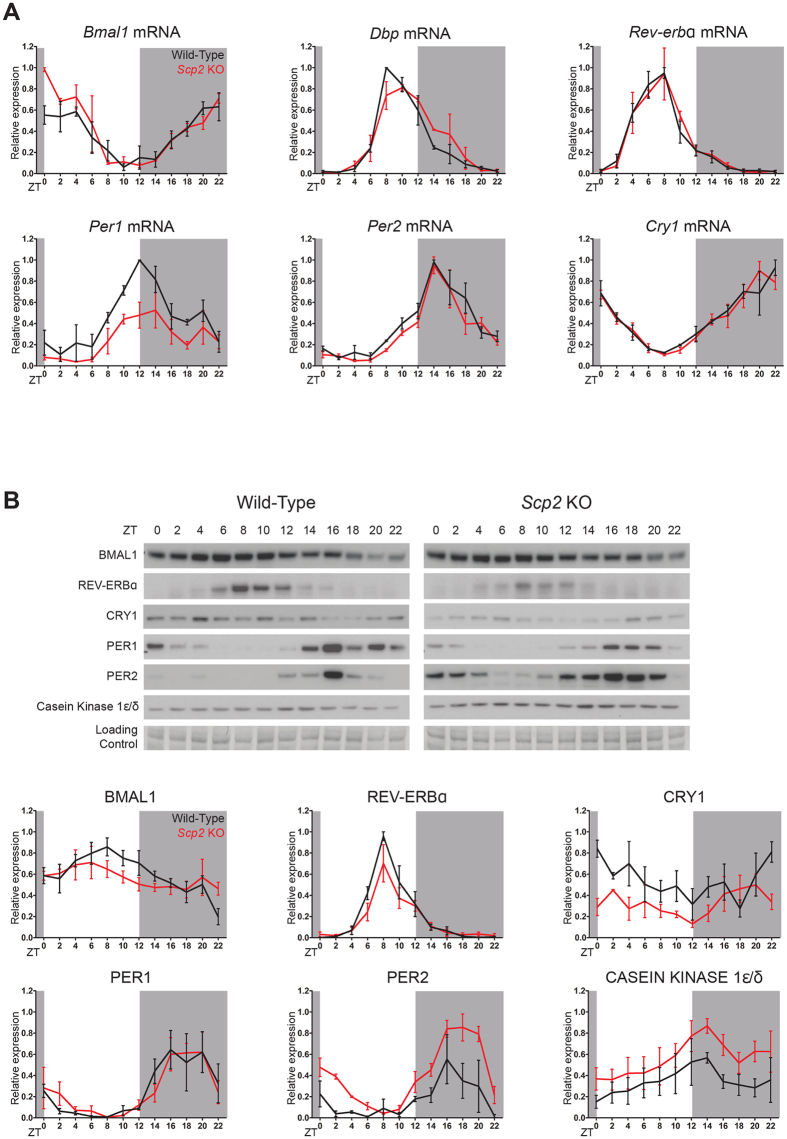
Through evolution, most of the living species have acquired a time keeping system to anticipate daily changes caused by the rotation of the Earth. In all of the systems this pacemaker is based on a molecular transcriptional/translational negative feedback loop able to generate rhythmic gene expression with a period close to 24 hours. Recent evidences suggest that post-transcriptional regulations activated mostly by systemic cues play a fundamental role in the process, fine tuning the time keeping system and linking it to animal physiology. Among these signals, we consider the role of lipid transport and metabolism regulated by SCP2. Mice harboring a deletion of the Scp2 locus present a modulated diurnal accumulation of lipids in the liver and a perturbed activation of several signaling pathways including PPARα, SREBP, LRH-1, TORC1 and its upstream regulators. This defect in signaling pathways activation feedbacks upon the clock by lengthening the circadian period of animals through post-translational regulation of core clock regulators, showing that rhythmic lipid transport is a major player in the establishment of rhythmic mRNA and protein expression landscape.


Conflict of interest statement

All authors are employees of Nestlé Institute of Health Sciences SA.

Figures

Figure 1
Figure 1. Diurnal accumulation of Sterol Carrier Protein 2.
The Zeitgeber Times (ZT), with ZT0: lights on, ZT12: lights off, at which the animals were sacrificed, are indicated on each panel. Night time restricted feeding (NF) or ad libitum feeding (AL) conditions are indicated in each individual cases. For all the panels, data for each time point are Mean ± SEM obtained from three independent animals. (A,D) Temporal accumulation of SCP2 in WT (NF) (A), Ob/Ob (AL) (D, purple line) and control (AL) (D, black line) mouse liver. Representative Western blots were realized on total liver extracts. Naphtol blue black staining of the membranes was used as a loading control. Each graph corresponds to the mean densitometric values of the associated western blots, normalized to the loading control. (B,E) Temporal mRNA accumulation of Scp2 mRNA in WT (NF) (B), Ob/Ob (AL) (E, purple line) and control (AL) (E, black line) mouse liver. (C) Temporal localization of Scp2 mRNA in the polysomal fraction of WT mouse liver (AL). Data are extracted from.
Figure 2
Figure 2. Perturbed metabolism in Scp2 KO mice.
The Zeitgeber Time (ZT) at which the animals were sacrificed is indicated on each panel. (A) Body weight (left panel) and fat percentage (right panel) measurements in Scp2 KO (red lines) and WT (black lines) mouse at ZT3 (AL). Data are Mean ± SEM obtained from five independent animals. (B) The amount of food consumed during the light and dark phases is represented in the upper graph and the radar plot (lower panel) shows the diurnal food consumption of the Scp2 KO (red lines) and WT (black lines) mouse fed AL for five days. Data are Mean ± SEM obtained from five independent animals. (C) Temporal serum concentration of glucose, insulin, triglycerides, and cholesterol in Scp2 KO (red lines) and WT (black lines) mouse (NF). Data are Mean ± SEM obtained from three independent animals. (D) Heatmap of the abundance of lipid species in Scp2 KO (right panels) and WT (left panels) liver (NF). First panel represents lipid species rhythmic in both animals, the second panel species rhythmic only in WT, and the last panel lipid rhythmic only in KO. Standardized relative abundance of each species is indicated in red (high) and green (low). Data are Mean obtained from two independent animals. (E) Upper panel: Pie chart representing for each lipid family the proportion of species that are cycling (hatching-colored) and non-cycling (full-colored) in at least one condition (WT, KO, or both). Lower panel: Proportions of cycling lipid species in Scp2 KO (red), WT (black), or both (grey) mouse liver.
Figure 3
Figure 3. Alteration of the activation of lipids regulated pathways in Scp2 KO mice.
The Zeitgeber Times (ZT) at which the animals were sacrificed are indicated on each panel. All the experiments have been conducted under NF conditions. For all the panels, data for each time point are Mean ± SEM obtained from three independent animals. (A) Temporal mRNA expression of Pparα and its regulated genes Acox1, Cd36, Cyp4a14 and Lpl in Scp2 KO (red line) and WT (black line) mouse liver. (B) Temporal mRNA expression of Srebp1c and Srebp2, and their regulated genes Fasn and Hmgcr in Scp2 KO (red line) and WT (black line) mouse liver. (C) Temporal mRNA expression of Lrh1 and its regulated genes Cyp7a1, Cyp8b1 and Nr0b2 in Scp2 KO (red line) and WT (black line) mouse liver.
Figure 4
Figure 4. Consequence of Scp2 deletion on rhythmic liver transcriptome.
The Zeitgeber Time (ZT) at which the animals were sacrificed is indicated on each panel. All the experiments have been conducted under NF conditions. (A) Heatmap of the cycling and non-cycling genes in Scp2 KO (right panels) and WT mouse (left panels) liver. First panel represents mRNA probes rhythmic in both animals, the second panel probes rhythmic only in WT, and the last panel probes rhythmic only in KO. Standardized relative expression is indicated in red (high) and green (low). Data are Mean obtained from three independent animals. (B) Pie chart representing the proportions of non-cycling (grey) and cycling mRNA probes in Scp2 KO (red), WT (black), or both (green) mouse liver. (C) Scatter plots representing the distribution of amplitudes (upper panel) and phases (lower panel) of rhythmic probes in Scp2 KO and WT mouse liver. (D) Representation of phase delay (hours) of rhythmic mRNA probes observed in Scp2 KO mouse liver compared to WT (yellow, right y axis) and their significance represented by the -Log of the t-test p-value of the hourly phase distribution of each probes between WT and KO mice (green, left axis).
Figure 5
Figure 5. Rhythmic activation of signaling pathways in Scp2 KO mice.
The Zeitgeber Times (ZT) at which the animals were sacrificed are indicated on each panel. All the experiments have been conducted under NF conditions. For all the panels, data for each time point are Mean ± SEM obtained from three independent animals. (A) Temporal protein accumulation and phosphorylation of translation initiation factors in Scp2 KO (right panel) and WT (left panel) mouse liver. Representative Western blots were realized on total liver extracts. Naphtol blue black staining of the membranes was used as a loading control. Each graph corresponds to the mean densitometric values of the associated western blots, normalized to the loading control. (B) Temporal protein accumulation and phosphorylation of representative proteins of key signaling pathways involved in the regulation of translation initiation in Scp2 KO (left panel) and WT (right panel) mouse liver. Representative Western blots were realized on total liver extracts. Naphtol blue black staining of the membranes was used as a loading control. Each graph corresponds to the mean densitometric values of the associated western blots, normalized to the loading control.
Figure 6
Figure 6. Influence of Scp2 deletion on the circadian activity.
(A) Representative circadian locomotor activity (running-wheel) of Scp2 KO (right panel) and WT (left panel) mice under AL feeding. (B) Bar charts representing the free running period (left panel), the night activity (middle panel), and the day activity (right panel) of Scp2 KO (red bars) and WT mice (black bars). Data are Mean obtained from six independent animals.
Figure 7
Figure 7. Influence of Scp2 deletion on the circadian clock.
The Zeitgeber Times (ZT) at which the animals were sacrificed are indicated on each panel. All the experiments have been conducted under NF conditions. For all the panels, data for each time point are Mean ± SEM obtained from three independent animals. (A) Temporal mRNA accumulation of Bmal1, Dbp, Rev-erbα, Per1, Per2, and Cry1 in Scp2 KO (red line) and WT (black line) mouse liver. (B) Temporal protein accumulation of BMAL1, REV-ERBα, CRY1, PER1, PER2 and CK1ε/δ in Scp2 KO (right panel) and WT (left panel) mouse liver. Representative Western blots were realized on nuclear liver extracts. Naphtol blue black staining of the membranes was used as a loading control. Each graph corresponds to the mean densitometric values of the associated western blots, normalized to the loading control.

Similar articles

Cited by

References

    1. Bass J. Circadian topology of metabolism. Nature 491, 348–356, doi: 10.1038/nature11704 (2012). - DOI - PubMed
    1. Dibner C. & Schibler U. Circadian timing of metabolism in animal models and humans. J Intern Med 277, 513–527, doi: 10.1111/joim.12347 (2015). - DOI - PubMed
    1. Mohawk J. A., Green C. B. & Takahashi J. S. Central and Peripheral Circadian Clocks in Mammals. Annu Rev Neurosci 35, 445–462, doi: 10.1146/annurev-neuro-060909-153128 (2012). - DOI - PMC - PubMed
    1. Feng D. & Lazar M. A. Clocks, Metabolism, and the Epigenome. Mol Cell 47, 158–167 (2012). - PMC - PubMed
    1. Asher G. & Schibler U. Crosstalk between Components of Circadian and Metabolic Cycles in Mammals. Cell Metab 13, 125–137, doi: 10.1016/j.cmet.2011.01.006 (2011). - PubMed

Publication types