. 2016 Apr 21:6:24637.
doi: 10.1038/srep24637.

Induction of Human iPSC-Derived Cardiomyocyte Proliferation Revealed by Combinatorial Screening in High Density Microbioreactor Arrays

Affiliations

Induction of Human iPSC-Derived Cardiomyocyte Proliferation Revealed by Combinatorial Screening in High Density Microbioreactor Arrays

Drew M Titmarsh et al. Sci Rep. .

Abstract

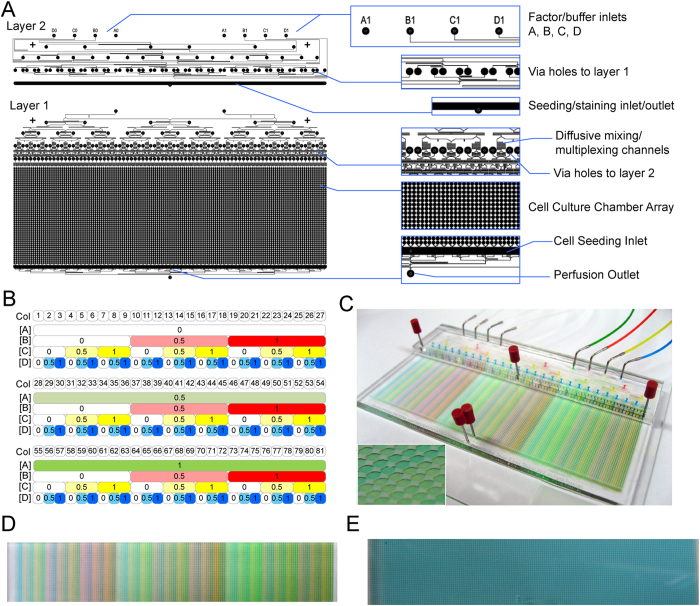
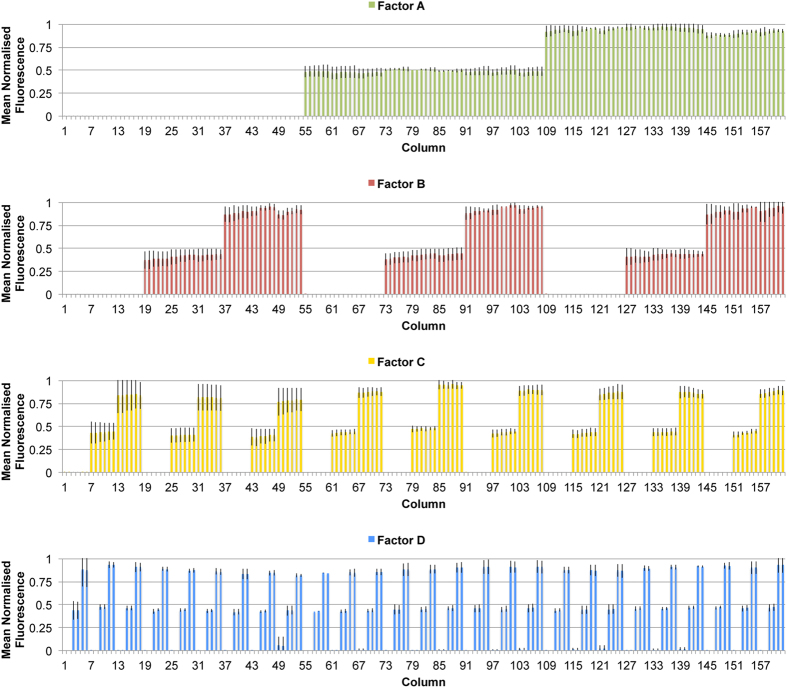
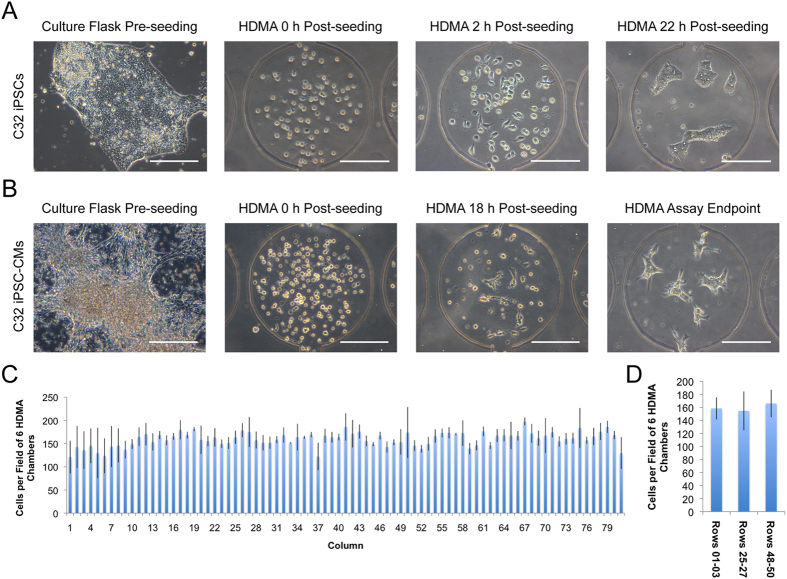
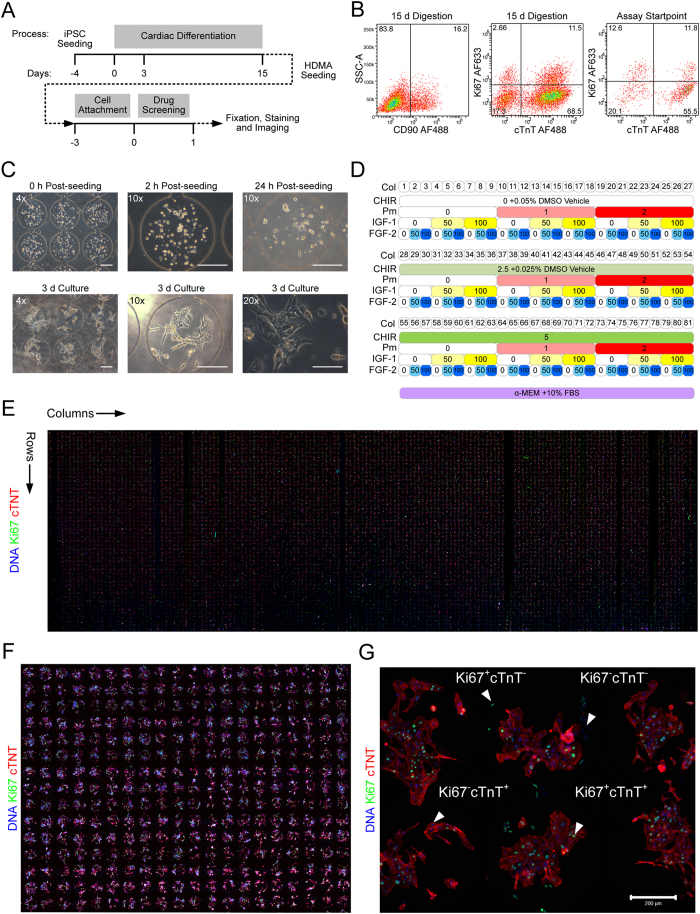
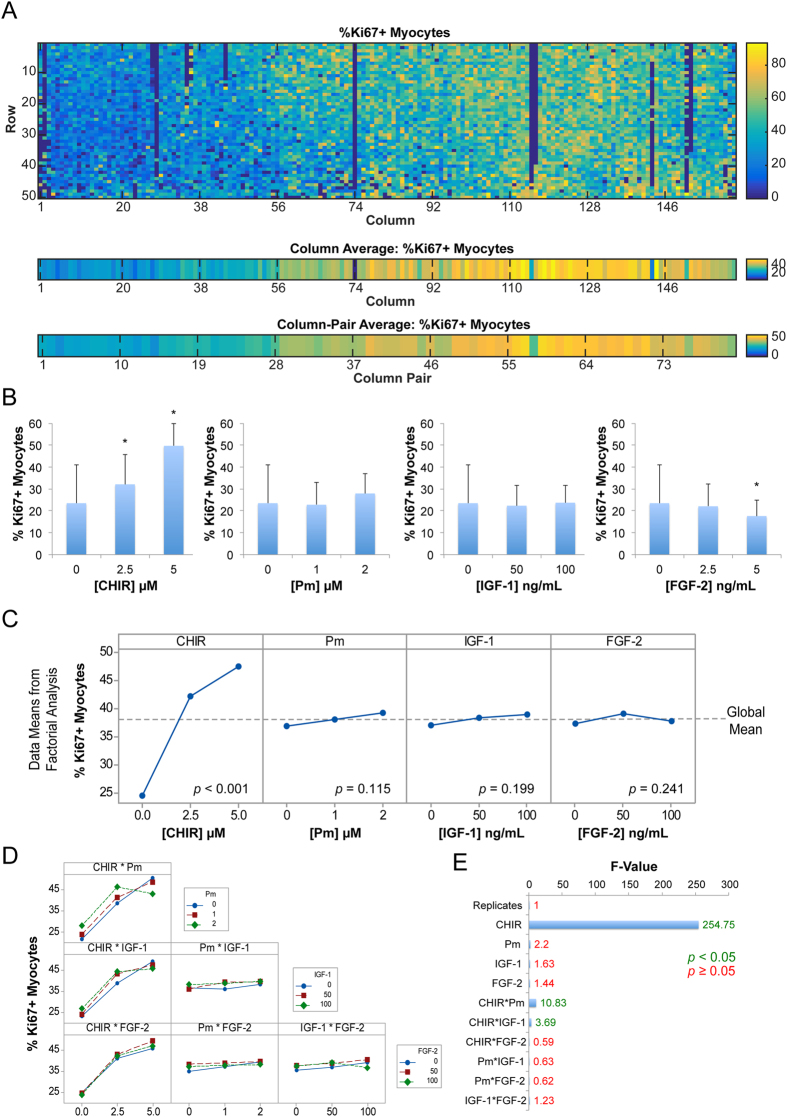
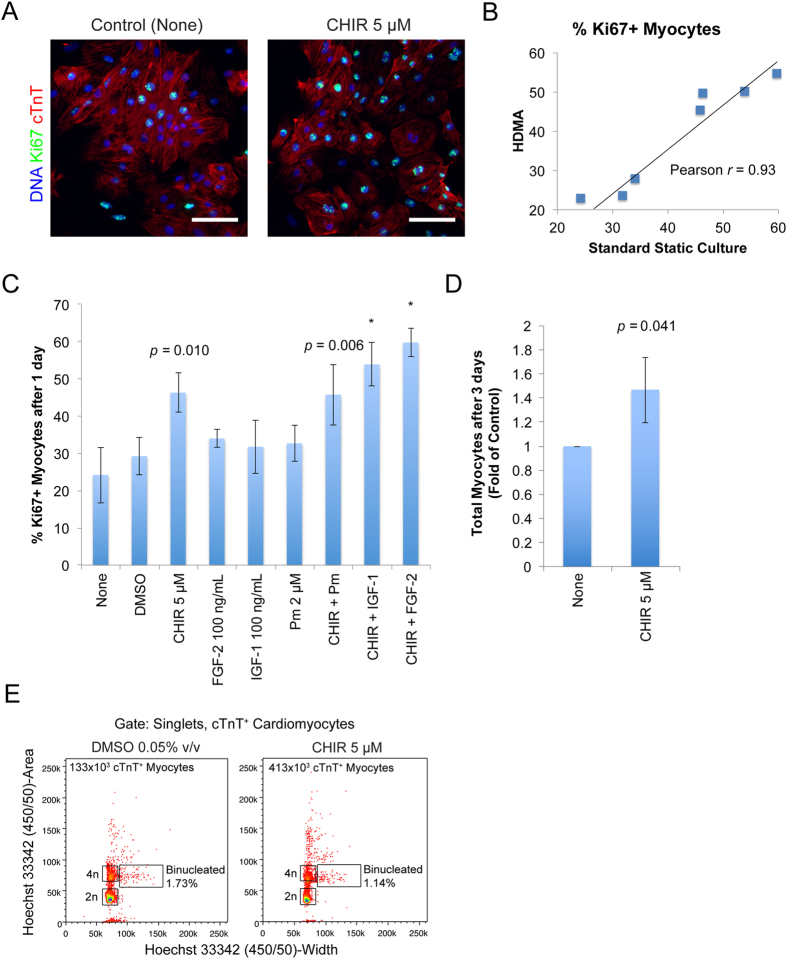
Inducing cardiomyocyte proliferation in post-mitotic adult heart tissue is attracting significant attention as a therapeutic strategy to regenerate the heart after injury. Model animal screens have identified several candidate signalling pathways, however, it remains unclear as to what extent these pathways can be exploited, either individually or in combination, in the human system. The advent of human cardiac cells from directed differentiation of human pluripotent stem cells (hPSCs) now provides the ability to interrogate human cardiac biology in vitro, but it remains difficult with existing culture formats to simply and rapidly elucidate signalling pathway penetrance and interplay. To facilitate high-throughput combinatorial screening of candidate biologicals or factors driving relevant molecular pathways, we developed a high-density microbioreactor array (HDMA)--a microfluidic cell culture array containing 8100 culture chambers. We used HDMAs to combinatorially screen Wnt, Hedgehog, IGF and FGF pathway agonists. The Wnt activator CHIR99021 was identified as the most potent molecular inducer of human cardiomyocyte proliferation, inducing cell cycle activity marked by Ki67, and an increase in cardiomyocyte numbers compared to controls. The combination of human cardiomyocytes with the HDMA provides a versatile and rapid tool for stratifying combinations of factors for heart regeneration.


Conflict of interest statement

The authors declare potential competing financial interests. The authors declare that Drew Titmarsh and Justin Cooper-White are listed as inventors on an International Patent Application related to the work, number WO 2,013,036,997. The authors declare no other competing financial interests.

Figures

Figure 1
Figure 1. HDMA Design and Validation.
(A) HDMA photomask design with key features marked. (B) Matrix of design normalised concentration levels for factors A–D, in each of the 81 column-pairs in the array. (C) Photograph of assembled device filled with green, red, yellow, and blue food dye solutions representing factors A–D, and PBS representing buffers A–D. Inset – magnified detail of cell culture chambers. (D) Photograph of cell culture array section as in Panel (C), showing detail of generated conditions. (E) Photograph of cell culture array showing complete fluid replacement after injection of blue dye from perfusion outlet.
Figure 2
Figure 2. HDMA Concentration Level Validation.
Fluorescence quantification in each of the 162 columns (81 column-pairs) in the array (corresponding to matrix in Fig. 1B), using 40 kDa FITC-dextran dye and quantitative fluorescence microscopy. Bars represent mean ± S.D. of n = 3 independent experiments including separately fabricated HDMA devices, and fluorescence is normalised to the blank (0) and maximum (1) fluorescence for that device/channel.
Figure 3
Figure 3. Cell seeding and attachment in HDMAs.
(A) Phase contrast micrographs of C32 iPSCs prior to and following seeding into HDMA. Scale bars: 200 μm. (B) Phase contrast micrographs of C32 iPSC-CMs from 15 d cardiac differentiations, prior to and following HDMA seeding. Scale bars: 200 μm. (C,D) Plots of the distribution of fixed, Hoechst-labelled HES3 hESCs after injection into HDMA at 2 × 106 cells/mL. Image fields containing 6 HDMA chambers (three rows of one column pair) were acquired and nuclei counted by image cytometry. Images fields were taken from the top (Rows 01-03), middle (Rows 25–27), and bottom (Rows 48–50) section of the device, and from each of the 81 column-pairs. Average numbers of cells detected per field of 6 chambers is shown, averaged along column pair (C; n = 3 row groups) and row group (D; n = 81 column pairs). Bars represent mean ± S.D. and data from one experiment is shown to highlight the variation present within an individual HDMA.
Figure 4
Figure 4. hPSC-derived Cardiomyocyte Proliferation Screening in the HDMA Platform.
(A) Experimental timeline used in the screen. (B) Representative flow cytometric analyses of cell population used in HDMA screening, with percentages marked. Dot plots of CD90+ stromal cell content from 15 d digestion of differentiated hPSCs; dot plots of Ki67 and cTnT expression in both 15 d digestion of differentiated hPSCs and cells replated for 2 d prior to assay startpoint. (C) Representative phase contrast micrographs of CMs before and after seeding, and cultured for up to 3 d with drug treatments, as indicated. Scale bars for indicated objective magnification: 4×, 200 μm; 10×, 200 μm; 20×, 100 μm. (D) Matrix of design culture conditions in each of the 81 column pairs in the array, for the screened factors: CHIR99021 (CHIR), μM; Purmorphamine (Pm), μM; IGF-1, ng/mL; FGF-2, ng/mL. DMSO was included so as to be at a uniform total concentration of 0.05% v/v in the CHIR channels, acting as a vehicle control. (E) Tile-scan confocal image of the entire HDMA (~91 × 28 mm) treated for 24 h and used in further analysis, after fixation and in situ immunostaining for Ki67, cTnT and DNA. (F) Higher-magnification confocal image of subsection of replicate HDMA treated for 3 d, showing cell population arrangement in arrayed culture chambers. (G) Confocal image showing detail of individual HDMA chambers from replicate HDMA treated for 3 d, demonstrating presence of various proliferating (Ki67+) and non-proliferating (Ki67) myocyte (cTnT+) and nonmyocyte (cTnT) populations. Scale bar: 200 μm.
Figure 5
Figure 5. High-Content Screening and Factorial Analysis of Myocyte Proliferation in HDMA.
(A) Top panel: Heatmap showing percentages of Ki67+ proliferating cardiomyocytes in each of the 8100 chambers in the HDMA. Lower panels: Heatmaps of mean values of %Ki67+ myocytes in each column and column-pair in the HDMA. (B) Data from individual column-pairs representing treatment with individual factors in HDMA. Bars represent mean and error bars represent S.D. of 50 rows from each column-pair where corresponding chambers in the 2 replicate columns are averaged. *indicates p < 0.05 versus control (no factors) by unpaired two-tailed t-test. (C) Plots of individual factor effects as calculated by factorial analysis. The global mean across all HDMA conditions is shown. p-values for factor effect significance shown are calculated by MINITAB for each factor. (D) Plots of interaction effects for combinations of two factors. Concentrations are as in Panel (C). (E) Plot of F-value from factorial analysis showing variation explained by individual factors and combinations of 2 factors, with F-value marked for each. Green represents p < 0.05, red represents p ≥ 0.05.
Figure 6
Figure 6. Confirmation of HDMA Screen Results in Standard Static Cultures.
(A) Confocal fluorescence images of Ki67 expression in myocyte population after 24 h treatment with Control medium or medium containing 5 μM CHIR. Scale bar: 100 μm. (B) Scatterplot of results from HDMA individual column-pairs against conditions tested in standard static culture, with linear regression and correlation coefficient marked. (C) Quantification of percentage Ki67+ myocytes after 24 h treatment in static cultures. Bars represent mean ± S.D. of 2–3 independent experiments including separate cardiomyocyte inductions. *indicates p < 0.05 by one-way ANOVA with Tukey post-hoc tests vs. None condition. No other differences were significant. p-values (paired two-tailed t-test) against None condition are indicated for treatments with large effect magnitudes. (D) Quantification of total myocytes after treatment for 3 days with Control (None) medium or medium containing 5 μM CHIR. Bars represent mean ± S.D. of 4 independent experiments including inductions, normalised to control (None) condition. p-value (paired two-tailed t-test) indicated. (E) Quantification of percentage of binucleated cardiomyocytes after treatment for 3 days with Control (DMSO 0.05% v/v) medium or medium containing 5 μM CHIR. Dotplot from flow cytometric analysis of nuclear staining (Hoechst 33342) pulsewidth versus pulse area. Gating is on singlets by FSC and SSC area, height and width, and cTnT+ cardiomyocytes. Total number of cTnT+ myocytes estimated from cell counting and percentage cTnT+ content is marked.

References

    1. Takahashi K. et al. Induction of Pluripotent Stem Cells from Adult Human Fibroblasts by Defined Factors. Cell 131, 861–872 (2007). - PubMed
    1. Thomson J. A. et al. Embryonic Stem Cell Lines Derived from Human Blastocysts. Science 282, 1145–1147 (1998). - PubMed
    1. Burridge Paul W., Keller G., Gold, Joseph D. & Wu Joseph C. Production of De Novo Cardiomyocytes: Human Pluripotent Stem Cell Differentiation and Direct Reprogramming. Cell Stem Cell 10, 16–28 (2012). - PMC - PubMed
    1. Burridge P. W. et al. Chemically defined generation of human cardiomyocytes. Nat. Methods 11, 855–860 (2014). - PMC - PubMed
    1. Harris K. et al. Comparison of Electrophysiological Data From Human-Induced Pluripotent Stem Cell–Derived Cardiomyocytes to Functional Preclinical Safety Assays. Toxicol. Sci. 134, 412–426 (2013). - PubMed

Publication types

MeSH terms