. 2016 Apr 21:7:11304.
doi: 10.1038/ncomms11304.

Real-time quantification of protein expression at the single-cell level via dynamic protein synthesis translocation reporters

Affiliations

Real-time quantification of protein expression at the single-cell level via dynamic protein synthesis translocation reporters

Delphine Aymoz et al. Nat Commun. .

Abstract

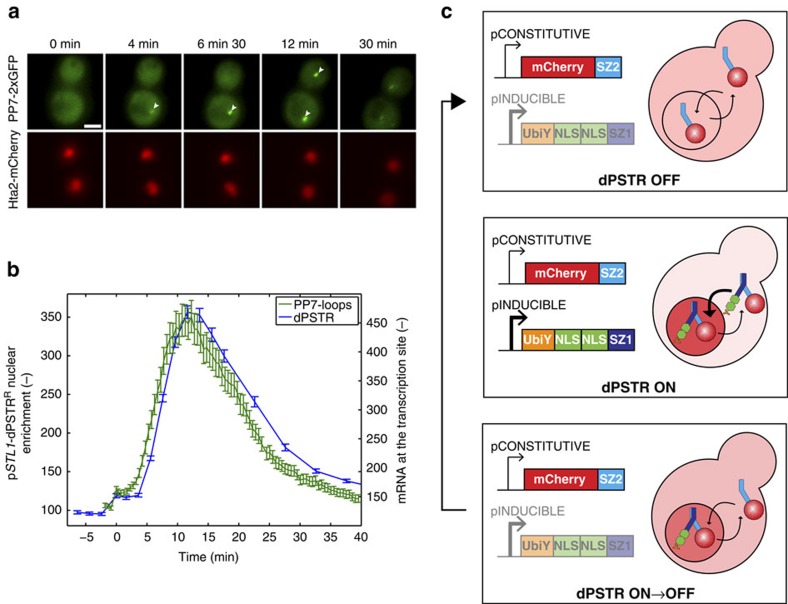
Protein expression is a dynamic process, which can be rapidly induced by extracellular signals. It is widely appreciated that single cells can display large variations in the level of gene induction. However, the variability in the dynamics of this process in individual cells is difficult to quantify using standard fluorescent protein (FP) expression assays, due to the slow maturation of their fluorophore. Here we have developed expression reporters that accurately measure both the levels and dynamics of protein synthesis in live single cells with a temporal resolution under a minute. Our system relies on the quantification of the translocation of a constitutively expressed FP into the nucleus. As a proof of concept, we used these reporters to measure the transient protein synthesis arising from two promoters responding to the yeast hyper osmolarity glycerol mitogen-activated protein kinase pathway (pSTL1 and pGPD1). They display distinct expression dynamics giving rise to strikingly different instantaneous expression noise.


Figures

Figure 1
Figure 1. Dynamic measurements of protein synthesis with a translocation reporter.
(a) A FP is fused to a SynZip (SZ2), expressed under the control of a constitutive promoter and can freely diffuse between the cytoplasm and the nucleus (dPSTR OFF, top). The induction of the promoter of interest drives the expression of the second peptide of the reporter, composed of two NLSs fused to a compatible SynZip (SZ1). The strong interaction between the SynZip peptides leads to the enrichment of the FP in the nucleus (dPSTR ON, bottom). (b) Microscopy images of cells with histone Hta2 tagged with CFP and carrying the pSTL1-dPSTRR submitted to a 0.2 M NaCl stress. The inducible peptide is fused to a Venus FP. Scale bar, 5 μm. (c,d) Quantifications of the nuclear enrichment in the dPSTRR (c) and the Venus (d) channels for cells stressed with 0 (orange, NC=285), 0.1 (cyan, NC=266), 0.2 (blue, NC=294) or 0.4 M NaCl (red, NC=265). Nuclear enrichment is measured as the difference between nuclear and cytoplasmic fluorescence for each single cell. For all similar graphs throughout the paper, the solid lines represent the population average and the error bars are the s.e.m. NC represents the number of single cells measured. (e) Histograms of the time needed for each single cell to reach half of its expression output for either the dPSTRR (solid lines) or the Venus (dashed lines). The expression output represents the maximal amplitude of the nuclear enrichment (see Methods). (f) Single cell correlation of the expression output measured by either the pSTL1-dPSTRR or the pSTL1-Venus assay, for control cells (orange) or cells induced with 0.2 M NaCl (blue). The dashed lines represent the expression thresholds, above which cells are considered as expressing. All the figures of the paper represent one representative experiment of at least three biological replicates.
Figure 2
Figure 2. Measurements of transient gene expression.
(a) Maximum intensity projections from Z-stacks of cells bearing an Hta2-mCherry tag and transformed with the PP7-2xGFP system with 24 mRNA PP7-stem loops under the control of the STL1 promoter stimulated with 0.2 M NaCl. The presence of transcription site in the nucleus is highlighted by white arrowheads. Scale bar represents 5 μm. (b) Comparison between the mRNA apparition at the transcription site using the PP7-2xGFP (green, NC=285) and the unstable pSTL1-dPSTRR nuclear enrichment (blue, NC=655) in two different strains, under stimulation by 0.2 M NaCl. The fluorescence of the transcription site was quantified by measuring the difference between the 20 brightest pixels in the nucleus and the average nuclear fluorescence. (c) The dPSTR was modified to measure transient gene expression by addition of an UbiY destabilization sequence at the N-terminus of the induced peptide (2xNLS-SZ). The degradation of the induced construct allows the FP to recover its initial homogenous distribution throughout the cell after stimulation.
Figure 3
Figure 3. Lack of correlation between Hog1 activity and pSTL1 expression at the single-cell level.
(a) Microscopy images of a strain with Hog1 tagged with mCitrine and carrying the unstable pSTL1-dPSTRR that was challenged by 0.2 M NaCl. The nuclear accumulation of Hog1-YFP precedes protein expression. Scale bar, 5 μm. (bd) Quantification of the cell area (b) Hog1 nuclear accumulation, measured as the ratio between nuclear and cytoplasmic YFP fluorescence (c) and pSTL1-dPSTRR nuclear enrichment (d) for cells stimulated with 0 (orange, NC=467), 0.1 (cyan, NC=558), 0.2 (blue, NC=655) and 0.4 M NaCl (red, NC=802). (e) Scatter plot of the signalling output measured as the integral below the Hog1 nuclear accumulation curve versus the expression output measured as the maximum in pSTL1-dPSTRR nuclear enrichment. The dashed line represents the expression threshold. The mean signalling output versus the mean expression output for the expressing cells (filled circles) and the non-expressing cells (empty circles) is plotted in the inset. The size of the marker is indicative of the percentage of cell in each category. (f) Correlation between the time needed to overcome the expression threshold and the expression output. The mean expression output and the standard deviation were calculated for groups of cells, which exceed the expression threshold at the same time point. The marker size is indicative of the percentage of cells (from the total population) in each group.
Figure 4
Figure 4. Dynamic measurements of the induction of two osmostress responsive promoters in the same cells.
(a) Microscopy images of cells carrying pGPD1-dPSTRR (RFP channel) and pSTL1-dPSTRY (YFP channel) stimulated with 0.2 M NaCl. The two reporters are built with two orthogonal pairs of SynZips. The arrowheads indicate the nuclei with accumulated FPs, highlighting the different timings of accumulation of each dPSTR. Scale bar, 5 μm. (b) Quantification of the nuclear enrichment of pGPD1-dPSTRR (green, left axis) and pSTL1-dPSTRY (purple, right axis) in course of time (NC=260). (c) Histograms of the time needed to overcome the expression threshold for cells expressing the indicated promoter. (d) Correlation between the expression output of pGPD1-dPSTRR and the one of pSTL1-dPSTRY in single cells (R2=0.48). The dashed lines represent the expression thresholds for each dPSTR. The inset is showing the fraction of the population expressing either pGPD1 alone (cyan), pSTL1 alone (red), both promoters (blue) or none (orange). (e) The delay between pGPD1 and pSTL1 expression in cells that express both dPSTRs calculated from the difference in time to overcome the expression threshold for both reporters. Positive times represent cells where pGPD1 overcomes the expression threshold first (green area, 76% of the cells expressing both promoters), and negative or null times indicates that pSTL1 is expressed before or at the same time as pGPD1 (purple, 24%).
Figure 5
Figure 5. Measurement of the dynamic evolution of intrinsic and extrinsic expression noise of pSTL1 and pGPD1.
(a,b) Quantification of the nuclear enrichment of dPSTRR (right axis) and dPSTRY (left axis) for a strain carrying two pSTL1-dSPTRs (a) or two pGPD1-dPSTRs (b) in cells stimulated with 0.2 M NaCl (resp. NC=958 and NC=368). (c,d) Correlation of the instantaneous corrected nuclear enrichment of pGPD1-dPSTRs (c) or pSTL1-dPSTRs (d) in YFP and RFP channels at the indicated times after induction. Pictures indicate representative cells at the same time points. Arrowheads are highlighting nuclei in the focal plane Scale bars, 5μm. (e,f) Evolution of the intrinsic expression noise for pGPD1 (e) and pSTL1 (f). The blue area under the curve represents the proportion of intrinsic noise, and the yellow area above represents the proportion of extrinsic noise.
Figure 6
Figure 6. Consecutive hyper-osmotic stresses result in uncorrelated transcription events.
(a) Evolution of the NaCl concentration over time. Cells were stimulated at time 0 with a given concentration of NaCl. A second hyper-osmotic stress of similar amplitude was performed 43 min later by doubling the concentration of NaCl in the well: 0.1→0.2 (orange), 0.15→0.3 (cyan), 0.2→0.4 (blue) (throughout the entire figure). (b,c) Quantification of the average Hog1 nuclear accumulation (b) and pSTL1-dPSTRR nuclear enrichment (c) for cells subjected to the steps in NaCl concentrations depicted in (a) (0.1→0.2: NC=429; 0.15→0.3: NC=450; 0.2→0.4: NC=449). (d) Quantification of the average pGPD1-dPSTRR nuclear enrichment, from a different strain, subjected to the steps in NaCl concentrations depicted in a (0.1→0.2: NC=235; 0.15→0.3: NC=296; 0.2→0.4: NC=276). These cells also bear Hog1-YFP that showed the same behaviour as in b. (eg) Correlations of the signalling outputs (e), of the expression outputs of pSTL1-dPSTRR (f) or of the expression outputs of pGPD1-dPSTRR (g) for the two stress events.

Similar articles

Cited by

References

    1. de Nadal E., Ammerer G. & Posas F. Controlling gene expression in response to stress. Nat. Rev. Genet. 12, 833–845 (2011) . - PubMed
    1. Weake V. M. & Workman J. L. Inducible gene expression: diverse regulatory mechanisms. Nat. Rev. Genet. 11, 426–437 (2010) . - PubMed
    1. Kadonaga J. T. Regulation of RNA polymerase II transcription by sequence-specific DNA binding factors. Cell 116, 247–257 (2004) . - PubMed
    1. Knight B. et al.. Two distinct promoter architectures centered on dynamic nucleosomes control ribosomal protein gene transcription. Genes Dev. 28, 1695–1709 (2014) . - PMC - PubMed
    1. Dadiani M. et al.. Two DNA-encoded strategies for increasing expression with opposing effects on promoter dynamics and transcriptional noise. Genome Res. 23, 966–976 (2013) . - PMC - PubMed

Publication types

MeSH terms

Substances