. 2016 Apr 21:6:24307.
doi: 10.1038/srep24307.

From molecular interaction to acute promyelocytic leukemia: Calculating leukemogenesis and remission from endogenous molecular-cellular network

Affiliations

From molecular interaction to acute promyelocytic leukemia: Calculating leukemogenesis and remission from endogenous molecular-cellular network

Ruoshi Yuan et al. Sci Rep. .

Abstract

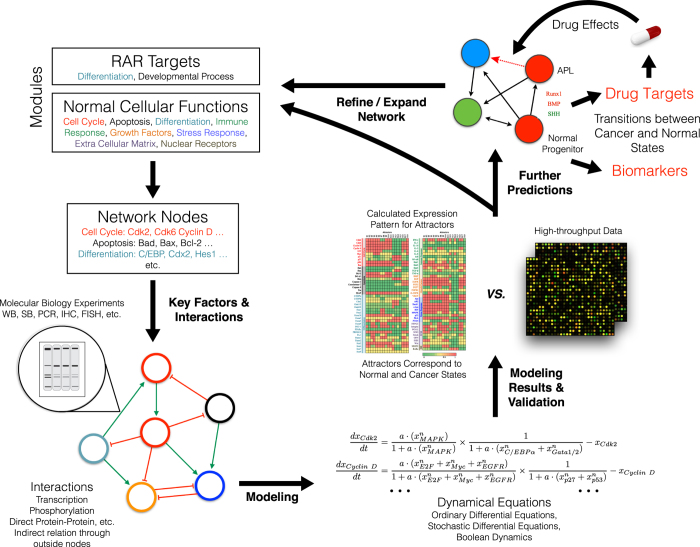
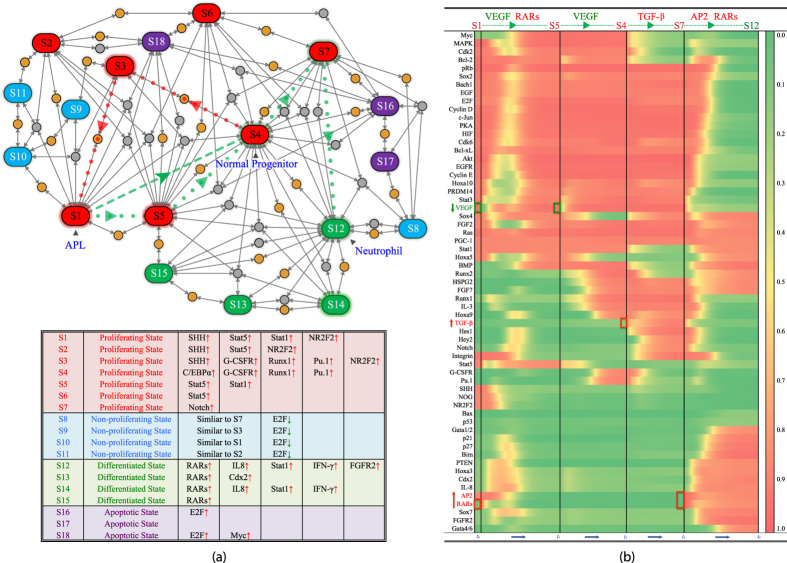
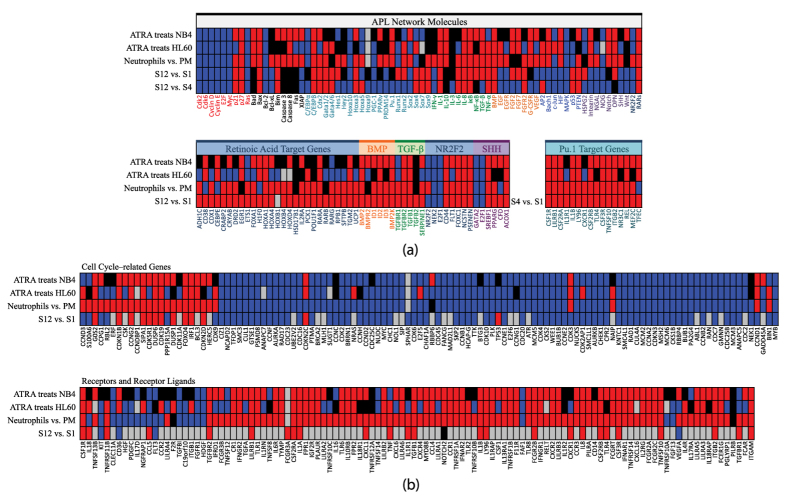
Acute promyelocytic leukemia (APL) remains the best example of a malignancy that can be cured clinically by differentiation therapy. We demonstrate that APL may emerge from a dynamical endogenous molecular-cellular network obtained from normal, non-cancerous molecular interactions such as signal transduction and translational regulation under physiological conditions. This unifying framework, which reproduces APL, normal progenitor, and differentiated granulocytic phenotypes as different robust states from the network dynamics, has the advantage to study transition between these states, i.e. critical drivers for leukemogenesis and targets for differentiation. The simulation results quantitatively reproduce microarray profiles of NB4 and HL60 cell lines in response to treatment and normal neutrophil differentiation, and lead to new findings such as biomarkers for APL and additional molecular targets for arsenic trioxide therapy. The modeling shows APL and normal states mutually suppress each other, both in "wiring" and in dynamical cooperation. Leukemogenesis and recovery under treatment may be a consequence of spontaneous or induced transitions between robust states, through "passes" or "dragging" by drug effects. Our approach rationalizes leukemic complexity and constructs a platform towards extending differentiation therapy by performing "dry" molecular biology experiments.


Figures

Figure 1
Figure 1. Outline of endogenous molecular-cellular network construction and modeling of APL.
Network construction: we start with summarizing retinoic acid targets as well as normal cellular functions at modular level. We choose key nodes in each module with reference to previous cancer models to construct a minimal core network presenting basic cellular functions. Endogenous agents (genes, molecules, or pathways) specific for myeloid development, such as transcription factors Pu.1, C/EBPβ, Runx1, and signaling pathways Stat1/5 are included in the network. The interactions between agents are collected from a large amount of literature supported by solid molecular biology experiments. Feedbacks related to embryonic development, especially those regulated by retinoic acid are included. Analysis of the network: we use dynamical equations to calculate attractors formed by the network structure. We run random parameter tests to demonstrate the results are robust. Comparison with high-throughput data further validates our modeling. Mechanism: In this context, APL as well as normal phenotypes correspond to attractors of the network dynamics. We find that SHH, BMP, and VEGF pathways are indispensable for the network to form the APL-like attractor. Leukemogenesis may be understood as a transition from normal states to APL state due to an accumulation of internal fluctuations or external perturbations. Induced switching from APL-like attractor thus represents differentiation therapy. Further predictions: we make a series of “dry experiments” on the endogenous network. We predict drug targets based on systematic perturbations of APL-like state to a normal state. Biomarkers can be recognized as differentially expressed agents or their downstream genes from the calculated molecular profiles of the attractors. Drug effects may also be tested through the overall influence of a drug on targeted agents.
Figure 2
Figure 2. Molecular interactions in the APL network.
Molecules and pathways are grouped according to their roles in cell cycle, apoptosis, growth factors, differentiation, immune response and stress response. NR: nuclear receptors. ECM: molecules and pathways interact with extracellular matrix. Detailed description and references are shown in Supplementary Information.
Figure 3
Figure 3. Molecular profiles of the attractors in the dynamical model of the network given in Fig. 2.
The corresponding equations are listed in Supplementary Information. S1–S7 represent proliferating phenotypes. S1 is APL-like. S4 is normal progenitor-like. S2 is similar to S1. S3 is an intermediate phenotype between S2 and S4. S5 is an intermediate phenotype between S1 and S4. S7 is an intermediate phenotype between S4 and a differentiated state S12. S8–S11 are non-proliferating, which are otherwise similar to S1, S2, S3 and S7. S12–S15 are differentiated phenotypes. S16–S18 are apoptotic.
Figure 4
Figure 4. Effective network of APL-like and normal progenitor-like attractors and induced switching between them.
(a) Effective sub-networks for APL-like and normal progenitor-like attractors, S1 and S4 in Fig. 3. The effective sub-networks are obtained by selecting active nodes (>0.5) in S1 and S4 and their molecular interactions. Within blue/orange dotted lines are the nodes active in S1/S4. Solid green/red lines represent activation/inhibition. Double arrowed green/red lines denote mutual activation/inhibition. These two attractors have both common active nodes and distinct ones. Inhibitory interactions dominate the differential ones in these two attractors such as those among BMP, Runx1, Stat5 and SHH. (b) Induced switching from APL-like attractor S1 to normal progenitor-like attractor. Starting from APL-like attractor S1, at time t = t0, values of three nodes are changed to: SHH = 0, Runx1 = 1, BMP = 1. Trajectory of the time course shows that after such an induction, the state of the network will switch from S1 to S4. The trajectory of differentially expressed nodes during the switching process is shown in this graph.
Figure 5
Figure 5. Attractors connected by saddle/unstable fixed points on the potential landscape and switches between attractors.
(a) Attractors linked by saddle/unstable fixed points. In addition to attractors, the dynamical model also contains saddles and other unstable fixed points. S1–S18 are attractors, as shown in Fig. 3 and briefly summarized in a table below. The saddle points are yellow dots and other unstable fixed points are grey dots. When perturbed, saddle/unstable fixed points flow to attractors. The flows from saddle/unstable fixed points to attractors are represented by grey arrowed lines. The red dotted lines demonstrate a possible route (leukemogenesis) to APL-like attractor S1 from normal progenitor-like attractor S4 through saddle points and S3. An induced switch from S1 to S4 as discussed in Fig. 4(b) is drawn with a green dashed line. The green dotted lines demonstrate an alternative route to induce APL-like attractor S1 to normal progenitor-like attractor S4, and then continue to induce to differentiated-like attractors. Switching from S1 to S4 via S5 is induced by suppressing VEGF and activating RARs. Differentiation from S4 is triggered by TGF-β and RARs. The details are given in the right panel (b). (b) Induced switching from APL-like attractor S1 to differentiated state-like attractor S12. In the differentiation course, suppressing VEGF and activating RARs are among the key actions. Starting from APL-like attractor S1, at time t = t0, values of two nodes are changed to: RARs = 1, VEGF = 0. Afterwards, the state of the network switches from S1 to S5. The trajectory during the switching process is shown in the figure, from t = t0 to t = t1. VEGF returns to 1. From S5, at time t = t1, value of VEGF is again set to zero. After that, the network switches from S5 to S4. The trajectory during the switching process is shown in the figure, from t = t1 to t = t2. At time t = t2, from S4, after TGF-β is activated, TGF-β = 1, the the state of the network switches from S4 to S7. The trajectory of this process is shown from t = t2 to t = t3. At time t = t3, from S7, two nodes are activated: RARs = 1, AP2 = 1. The switch from S4 to S12 is shown from t = t3 to t = t4.
Figure 6
Figure 6. Comparison of modeling results with microarray profiles.
(GSE19203, GSE5007, GSE4251934) of normal neutrophil differentiation process (PM is for promyelocyte34) and differentiation of APL cell lines treated with ATRA (all-trans-retinoic acid). (a) Microarray profiles of gene expression corresponding to the nodes in the APL network are shown in the upper panel and compared with calculation. BMP, TGF-β, NR2F2, SHH pathways and their target genes, retinoic acid direct target genes and Pu.1 target genes are shown in the lower panel. The references and annotations are given in Supplementary File 1. The gross feature of normal neutrophil differentiation is similar to APL differentiation under ATRA treatment. (b) Profiles of genes differentially expressed in neutrophil development and ATRA treatment of APL cell lines compare with calculation results. The list of genes is obtained from Figs 3 and 5 in ref. . Most of molecules in the cell cycle related gene list are directly represented by the nodes of the network and their effectors. For expression of receptors and ligands, the network gave predictions to neutrophil specific genes (others are left grey). The differentiated neutrophils and cell lines express receptors and ligands both specific to neutrophil as well as common to other leukocytes. Colored grids in the figure: Red/Blue denotes the value of the former minus the later/the later minus the former is higher than a threshold. Black means the difference is not significant (within the threshold). Grey is for gene symbols not found in a certain dataset.

Similar articles

Cited by

References

    1. National Cancer Institute, Bethesda, MD. SEER Cancer Statistics Factsheets: Leukemia. URL http://seer.cancer.gov/statfacts/html/leuks.html. (2012) (Date of access:10/02/2016).
    1. Wang Z.-Y. & Chen Z. Acute promyelocytic leukemia: from highly fatal to highly curable. Blood 111, 2505–2515 (2008). - PubMed
    1. Marchwicka A., Cebrat M., Sampath P., Śnieżewski Ł. & Marcinkowska E. Perspectives of differentiation therapies of acute myeloid leukemia: the search for the molecular basis of patients’ variable responses to 1,25-dihydroxyvitamin D and vitamin D analogs. Front. Oncol. 4, 125 (2014). - PMC - PubMed
    1. Lo-Coco F. & Hasan S. K. Understanding the molecular pathogenesis of acute promyelocytic leukemia. Best Pract. Res. Clin. Hematol. 27, 3–9 (2014). - PubMed
    1. Kogan S. C. Mouse models of acute promyelocytic leukemia. In Pandolfi P. & Vogt P. (eds.) Acute Promyelocytic Leukemia vol. 313 of Current Topics in Microbiology and Immunology 3–29 (Springer, Berlin, 2007). - PubMed

Publication types

MeSH terms