. 2016 May 24;12(6):1929-37.
doi: 10.1039/c6mb00009f.

Simultaneous tracing of carbon and nitrogen isotopes in human cells

Affiliations

Simultaneous tracing of carbon and nitrogen isotopes in human cells

Roland Nilsson et al. Mol Biosyst. .

Abstract

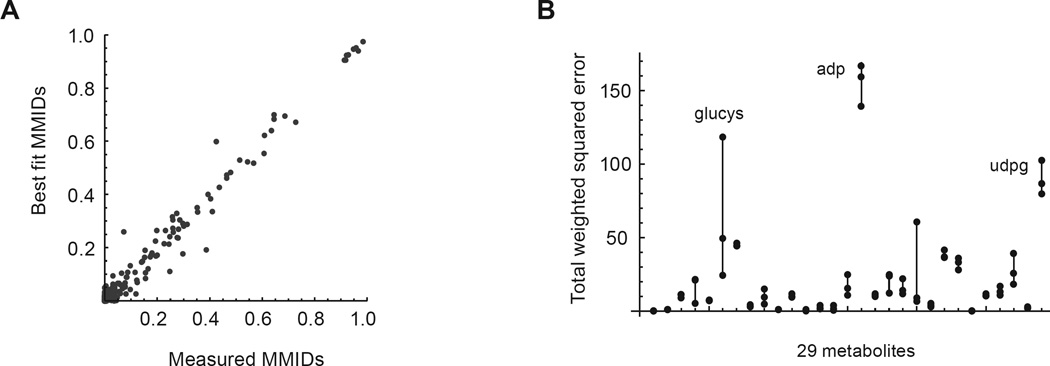
Stable isotope tracing is a powerful method for interrogating metabolic enzyme activities across the metabolic network of living cells. However, most studies of mammalian cells have used (13)C-labeled tracers only and focused on reactions in central carbon metabolism. Cellular metabolism, however, involves other biologically important elements, including nitrogen, hydrogen, oxygen, phosphate and sulfur. Tracing stable isotopes of such elements may help shed light on poorly understood metabolic pathways. Here, we demonstrate the use of high-resolution mass spectrometry to simultaneously trace carbon and nitrogen metabolism in human cells cultured with (13)C- and (15)N-labeled glucose and glutamine. To facilitate interpretation of the complex isotopomer data generated, we extend current methods for metabolic flux analysis to handle multivariate mass isotopomer distributions (MMIDs). We find that observed MMIDs are broadly consistent with known biochemical pathways. Whereas measured (13)C MIDs were informative for central carbon metabolism, (15)N isotopes provided evidence for nitrogen-carrying reactions in amino acid and nucleotide metabolism. This computational and experimental methodology expands the scope of metabolic flux analysis beyond carbon metabolism, and may prove important to understanding metabolic phenotypes in health and disease.


Figures

Figure 1
Figure 1
(A) Example 13C and 15N mass isotopomers intensity peaks in glutamine in a single scan of LC-MS profile mode data. (B) Mass isotopomers peaks of glutathione, as in A. (C) Region of profile mode LC-MS data showing chromatographic elution of glutathione mass isotopomer peaks, from the same sample as in B. (D) MMID of glutamine depicted as an array plot. (E) MMID of glutamine. Error bars denote absolute standard deviation of triplicates. MI, mass isotopomer. (F) Histogram (gray bars) and cumulative density (solid line) of MMID standard deviations across all measured metabolites. Undetectable mass isotopomers (zero in all samples) were excluded. Rightmost histogram bin represents all MI with standard deviation > 0.03.
Figure 2
Figure 2
(A) Model fit to measured MMIDs after 24h culture in labeled medium. Results for one sample is shown; all replicates were similar. (B) Total variance-weighted squared error per metabolite for each of 3 replicates, joined by solid lines. Difficult to fit metabolites are indicated: glucys, gamma-glutamylcysteine; adp, adenosine diphosphate; udpg, uracil diphosphate-glucose.
Figure 3
Figure 3
(A) Measured, fitted mitochondrial and fitted cytosolic carbon-nitrogen MMIDs of glutamate after 24h culture in labeled medium. Complete MMIDs are shown as array plots, selected isotopomers as bar charts. (B) Model of glutamate metabolism (simplified) with fitted MMIDs. Mitochondrial glutamate (upper) reflects synthesis from glutamine, while cytosolic glutamate (lower) is affected by aminotransferase activity, resulting in a smaller fraction 13C515N1. (C) Measured and fitted carbon-nitrogen MMIDs of proline, as in A.
Figure 4
Figure 4
(A) Measured and fitted carbon-nitrogen MMIDs of adenosine diphosphate (ADP) after 24h culture in labeled medium. Complete MMIDs are shown as array plots, selected isotopomers as bar charts. (B) Schematic of purine synthesis with fitted MMIDs. Percentages indicate relative contribution of pathways according to model estimates. (C) Measured and fitted carbon-nitrogen MMIDs of uracil diphosphate-glucose (UDP-glucose) after 24h culture in labeled medium. (D) Schematic of pyrimidine synthesis, as in B.

Similar articles

Cited by

References

    1. Sauer U. Metabolic networks in motion: 13C-based flux analysis. Mol. Syst. Biol. 2006;2:62. - PMC - PubMed
    1. Huang X, et al. X13CMS: global tracking of isotopic labels in untargeted metabolomics. Anal. Chem. 2014;86:1632–1639. - PMC - PubMed
    1. Capellades J, et al. GeoRge: A Computational Tool to Detect the Presence of Stable Isotope Labeling in LC/MS-Based Untargeted Metabolomics. Anal. Chem. 2016;88:621–628. - PubMed
    1. Buescher JM, et al. A roadmap for interpreting 13C metabolite labeling patterns from cells. Curr. Opin. Biotechnol. 2015;34:189–201. - PMC - PubMed
    1. Wiechert W. 13C Metabolic Flux Analysis. Metab. Eng. 2001;3:195–206. - PubMed

Publication types