. 2016 Jul;54(7):1755-1765.
doi: 10.1128/JCM.02784-15. Epub 2016 Apr 20.

Towards Development of Improved Serodiagnostics for Tularemia by Use of Francisella tularensis Proteome Microarrays

Affiliations

Towards Development of Improved Serodiagnostics for Tularemia by Use of Francisella tularensis Proteome Microarrays

Rie Nakajima et al. J Clin Microbiol. 2016 Jul.

Abstract

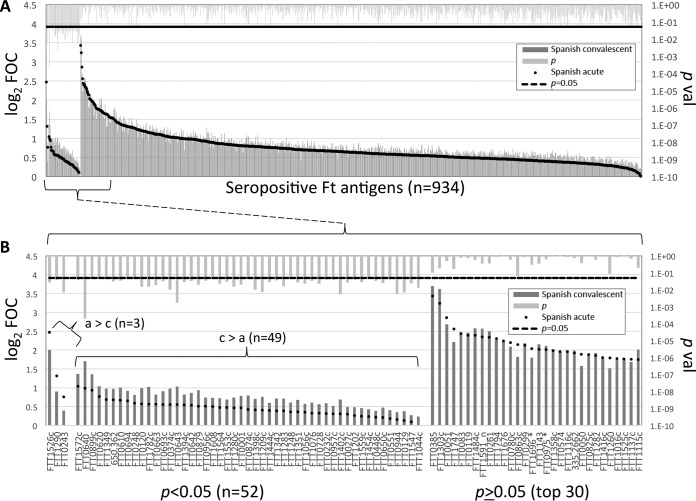
Tularemia in humans is caused mainly by two subspecies of the Gram-negative facultative anaerobe Francisella tularensis: F. tularensis subsp. tularensis (type A) and F. tularensis subsp. holarctica (type B). The current serological test for tularemia is based on agglutination of whole organisms, and the reactive antigens are not well understood. Previously, we profiled the antibody responses in type A and B tularemia cases in the United States using a proteome microarray of 1,741 different proteins derived from the type A strain Schu S4. Fifteen dominant antigens able to detect antibodies to both types of infection were identified, although these were not validated in a different immunoassay format. Since type A and B subspecies are closely related, we hypothesized that Schu S4 antigens would also have utility for diagnosing type B tularemia caused by strains from other geographic locations. To test this, we probed the Schu S4 array with sera from 241 type B tularemia cases in Spain. Despite there being no type A strains in Spain, we confirmed the responses against some of the same potential serodiagnostic antigens reported previously, as well as determined the responses against additional potential serodiagnostic antigens. Five potential serodiagnostic antigens were evaluated on immunostrips, and two of these (FTT1696/GroEL and FTT0975/conserved hypothetical protein) discriminated between the Spanish tularemia cases and healthy controls. We conclude that antigens from the type A strain Schu S4 are suitable for detection of antibodies from patients with type B F. tularensis infections and that these can be used for the diagnosis of tularemia in a deployable format, such as the immunostrip.


Figures

FIG 1
FIG 1
Classification by MA of sera used in this study. (A) Distribution of titers of all Spanish serum samples used. MA titers ranged from 0 to 32,768, with the median titer being 512. The cutoff for seroconversion is considered to be ≥1/64. (B to D) Changes in MA titers measured at two time points; the first is when the patient presents at the clinic, and the second is at the follow-up approximately 2 weeks later. Each line represents an individual patient. (B) Results for group 1 patients (n = 40). These patients had seroconverted, which normally confirms a diagnosis of acute infection. (C) Results for group 2 patients (n = 41). These patients were in the late acute phase of infection and were seropositive at both time points, with the second sample showing a ≥2-fold rise in MA titer. (D) Results for group 3 patients (n = 18). These patients were in the convalescent phase and seropositive at both time points, but the second sample did not show a ≥2-fold rise in MA titer. A fourth group (not shown) comprised 5 patients who had MA titers of 0 at both time points and who were diagnosed to be free of infection. Dashed line, cutoff for seroconversion (≥1/64).
FIG 2
FIG 2
Kinetic profiles revealed by the proteome microarray reflect those defined by conventional MA. The average array signal intensities of the top 16 most reactive antigens indicating exposure to tularemia in Spain are shown (the results are analyzed in detail in Fig. 3). Each line represents a different antigen. (A) Results for group 1 patients (n = 40). These patients had acute infection, seroconverted according to the MA titer, and showed an increase in signal intensity by array analysis. (B) Results for group 2 patients (n = 41). These patients were in the late acute phase of infection, were seropositive at both time points according to the MA titer, and showed a modest increase in signal intensity by array analysis. (C) Results for group 3 patients (n = 18). These patients were in the convalescent phase of infection and were seropositive by MA at both time points but did not show an increase in signal intensity by array analysis. (D) Results for group 4 patients (n = 5). These patients had MA titers of 0 at both time points and were tentatively considered to be free of F. tularensis infection. They showed the lowest signals of the Spanish samples. (E) Results for group 7, consisting of U.S. controls. Array data were normalized by dividing the IVTT reaction protein spot intensity by the sample-specific median of the 77 IVTT reaction control spots printed throughout the chip to give the FOC and then taking the base 2 logarithm of the ratio (log2 FOC). *, antigens identified to be significant in the work of Sundaresh et al. (25).
FIG 3
FIG 3
Identification of antigens associated with F. tularensis exposure using proteome microarrays. The microarrays were probed with sera from Spanish tularemia cases (sera obtained from groups 1 to 3 at the second time point) and Spanish individuals negative for tularemia (sera obtained from groups 4 and 5 at the second time point), and IgG was visualized by indirect immunofluorescence (see Materials and Methods). A serum sample was defined to be positive for an antigen if the array signal was >2 times the median for the IVTT reaction control spots in at least 10% of the samples from either group. (A) Antigens to which the serum samples were reactive (n = 979). Ft, F. tularensis. (B) Enlargement of the 27 discriminatory antigens and top 30 nondiscriminatory antigens from panel A. Array data were normalized by dividing the IVTT reaction protein spot intensity by the sample-specific median for the 77 IVTT reaction control spots printed throughout the chip to give the FOC and then taking the base 2 logarithm of the ratio (log2 FOC). *, antigens identified to be significant in the work of Sundaresh et al. (25); noss, the signal sequence was deleted; p_BH, P values corrected for false discovery using the Benjamini-Hochberg method (31).
FIG 4
FIG 4
Relative sensitivity of MA titer and GroEL (FTT1696) on the protein array for detection of tularemia in 5 culture-confirmed tularemia cases. Sera from 5 culture-confirmed Spanish tularemia cases (group 6) were assayed by MA and on the protein microarrays for reactivity to the GroEL (FTT1696) antigen. MA titers are shown beneath the plot of the array values (cutoff, ≥1/64). The GroEL antigen was identified in Fig. 3 to discriminate Spanish tularemia cases and controls. Array data were normalized by dividing the IVTT reaction protein spot intensity by the sample-specific median for the 77 IVTT reaction control spots printed throughout the chip to give the FOC and then taking the base 2 logarithm of the ratio (log2 FOC). Dashed line, log2 FOC of 1 (2-fold over the background intensity) for the array.
FIG 5
FIG 5
Identification of antigens that discriminate between Spanish acute- and convalescent-stage tularemia. (A) The IgG profiles of Spanish tularemia patients with low to high MA titers were compared and segregated by P value. (B) Enlargement of the 52 differentially reactive antigens (P < 0.05) and top 30 nondifferentially reactive antigens (P ≥ 0.05). a, acute phase; c, convalescent phase. Array data were normalized by dividing the IVTT reaction protein spot intensity by the sample-specific median for the 77 IVTT reaction control spots printed throughout the chip to give the FOC and then taking the base 2 logarithm of the ratio (log2 FOC). *, antigens identified to be significant in the work of Sundaresh et al. (25); noss, the signal sequence was deleted.
FIG 6
FIG 6
Immunostrips with 5 purified F. tularensis subsp. tularensis antigens probed with sera from Spanish tularemia cases and controls. (A) Scan of immunostrips. The MA titers are shown above each strip. (B) Histograms of the corresponding band intensities after quantification and normalization by median scaling against the IgG printed on the strip. Horizontal dashed lines, cutoff generated by using the mean + 2 SDs for the blood donors (n = 23).
FIG 7
FIG 7
ROC analysis of the immunostrip data shown in Fig. 6. Antigen FTT1696 alone provides the best discrimination between Spanish cases and controls, although the specificity was improved slightly by combining FTT1696 with FTT0975. neg, negative; AUC, area under the curve.
FIG 8
FIG 8
Immunostrips of 2 purified F. tularensis subsp. tularensis antigens probed with sera from Spanish tularemia cases and controls and U.S. controls. The histograms are described in the legend to Fig. 6. Solid horizontal line, cutoff generated by using the mean + 2 SDs for the U.S. controls (n = 44).

Similar articles

Cited by

References

    1. Ariza-Miguel J, Johansson A, Fernández-Natal MI, Martínez-Nistal C, Orduña A, Rodríguez-Ferri EF, Hernández M, Rodríguez-Lázaro D. 2014. Molecular investigation of tularemia outbreaks, Spain, 1997-2008. Emerg Infect Dis 20:754–761. doi:10.3201/eid2005.130654. - DOI - PMC - PubMed
    1. Centro Nacional de Epidemiología Instituto de Salud Carlos III. 1997. Brote de tularemia en Castilla y León. Bol Epidemiol Sem 5:249–252.
    1. Anda P, Segura del Pozo J, Díaz García JM, Escudero R, García Peña FJ, López Velasco MC, Sellek RE, Jiménez Chillarón MR, Sánchez Serrano LP, Martínez Navarro JF. 2001. Waterborne outbreak of tularemia associated with crayfish fishing. Emerg Infect Dis 7(3 Suppl):575–582. - PMC - PubMed
    1. Sjostedt A. 2003. Virulence determinants and protective antigens of Francisella tularensis. Curr Opin Microbiol 6:66–71. doi:10.1016/S1369-5274(03)00002-X. - DOI - PubMed
    1. McLendon MK, Apicella MA, Allen LA. 2006. Francisella tularensis: taxonomy, genetics, and immunopathogenesis of a potential agent of biowarfare. Annu Rev Microbiol 60:167–185. doi:10.1146/annurev.micro.60.080805.142126. - DOI - PMC - PubMed