. 2016 Aug 1;524(11):2161-81.
doi: 10.1002/cne.24023.

Towards a comprehensive atlas of cortical connections in a primate brain: Mapping tracer injection studies of the common marmoset into a reference digital template

Affiliations

Towards a comprehensive atlas of cortical connections in a primate brain: Mapping tracer injection studies of the common marmoset into a reference digital template

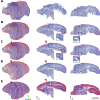
Piotr Majka et al. J Comp Neurol. .

Abstract

The marmoset is an emerging animal model for large-scale attempts to understand primate brain connectivity, but achieving this aim requires the development and validation of procedures for normalization and integration of results from many neuroanatomical experiments. Here we describe a computational pipeline for coregistration of retrograde tracing data on connections of cortical areas into a 3D marmoset brain template, generated from Nissl-stained sections. The procedure results in a series of spatial transformations that are applied to the coordinates of labeled neurons in the different cases, bringing them into common stereotaxic space. We applied this procedure to 17 injections, placed in the frontal lobe of nine marmosets as part of earlier studies. Visualizations of cortical patterns of connections revealed by these injections are supplied as Supplementary Materials. Comparison between the results of the automated and human-based processing of these cases reveals that the centers of injection sites can be reconstructed, on average, to within 0.6 mm of coordinates estimated by an experienced neuroanatomist. Moreover, cell counts obtained in different areas by the automated approach are highly correlated (r = 0.83) with those obtained by an expert, who examined in detail histological sections for each individual. The present procedure enables comparison and visualization of large datasets, which in turn opens the way for integration and analysis of results from many animals. Its versatility, including applicability to archival materials, may reduce the number of additional experiments required to produce the first detailed cortical connectome of a primate brain. J. Comp. Neurol. 524:2161-2181, 2016. © 2016 The Authors The Journal of Comparative Neurology Published by Wiley Periodicals, Inc.

Keywords: Nissl staining; brain template; cerebral cortex; digital atlas; image registration; marmoset; neuroanatomical tracing.


Conflict of interest statement

The authors declare no competing financial interests.

Figures

Figure 1
Figure 1
Preprocessing of the Nissl sections and plotting software data. A: Masking a left hemisphere on an example section. B–D: Alignment of the plotting software drawings based on fluorescent sections with corresponding Nissl‐stained sections. B: Plotting software drawings; individual colors denote different types of tracer, points correspond to the individual cells. C: Nissl‐stained sections corresponding to the fluorescent sections. D: Plotting software drawings aligned to the Nissl‐stained sections. [Color figure can be viewed in the online issue, which is available at wileyonlinelibrary.com.]
Figure 2
Figure 2
Reference template used in this study. A: Triangular mesh representing outline of the 3D reconstruction of the left hemisphere of the Paxinos et al. (2012) marmoset brain atlas. Individual colors correspond to different cortical areas. Cases and structures into which injections analyzed in this study were made are listed next to the mesh. A8aD: area 8a of cortex dorsal part; A6DR: area 6 of cortex dorsorostral part; A8b: area 8b of cortex; A9: area 9 of cortex; A10: area 10 of cortex; A46V: area 46 of cortex ventral part; A8aV: area 8a of cortex ventral part. Injections denoted with the square symbol were used for quantitative examination of the registration accuracy (Fig. 6B). B: 3D reconstruction of the brain template based on 63 Nissl atlas plates of the reference atlas. Green and red outlines correspond to sagittal (C) and horizontal (D) cross‐sections, respectively. C,D: Cross‐sections of the reconstruction shown in (B), colored contours represent atlas parcellation from (A). Axes indicate that the reconstruction is anchored in the stereotaxic reference system as defined in the Paxinos et al. (2012) atlas. The template is available as a Supplementary Material (Supplementary File S4_marmoset_brain_template.zip). [Color figure can be viewed in the online issue, which is available at wileyonlinelibrary.com.]
Figure 3
Figure 3
Reconstruction and normalization process. Note that in this illustration, for clarity, the process is represented in two dimensions. A: 3D image of the reference brain in Nissl modality (as shown in Fig. 2B). B: Series of the images of Nissl‐stained sections to be reconstructed and normalized (as shown in Fig. 1C), colored rectangles represent individual coronal sections viewed from a lateral viewpoint. C: The reference image aligned to the experimental stack using 3D affine transformation and resliced, so that each experimental section has its virtual reference cut assigned. D: Individual experimental sections are aligned to appropriate virtual references using 2D rigid (translation and rotation) transformation. Steps C and D are performed iteratively (dashed frame) and in each iteration agreement between reconstruction and the reference improves. E: A deformable reconstruction step enhances smoothness of the 3D image by accounting for uncorrelated distortions of individual sections. F: 3D affine followed by 3D deformable registration is used to warp the reconstruction (E) into the reference 3D image (A). [Color figure can be viewed in the online issue, which is available at wileyonlinelibrary.com.]
Figure 4
Figure 4
Individual sectors of cortical tissue were delineated to increase the coregistration accuracy. A,C: Medial and lateral views of the brain outline (gray, transparent model) with individual regions of cortex shown in different colors: dorsal bank (1), ventral bank (2) and fundus (3) of the calcarine sulcus, lateral bank (4), medial bank (5) and the fundus of the lateral sulcus (6), hippocampus (7), cingulate cortex (8), enthorinal cortex and parasubiculum (9), piriform cortex (10), and isocortex of the temporal pole (11). Dashed lines denote the coronal plane shown in B,D. B,D: Coronal sections through the 3D brain image of case CJ83, coregistered without incorporating the information on corresponding tissue fragments (B) and using such information (D); red outline denotes contour of the cerebral cortex as defined in the atlas, while the black rectangles highlight an area within which the difference between the two coregistration attempts is the most noticeable. [Color figure can be viewed in the online issue, which is available at wileyonlinelibrary.com.]
Figure 5
Figure 5
Consecutive steps of the 3D reconstruction and spatial normalization process of an example case (CJ94) comprising 159 images of Nissl‐stained coronal sections. A: Input images in which only the left hemisphere to be reconstructed was represented. B: Reconstruction after applying affine transformation. C: Reconstruction after applying deformable corrections. D: Final reconstruction matching the reference image. E: The reference template image. Columns: Left: Stacks of the Nissl‐stained sections viewed at 30° angle rostrolaterally. Every fifth section is outlined with a red contour to illustrate the general shape of the image stack. Middle: parasagittal cross‐sections. Right: Horizontal cross‐sections. See text for a detailed description of individual reconstruction steps. [Color figure can be viewed in the online issue, which is available at wileyonlinelibrary.com.]
Figure 6
Figure 6
Cell mapping accuracy assessment. A: Euclidean distances between the locations of the injection sites obtained from the automated mapping procedure and those estimated by an expert neuroanatomist (by comparing individual sections from a case with the nearest matching plate from the Paxinos et al. (2012) reference atlas). B: Comparison of percentages of cells mapped into individual cortical areas by the automated (ordinates) and manual (abscissas) procedures. The black line denotes a line of an exact agreement between results obtained from both approaches. Colors of different points correspond to individual cortical areas as shown in Figure 1A. [Color figure can be viewed in the online issue, which is available at wileyonlinelibrary.com.]
Figure 7
Figure 7
An example of 3D and flat map visualization of the cell mapping results (case CJ108FR, injection in the caudal part of area 8aD). A: An example database entry on a single cell showing data associated with the cell. The values within the gray rectangle are established during the mapping process. Flat map (B), lateral (C), and medial (D) views on the individual cells (black points) plotted against the mid‐thickness cortical surface (C,D) or the flat map (B). The tip of the large vertical red cone denotes the center of mass of the injection, and the small red cone the estimate obtained based on comparison with atlas plates by an expert neuroanatomist. Cell indicated with the blue wedge within the inset is the one detailed in A. In C,D, the dashed gray outline depicts the external surface of the cerebral cortex. [Color figure can be viewed in the online issue, which is available at wileyonlinelibrary.com.]
Figure 8
Figure 8
Visualizations of the pattern of cortical labeling resulting from the area 8aV injection in case CJ75DY, using the flat map representation of the atlas. A: Flattened mid‐thickness cortical surface. Different colors correspond to various areas, following the convention shown in Figure 6B. The green and the red diamonds denote the rostral and caudal poles, respectively, and the pairs of asterisks of same colors denote adjacent points, which became separated in the maps by introduced discontinuities, generated to reduce distortions resulting from the flattening procedure. Black dots denote individual cells projected onto the flat map, while the yellow sphere indicates the injection location. B: The numbers of cells assigned to different cortical areas (see the color scale). The area comprising the injection site (area 8aV, part of the frontal eye field; Burman et al., 2006) has an undefined number of cells. C: Normalized depth below the pial surface of individual cells. Cells placed close to the surface appear blue, while those lying close to the white matter boundary are red. D: Cells assigned to rostrocaudal coordinates between 1.3 mm to 1.7 mm caudal to the interaural line, plotted against plate 43 of the Paxinos et al. (2012) atlas. The colors indicate normalized depth below the cortical surface. The dashed black curve represents the mid‐thickness line. A corresponding dashed line is drawn in A–C, indicating the level of this section in the normalized flat map. The red and blue triangular markers show the direction of the mid‐thickness line, and indicate the fact that the calcarine sulcus was discontinued along its fundus. [Color figure can be viewed in the online issue, which is available at wileyonlinelibrary.com.]
Figure 9
Figure 9
Comparison between the CJ108FE case (area 8aV injection) flat maps obtained manually, and by using the automated approach. A: Flat map obtained from a single individual case, published previously (Reser et al., 2013). Green points indicate individual cells. B: Cells from the same injection mapped into the reference brain, and projected onto the template flat map. Colors denote different cortical areas, while black points indicate individual cells. Several cortical areas have been labeled in both maps, using the convention in the original article. In both automated and manual approaches, similar projection patterns can be observed. [Color figure can be viewed in the online issue, which is available at wileyonlinelibrary.com.]

Similar articles

Cited by

References

    1. Adler DH, Pluta J, Kadivar S, Craige C, Gee JC, Avants BB, Yushkevich PA. 2014. Histology‐derived volumetric annotation of the human hippocampal subfields in postmortem MRI. Neuroimage 84:505–523. - PMC - PubMed
    1. Amunts K, Lepage C, Borgeat L, Mohlberg H, Dickscheid T, Rousseau M‐É, Bludau S, Bazin P‐L, Lewis LB, Oros‐Peusquens A‐M, Shah NJ, Lippert T, Zilles K, Evans AC. 2013. BigBrain: an ultrahigh‐resolution 3D human brain model. Science 340:1472–1475. - PubMed
    1. Annese J. 2012. The importance of combining MRI and large‐scale digital histology in neuroimaging studies of brain connectivity and disease. Front Neuroinform 6:1–6. - PMC - PubMed
    1. Annese J, Schenker‐Ahmed NM, Bartsch H, Maechler P, Sheh C, Thomas N, Kayano J, Ghatan A, Bresler N, Frosch MP, Klaming R, Corkin S. 2014. Postmortem examination of patient H.M.'s brain based on histological sectioning and digital 3D reconstruction. Nat Commun 5:3122. - PMC - PubMed
    1. Avants BB, Epstein CL, Grossman M, Gee JC. 2008. Symmetric diffeomorphic image registration with cross‐correlation: evaluating automated labeling of elderly and neurodegenerative brain. Med Image Anal 12:26–41. - PMC - PubMed

Publication types