. 2016 May 3;113(18):E2480-8.
doi: 10.1073/pnas.1602618113. Epub 2016 Apr 20.

Noncanonical DNA-binding mode of repressor and its disassembly by antirepressor

Affiliations

Noncanonical DNA-binding mode of repressor and its disassembly by antirepressor

Minsik Kim et al. Proc Natl Acad Sci U S A. .

Abstract

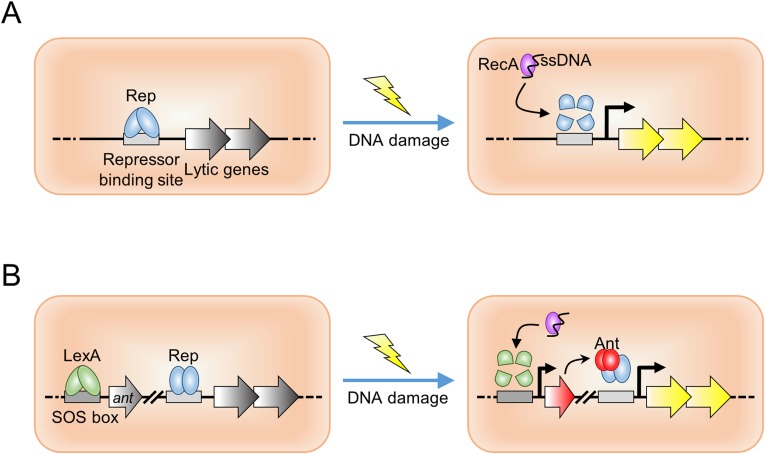
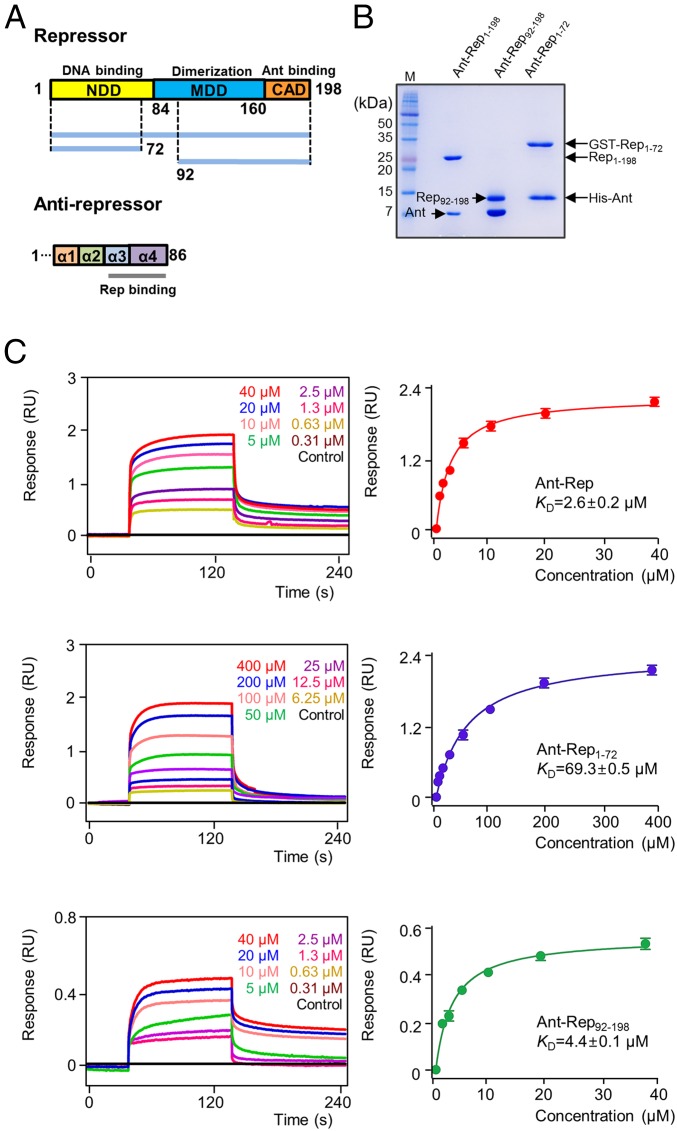
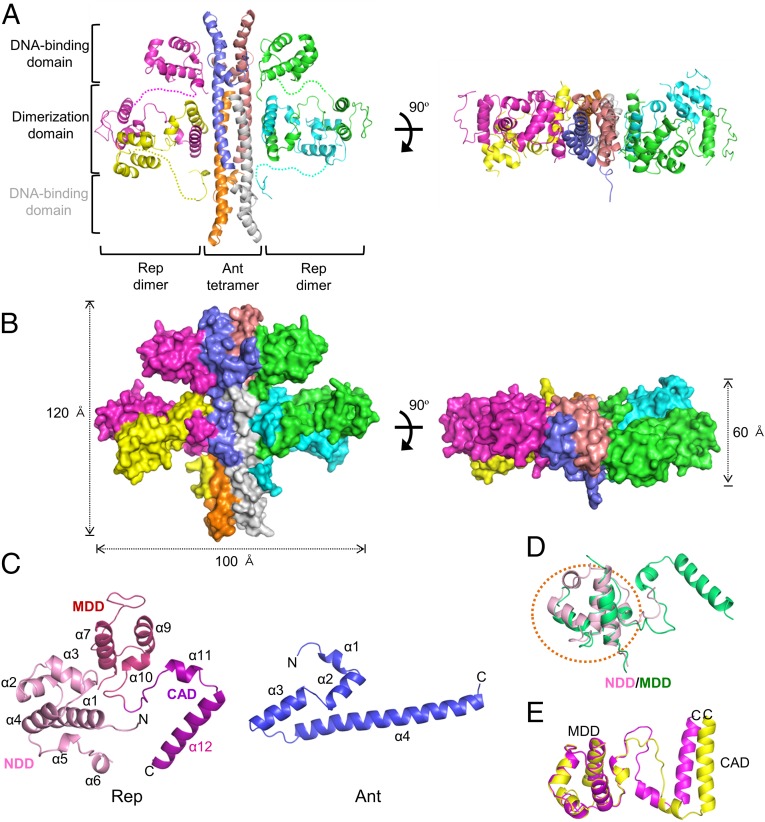
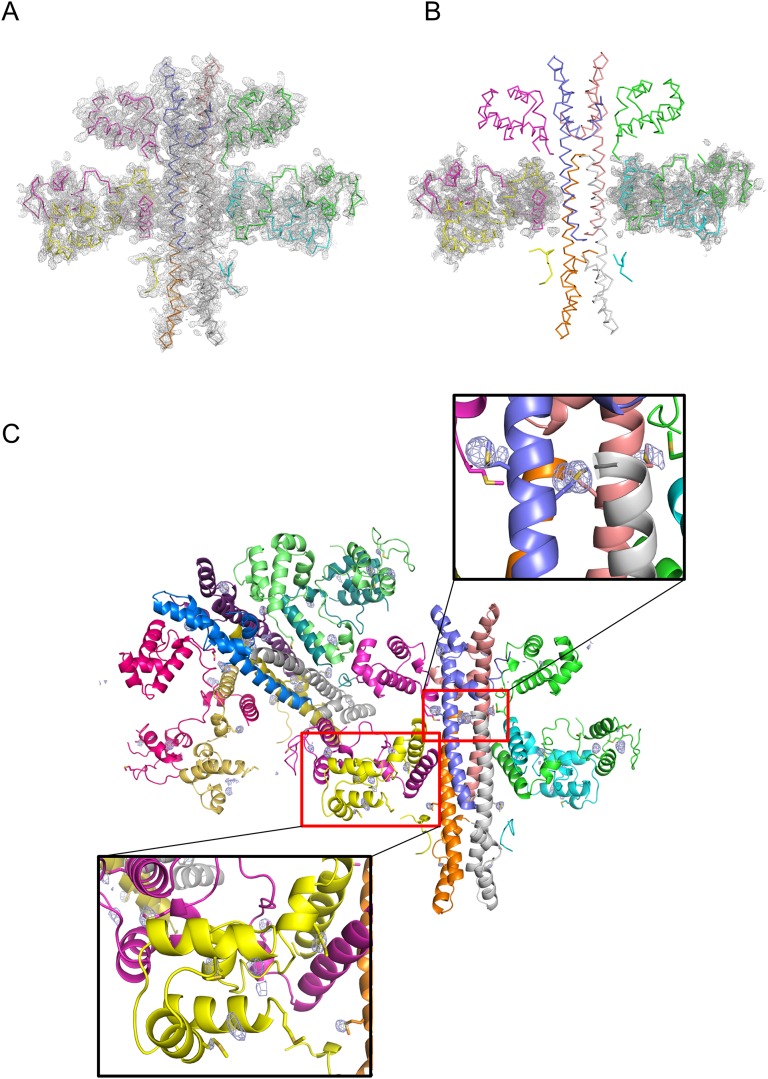
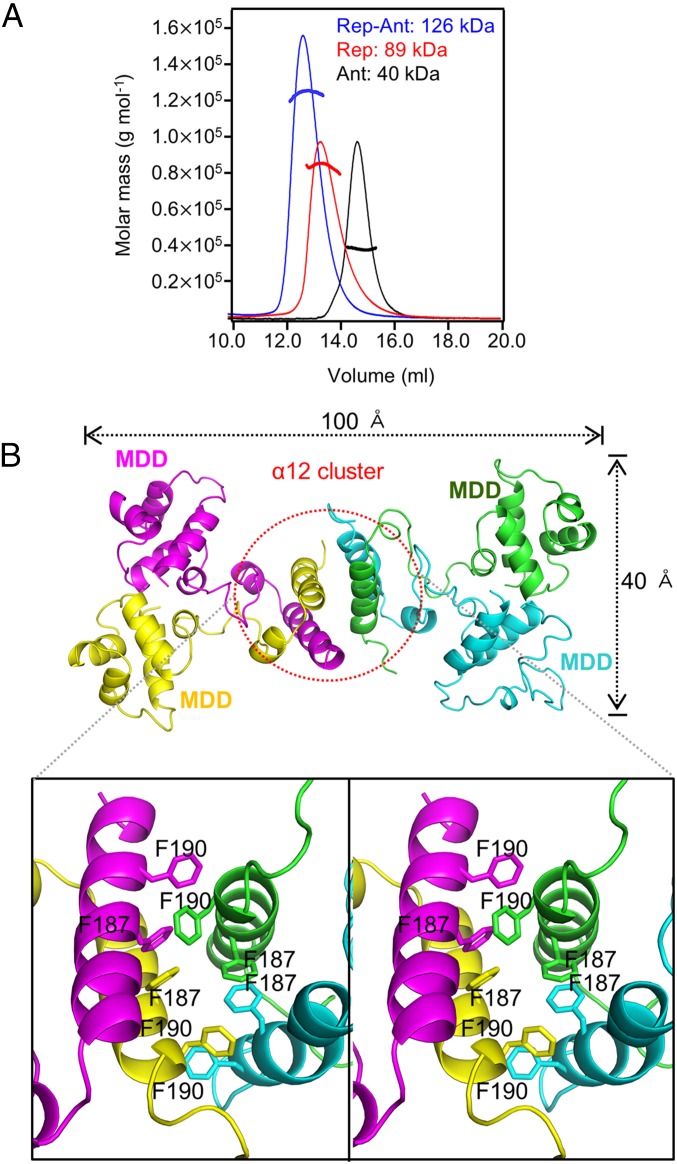
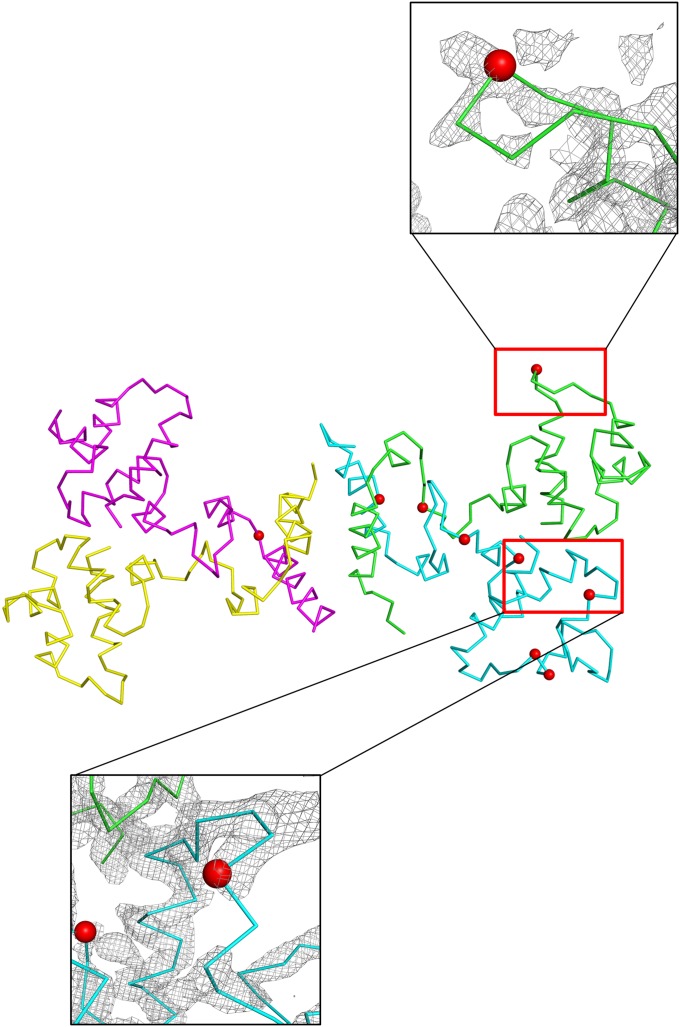
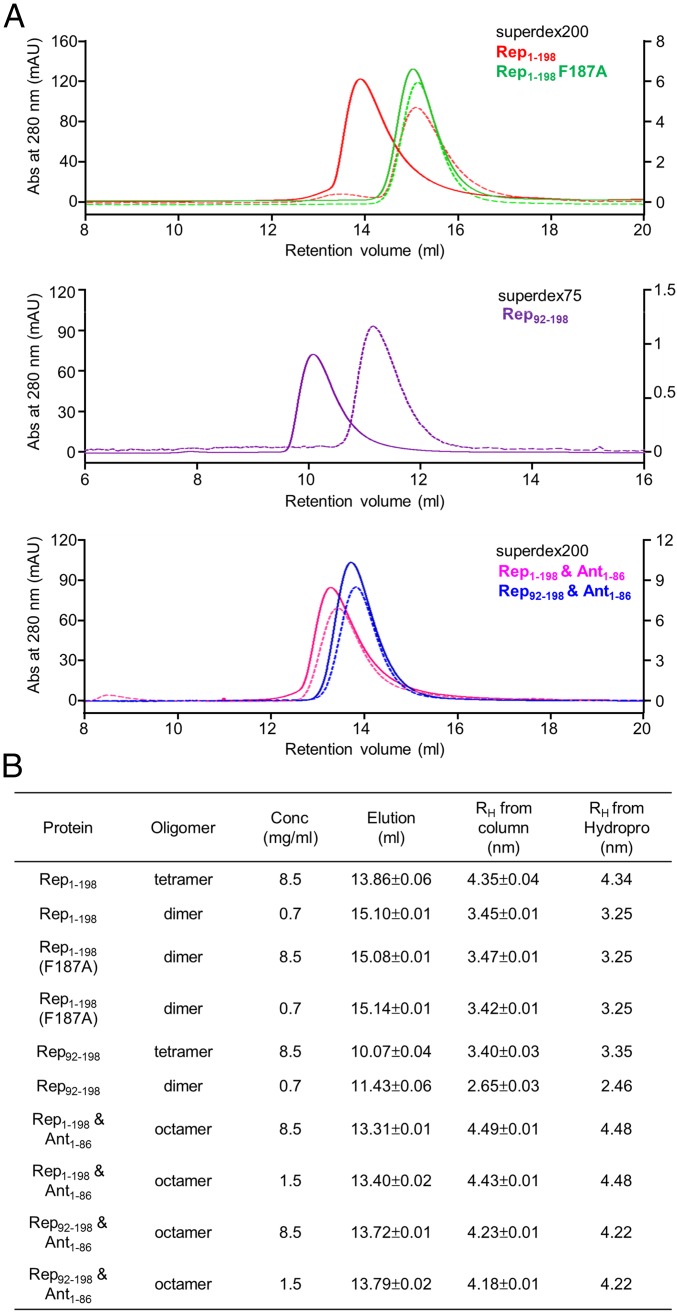
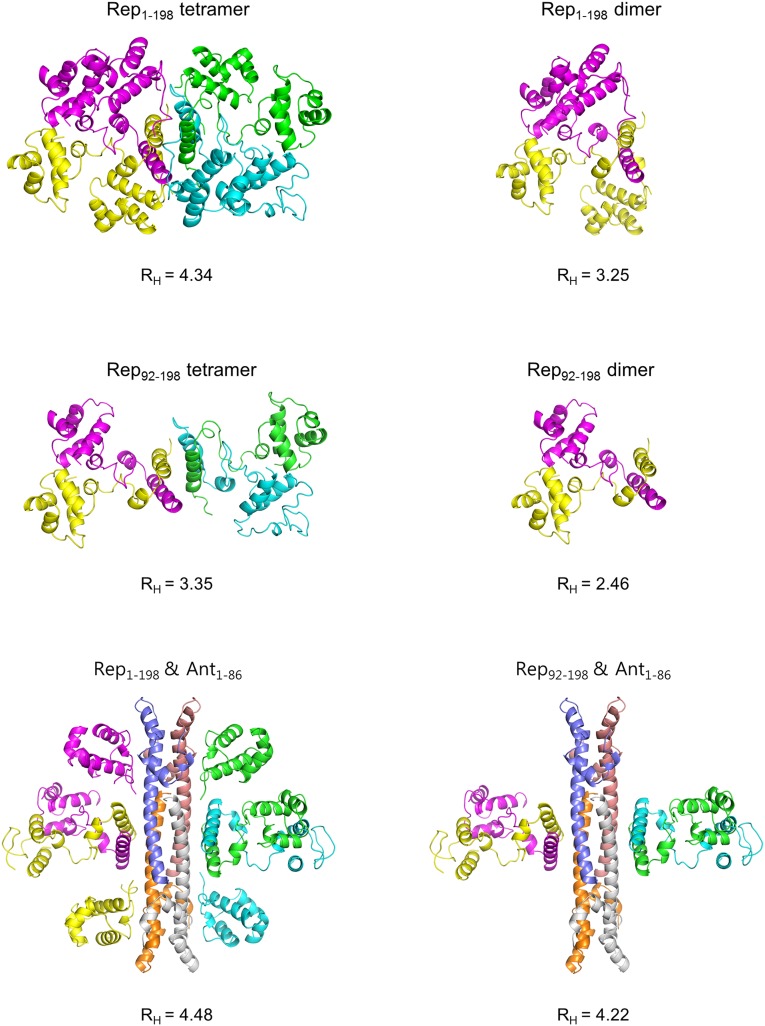
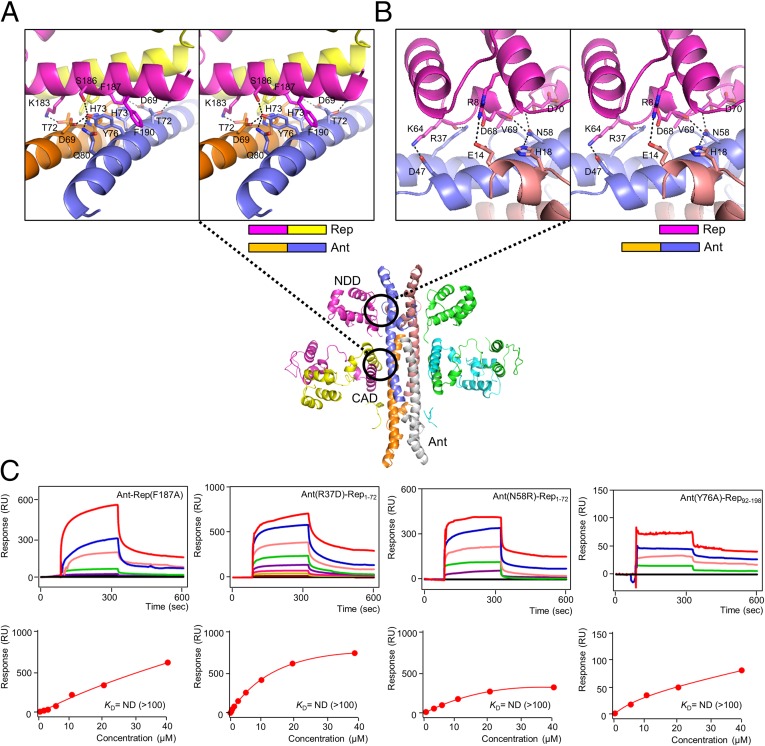
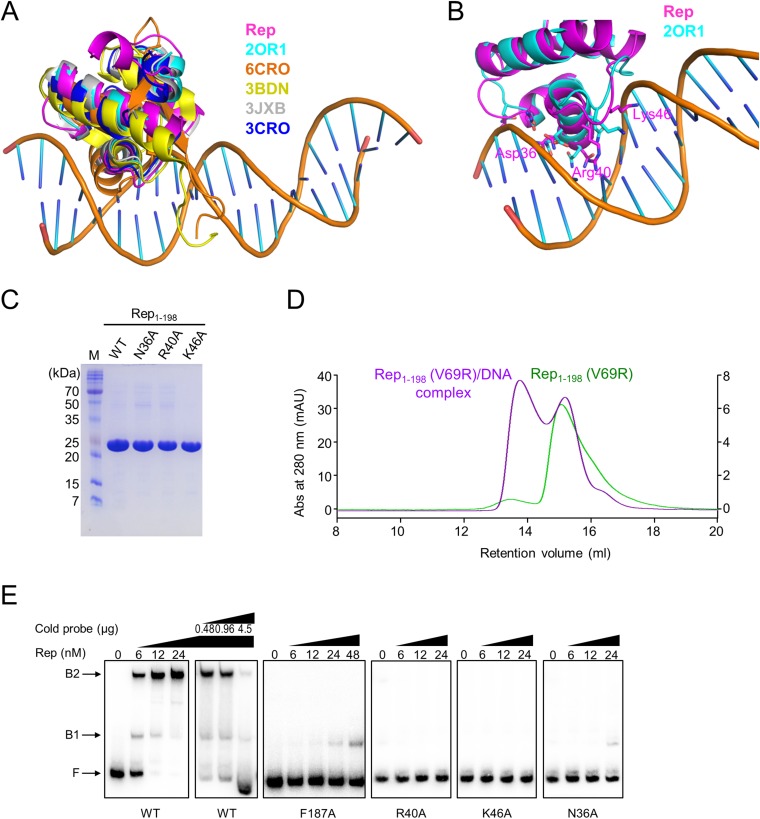
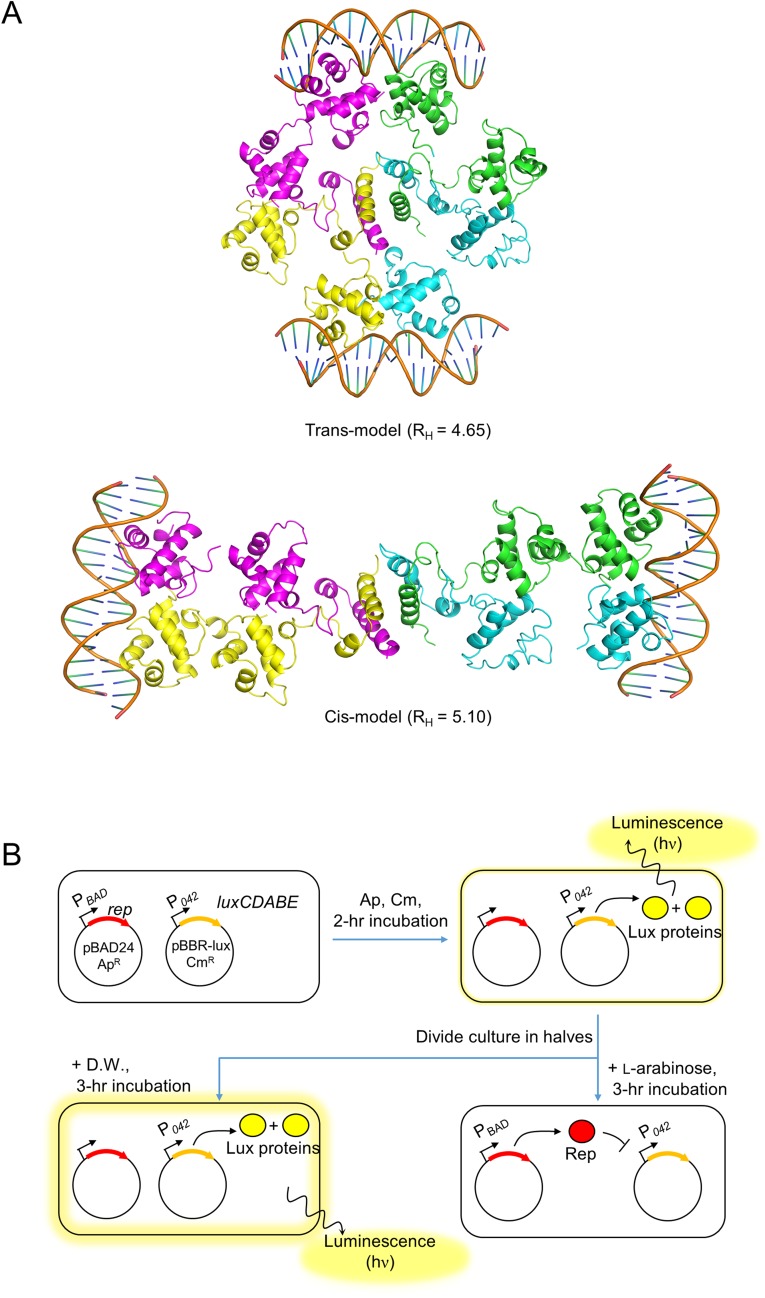
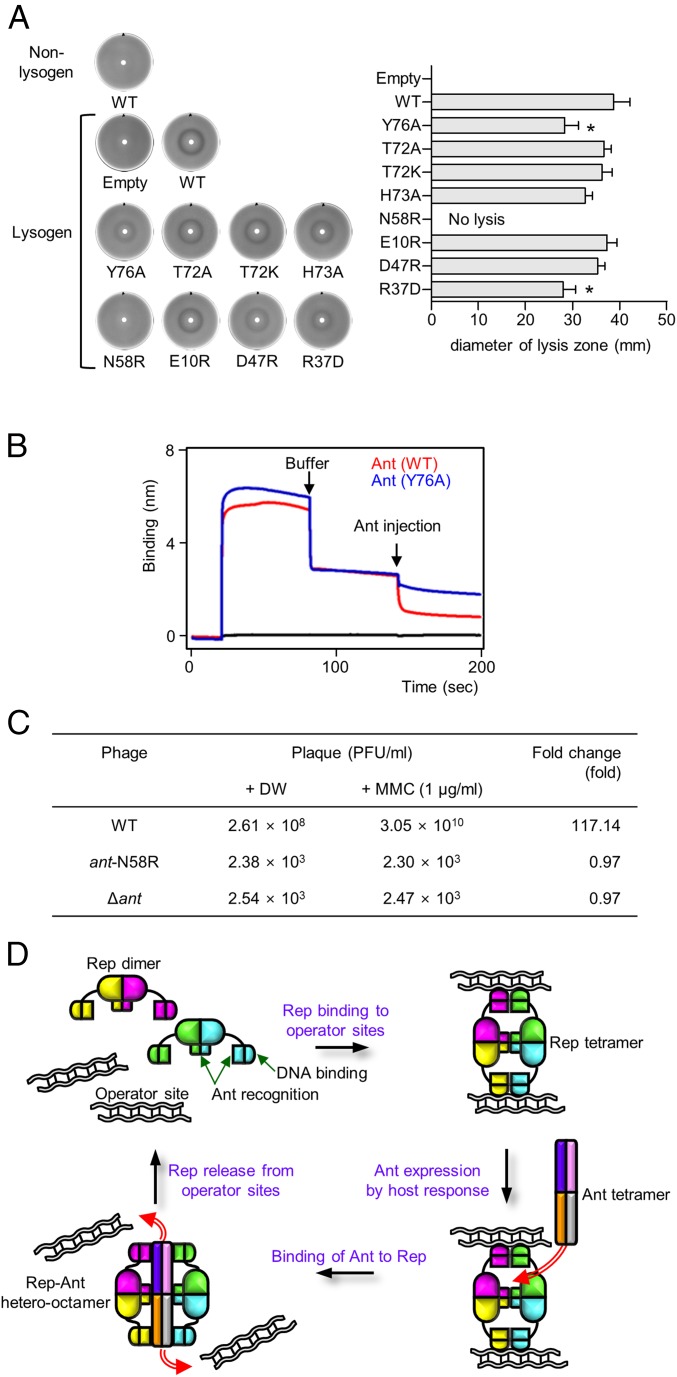
DNA-binding repressors are involved in transcriptional repression in many organisms. Disabling a repressor is a crucial step in activating expression of desired genes. Thus, several mechanisms have been identified for the removal of a stably bound repressor (Rep) from the operator. Here, we describe an uncharacterized mechanism of noncanonical DNA binding and induction by a Rep from the temperate Salmonella phage SPC32H; this mechanism was revealed using the crystal structures of homotetrameric Rep (92-198) and a hetero-octameric complex between the Rep and its antirepressor (Ant). The canonical method of inactivating a repressor is through the competitive binding of the antirepressor to the operator-binding site of the repressor; however, these studies revealed several noncanonical features. First, Ant does not compete for the DNA-binding region of Rep. Instead, the tetrameric Ant binds to the C-terminal domains of two asymmetric Rep dimers. Simultaneously, Ant facilitates the binding of the Rep N-terminal domains to Ant, resulting in the release of two Rep dimers from the bound DNA. Second, the dimer pairs of the N-terminal DNA-binding domains originate from different dimers of a Rep tetramer (trans model). This situation is different from that of other canonical Reps, in which two N-terminal DNA-binding domains from the same dimeric unit form a dimer upon DNA binding (cis model). On the basis of these observations, we propose a noncanonical model for the reversible inactivation of a Rep by an Ant.

Keywords: Salmonella; antirepressor; bacteriophage; repressor; transcription.


Conflict of interest statement

The authors declare no conflict of interest.

Figures

Fig. S1.
Fig. S1.
Schematic of the lytic switch in prophages. (A) A classical cleavable repressor system representative of phage lambda. Upon host DNA damage, phage Rep is autocleaved by an activated host RecA protein, resulting in derepression of phage lytic genes. (B) The Rep/Ant system found in some prophages, such as SPC32H. An activated host RecA protein induces the autoproteolysis of the host LexA protein that represses phage Ant expression. Newly expressed Ant protein sequesters the cognate phage Rep from the operator, leading to phage lytic gene expression.
Fig. 1.
Fig. 1.
Mapping the Rep–Ant binding region. (A) Domain architectures of Rep and Ant. Rep constructs are shown by blue lines, and Rep/Ant binding regions are indicated. (B) SDS/PAGE of Rep1–198–Ant1–86, Rep1–72–Ant1–86, and Rep92–198–Ant1–86 complexes. SDS/PAGE gels were visualized using Coomassie Blue. (C) Representative BLI binding sensorgrams of Ant1–86 with Rep1–198, Rep1–72, and Rep92–198. The experiments were repeated three times. Each concentration of analytes is shown in a different color.
Fig. 2.
Fig. 2.
Overall structure of the Rep–Ant complex. (A and B) Ribbon (A) and surface (B) diagrams of the Rep–Ant octamer. Each chain is shown in a different color. Ribbon and surface diagrams of the octamer rotated by 90° around the indicated axis in the left figure are drawn on the right. Gray labeling indicates the positions of two invisible DNA-binding domains (yellow and cyan). (C) Monomer structures of Rep and Ant. (D) Superimposition of the NDD (pink) and the MDD (green) from the Rep–Ant complex. (E) Superimposition of two Rep monomers from the Rep–Ant complex. Each chain is colored purple or yellow.
Fig. S2.
Fig. S2.
Sequence alignments of Rep (A) and Ant (B). Multialignment of S. Typhimurium Rep (UniProtKB accession no. T1S9Z0) against Rep from Salmonella phage epsilon15 (UniProtKB accession no. Q858D7), Escherichia phage phiV10 (UniProtKB accession no. Q286X7), Escherichia phage TL-2011b (UniProtKB accession no. G9L6A6), Salmonella phage SPN1S (UniProtKB accession no. H2D0H9), Salmonella phage SPN9TCW (UniProtKB accession no. M1F232), E. coli O118:H16 str. 2009C-4446 (UniProtKB accession no. A0A028E2H1), E. coli KTE235 (Ensembl Bacteria accession no. ELD77068), E. coli UMEA 3290-1 (Ensembl Bacteria accession no. ESK17367), E. coli MS 196-1 (UniProtKB accession no. D8BV09), E. coli O7:K1 str. CE10 (RefSeq accession no. YP_006144959), E. coli NA114 (RefSeq accession no. YP_006141898), E. coli MS 185-1 (RefSeq accession no. WP_000836295), E. coli 908519 (UniProtKB accession no. V0VMF3), Salmonella enterica subsp. enterica serovar Bareilly str. CFSAN000179 (EMBL-WGS accession no. KDQ92900), S. enterica subsp. enterica serovar Agona str. 632182-2 (Ensembl Bacteria accession no. ESH97837), Citrobacter koseri (UniProtKB accession no. A0A0A5IUU2), Enterobacter sp. MGH 15 (RefSeq accession no. WP_032636571), Enterobacter cloacae (RefSeq accession no. WP_032671854), Escherichia vulneris NBRC 102420 (UniProtKB accession no. A0A090UX00), Pantoea sp. GM01 (UniProtKB accession no. J2L6Z7), Serratia grimesii (UniProtKB accession no. A0A084YWL3), Serratia marcescens BIDMC 80 (Ensembl Bacteria accession no. EZQ69436), Candidatus Sodalis pierantonio str. SOPE (UniProtKB accession no. W0HLH1), Yersinia kristensenii (UniProtKB accession no. A0A088L5A4), S. enterica subsp. enterica serovar Newport str. CVM 19470 (Ensembl Bacteria accession no. EJA85693), S. enterica subsp. enterica serovar Enteritidis str. 3402 (UniProtKB accession no. V7Y6W8), Citrobacter werkmanii NBRC 105721 (UniProtKB accession no. A0A090TWG5), Citrobacter freundii GTC 09629 (Ensembl Bacteria accession no. EOD57340), S. enterica subsp. enterica serovar Newport str. CVM 19443 (Ensembl Bacteria accession no. EJA65811), E. coli O127:H6 (strain E2348/69/EPEC) (UniProtKB accession no. B7UGT4), Klebsiella oxytoca (RefSeq accession no. WP_032745644), Enterobacter aerogenes (RefSeq accession no. WP_032715140), Klebsiella pneumoniae (EMBL CDS accession no. AHM80771), Cronobacter sakazakii CMCC 45402 (UniProtKB accession no. V5TYG0), Cronobacter malonaticus (RefSeq accession no. WP_032982558), Cronobacter turicensis 564 (UniProtKB accession no. K8BK39), and C. malonaticus (RefSeq accession no. WP_032983317). Multialignment of Ant (UniProtKB accession no. T1SA45) against Ant from Salmonella phage epsilon15 (UniProtKB accession no. Q858F6), Escherichia phage phiV10 (UniProtKB accession no. Q286Z4), Escherichia phage TL-2011b (UniProtKB accession no. G9L6E3), Salmonella phage SPN1S (UniProtKB accession no. H2D0F7), Salmonella phage SPN9TCW (UniProtKB accession no. M1EZ64), S. enterica subsp. enterica serovar Enteritidis str. 3402 (UniProtKB accession no. V7Y2G6), S. enterica subsp. enterica serovar Newport str. CVM 19470 (Ensembl Bacteria accession no. EJA85653), S. enterica subsp. enterica serovar Agona str. 632182-2 (Ensembl Bacteria accession no. ESH97805), C. freundii GTC 09479 (EMBL-WGS accession no. EMF20587), E. coli O127:H6 (UniProtKB accession no. B7UGQ3), C. malonaticus (RefSeq accession no. WP_032986301), E. vulneris NBRC 102420 (UniProtKB accession no. A0A090V1M3), K. pneumoniae subsp. pneumoniae KPNIH10 (UniProtKB accession no. A0A0E1DF28), C. sakazakii CMCC 45402 (UniProtKB accession no. V5U0K5), Enterobacter sp. MGH 15 (Ensembl Bacteria accession no. EUM54292), K. oxytoca (RefSeq accession no. WP_032745680), S. enterica subsp. enterica serovar Newport str. CVM 19443 (Ensembl Bacteria accession no. EJA65772), E. cloacae (RefSeq accession no. WP_032671830), C. koseri (UniProtKB accession no. A0A0A5IVX8), S. enterica subsp. enterica serovar Bareilly str. CFSAN000179 (Ensembl Bacteria accession no. KDQ92930), E. coli NA114 (RefSeq accession no. YP_006141911), E. coli 908519 (UniProtKB accession no. V0V944), E. coli UMEA 3290-1 (EMBL-WGS accession no. ESK17333), E. coli KTE235 (EMBL-WGS accession no. ELD77031), Y. kristensenii (UniProtKB accession no. A0A088L842), E. coli O7:K1 str. CE10 (RefSeq accession no. YP_006144928), E. aerogenes UCI 15 (RefSeq accession no. WP_032723151), C. malonaticus (RefSeq accession no. WP_032983289), C. turicensis 564 (UniProtKB accession no. K8BRJ5), E. coli O7:K1 (strain IAI39/ExPEC) (RefSeq accession no. YP_002408599), E. coli O1:K1/APEC (RefSeq accession no. YP_853609), C. werkmanii NBRC 105721 (UniProtKB accession no. A0A090TUF1), Pantoea sp. GM01 (UniProtKB accession no. J2LY07), S. marcescens BIDMC 80 (Ensembl Bacteria accession no. EZQ69401), and E. coli FCP1 (RefSeq accession no. WP_025651152). Secondary structure elements were assigned by PyMOL (The PyMOL Molecular Graphics System, www.pymol.org). Every tenth residue is marked by a black dot. Strictly 100% conserved residues are highlighted in red. Cylinders above the sequences denote α-helices. A dotted line denotes disordered regions.
Fig. S3.
Fig. S3.
Electron density from initial phasing and anomalous difference Fourier maps of the Rep–Ant complex containing selenium in the asymmetric unit. (A) Initial phased map (1.5 σ) by the SAD method. (B) A composite simulated annealed omit map (1.5 σ) for Rep92–198 showing electron density around the MDD and CAD of Rep92–198. (C) Anomalous difference Fourier maps in the asymmetric unit illustrating the positions of selenium atoms from the WT Rep–Ant complex are shown in mesh. |(Fo-Fc)| difference density is contoured at 4σ. Each chain is shown in a different color, and magnified views of two representative regions are shown.
Fig. 3.
Fig. 3.
Quaternary structure of Rep, Ant, and the Rep–Ant complex and the solution structure of the Rep92–198 tetramer. (A) Rep (red line), Ant (black line), and the Rep–Ant complex (blue line) were analyzed by SEC-MALS. The dotted line represents the measured molecular mass. (B) Overall crystal structure of the Rep92–198 tetramer and magnified stereo view showing details of the interaction at the interface of two Rep92–198 dimers. Each chain is shown in a different color.
Fig. S4.
Fig. S4.
Disallowed regions of the Rep92–198 tetramer structure. |(2Fo-Fc)| difference density (1.5 σ) around the positions of disallowed residues (red balls). Each chain is shown in a different color, and magnified views of two representative regions are shown.
Fig. 4.
Fig. 4.
Concentration-dependent oligomerization of Rep1–198 and Rep92–198. (A) Analytical gel filtration profiles of Rep1–198 (red), the Rep1–198 F187A mutant (green), Rep92–198 (purple), the Rep1–198/Ant1–86 complex (pink), and the Rep92–198/Ant1–86 complex (blue) at high (8.5 mg/mL, solid lines and left y axis) and low (0.7 mg/mL, dotted lines and right y axis) concentrations. (B) Summary of the hydrodynamic analysis in Fig. 4A. RH from Hydropro, Stokes radii calculated from structure models (Fig. S5).
Fig. S5.
Fig. S5.
Structure models and theoretical RH values. Structure models for RH calculation were generated based on the crystal structures of the Rep1–198/Ant1–86 complex and the Rep92–198 tetramer and were used for comparison with those of analytical gel filtration (Fig. 4B). The two invisible NDDs of the Rep1–198/Ant1–86 complex were incorporated by superimposing visible NDDs. The Rep1–198 dimer model was obtained from the Rep1–198/Ant1–86 complex without modifying the NDD positions. To obtain the overall model of the full-length Rep tetramer, NDDs were positioned by superimposing full-length Rep on the Rep92–198 tetramer.
Fig. 5.
Fig. 5.
Molecular interactions of the Rep–Ant complex in detail. (A and B) Magnified stereo views showing detailed interactions at the Ant–Rep interfaces (the CAD and the NDD, respectively). (C) SPR sensorgrams of mutants of the Rep–Ant complex (Rep F187A, Ant R37D, Ant N58R, and Ant Y76A, respectively).
Fig. 6.
Fig. 6.
Functional analysis of the NDD and DNA-binding model of the Rep tetramer. (A) Electrostatic potential at the molecular surface of the Rep–Ant complex. Three key residues (Asn36, Arg40, and Lys46) are shown in red, and the interface between the NDD and Ant is shown with orange dashed lines. (B, Right) Comparisons of the DNA binding of various Rep proteins by BLI. (Left) Representative BLI sensorgrams of Rep1–198 (red), Rep–Ant complex (pink), Rep1–198 F187A (green), Rep1–72 (gray), Rep92–198 (light blue), and Rep1–198 mutants (N36A in orange, R40A in purple, and K46A in light yellow). Each experiment was repeated three times. (C) The Rep V69R proteins with (purple line) and without (red line) DNA were analyzed by SEC-MALS. The dotted line represents the measured molecular mass. (D) Dual-plasmid bioluminescence reporter assay with WT and mutant Rep. Vertical arrows indicate arabinose induction. Results are representative of three independent experiments. D.W., distilled water; Empty, empty vector (pBAD24); RLU, relative light units.
Fig. S6.
Fig. S6.
Kinetics of Rep mutants on target DNA measured using a single-molecule PIFE assay. (A) Structures of Cy3 dye undergoing cistrans isomerization. Changes in the external environmental, such as the approach of proteins or an increase in solvent viscosity, can hinder the isomer conversion from the trans (fluorescent) state (Upper) to the cis (nonfluorescent) state (Lower), resulting in an increase in fluorescence intensity. (B) Fluorescence spectra of Cy3 on 50 nM target DNA (Table S3) in the absence (red) and presence (blue) of the Rep V69R mutant (500 nM). (C) Relative enhancement in the fluorescence intensity with various Rep mutants. The enhanced intensity was calculated as the ratio of the total integrated intensity of each spectrum. (D) Representative single-molecule time trajectory of Cy3 upon the injection of the V69R mutant (20 nM). The Rep-bound state of the target DNA (on-state) shows a higher level of fluorescence emission from Cy3, whereas the lower level of emission represents free DNA without Rep binding (off-state). The black arrow indicates the time when Rep mutants were injected into a flow chamber. (E) Histograms for the dwell time of the Rep on-state (Left) and Rep off-state (Right), with single exponential fits (red curves).
Fig. S7.
Fig. S7.
Comparison of the structure of the Rep NDD with that of other Rep–DNA complexes. (A) The superimposition of the Rep NDD with other N-terminal domains of repressors in complex with DNA. The Rep NDD is superimposed on other Reps derived from phages: Rep from SPC32H (pink), CI from phage 434 (cyan), Cro from phage lambda (orange), CI from phage lambda (yellow), C2 from phage P22 (gray), and Cro from phage 434 (blue). The DNA was derived from PDB ID code 2OR1. (B) The superimposition of the Rep NDD (pink) with CI from phage 434 (cyan) showing critical residues for DNA binding. (C) SDS/PAGE of WT and mutant proteins of Rep (N36A, R40A, and K46A) used in this study. (D) Analytical gel filtration profiles of Rep1–198 V69R mutant (5.5 μM) with (purple line and right y axis) and without (green line and left y axis) DNA. (E) Evaluation of DNA binding for WT and mutant Reps by EMSA. Increasing amounts (0, 6, 12, and 24 nM) of the indicated proteins were incubated with a radiolabeled hot probe and then were subjected to EMSA (details are given in SI Materials and Methods). An unlabeled cold probe (0.48, 0.96, and 4.5 μg) was also added to the indicated WT protein lanes. B1, fragments retarded by dimerized Rep; B2, fragments retarded by tetramerized Rep; F, unbound fragments. Increasing amounts of indicated Rep mutants (F187A, R40A, K46A, and N36A) were also incubated with a radiolabeled hot probe and then subjected to EMSA.
Fig. S8.
Fig. S8.
cis and trans models of the Rep–DNA complex and schematic of the in vivo evaluation of Rep repression by dual-plasmid bioluminescence reporter assays. (A) Ribbon diagrams of cis and trans models of the Rep–DNA complex. (B) Schematic of dual-plasmid bioluminescence reporter assays (details are given in SI Materials and Methods). The repression function of Rep and its derivatives was evaluated by measuring the cellular bioluminescence and A600.
Fig. 7.
Fig. 7.
Lytic switch by the Rep–Ant interaction and the overall model. (A) Evaluation of the antirepression function of WT and mutant Ants by a disk diffusion assay (details are given in SI Materials and Methods). The turbidity (Left) and the diameter (Right) of the bacterial lysis zones generated by Ant-mediated prophage induction were compared. Averages and SD from three independent experiments are shown. *P < 0.05. (B) The DNA-stripping activities of WT Ant (red) and the Y76A mutant (blue). Buffer and Ant (WT or the Y76A mutant) were injected as indicated by the arrows. (C) Comparison of the prophage induction rates in Salmonella cells lysogenized by each indicated phage. MMC, mitomycin C. (D) Overall model of noncanonical DNA recognition by Rep and the mechanism of its inactivation by Ant. Each chain is drawn in a different color.
Fig. S9.
Fig. S9.
Schematic of the SPC32H genome structure and the position of Rep operators in the genome. Horizontal arrows indicate the predicted ORFs of SPC32H, and vertical lines through the genome indicate Rep operator sites. Red, consensus Rep operator sequence; blue, consensus sequence with a 1-bp mismatch; yellow, consensus sequence with 2-bp mismatches. The box outlined by the green dashed line represents the region used in EMSA binding studies.

Similar articles

Cited by

References

    1. Browning DF, Busby SJ. The regulation of bacterial transcription initiation. Nat Rev Microbiol. 2004;2(1):57–65. - PubMed
    1. León E, et al. A bacterial antirepressor with SH3 domain topology mimics operator DNA in sequestering the repressor DNA recognition helix. Nucleic Acids Res. 2010;38(15):5226–5241. - PMC - PubMed
    1. Oppenheim AB, Neubauer Z, Calef E. The antirepressor: A new element in the regulation of protein synthesis. Nature. 1970;226(5240):31–32. - PubMed
    1. Luo Y, et al. Crystal structure of LexA: A conformational switch for regulation of self-cleavage. Cell. 2001;106(5):585–594. - PubMed
    1. Wang HC, Ho CH, Hsu KC, Yang JM, Wang AH. DNA mimic proteins: Functions, structures, and bioinformatic analysis. Biochemistry. 2014;53(18):2865–2874. - PubMed

Publication types