. 2016 Jun 10;90(13):6001-6013.
doi: 10.1128/JVI.00451-16. Print 2016 Jul 1.

Interferon Alpha Subtype-Specific Suppression of HIV-1 Infection In Vivo

Affiliations

Interferon Alpha Subtype-Specific Suppression of HIV-1 Infection In Vivo

Kerry J Lavender et al. J Virol. .

Abstract

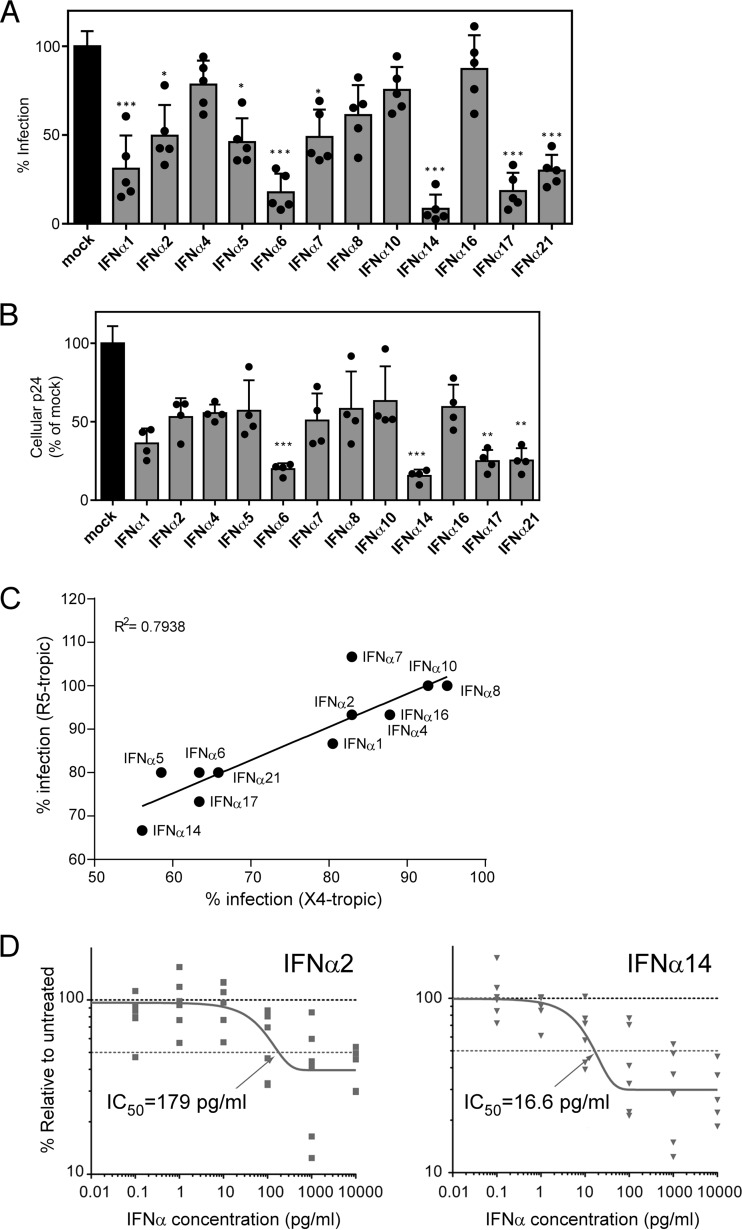
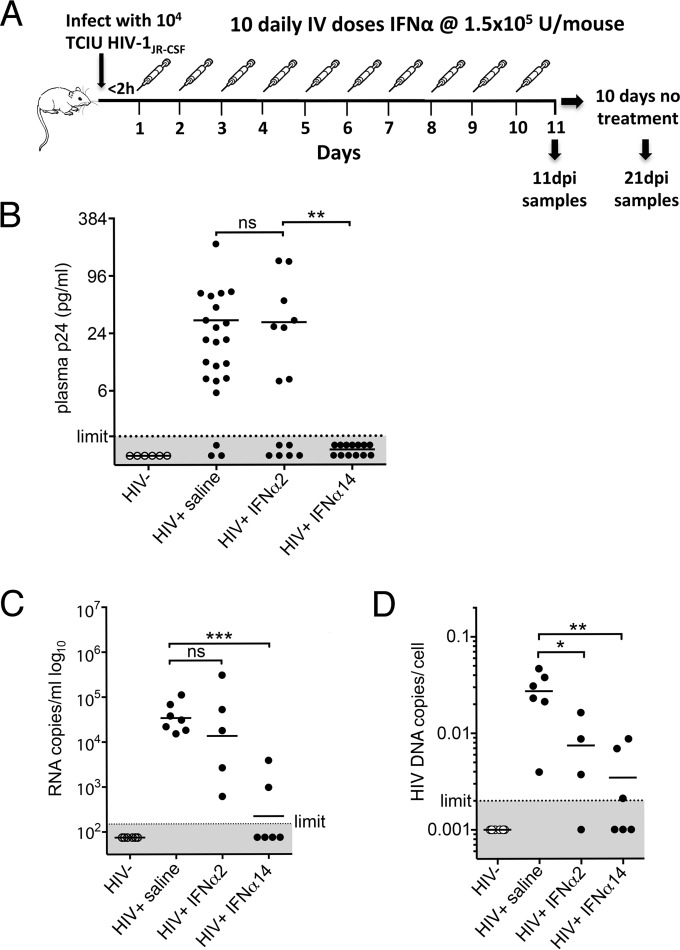
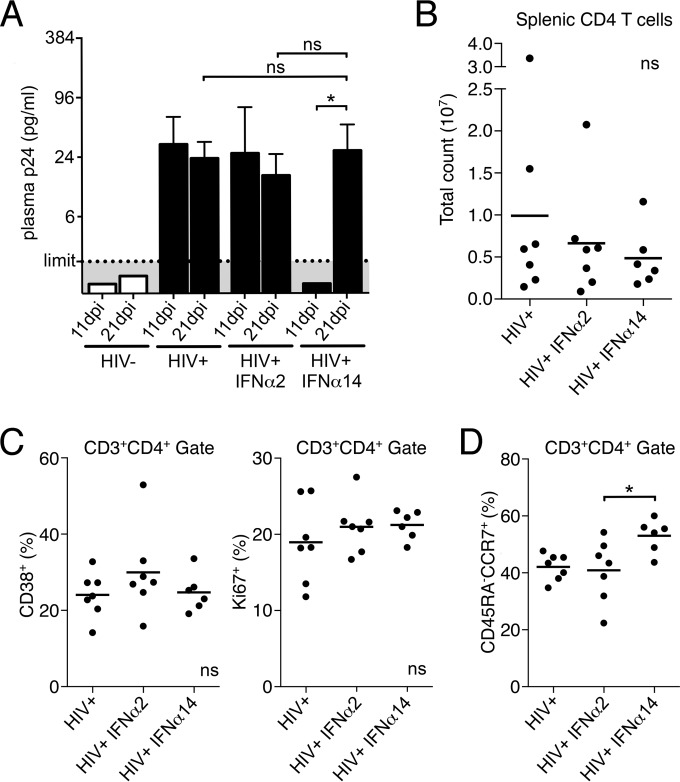
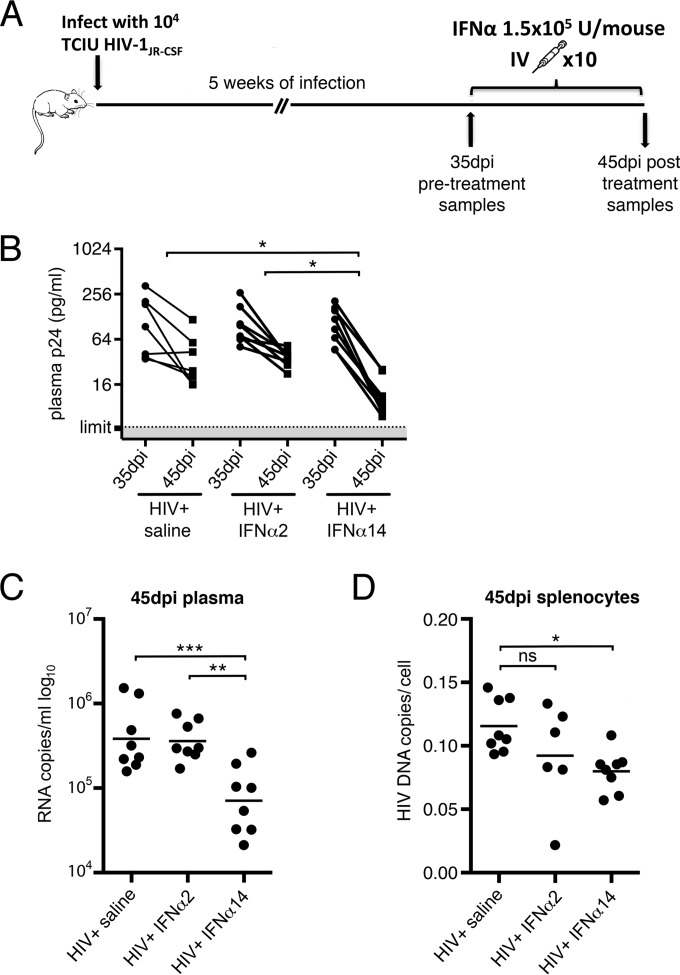
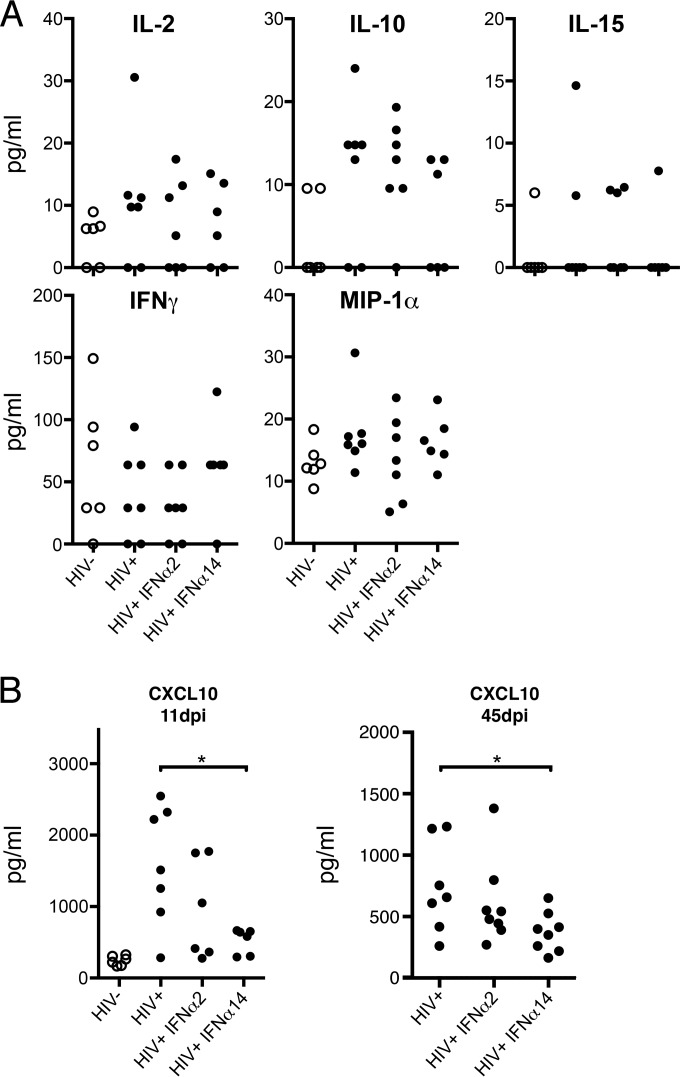
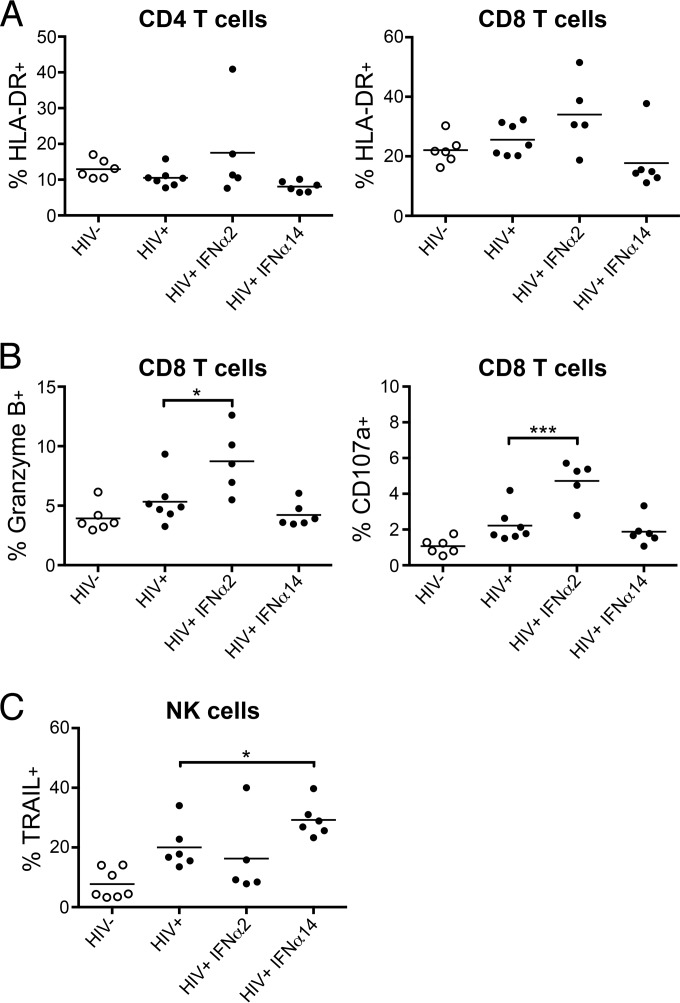
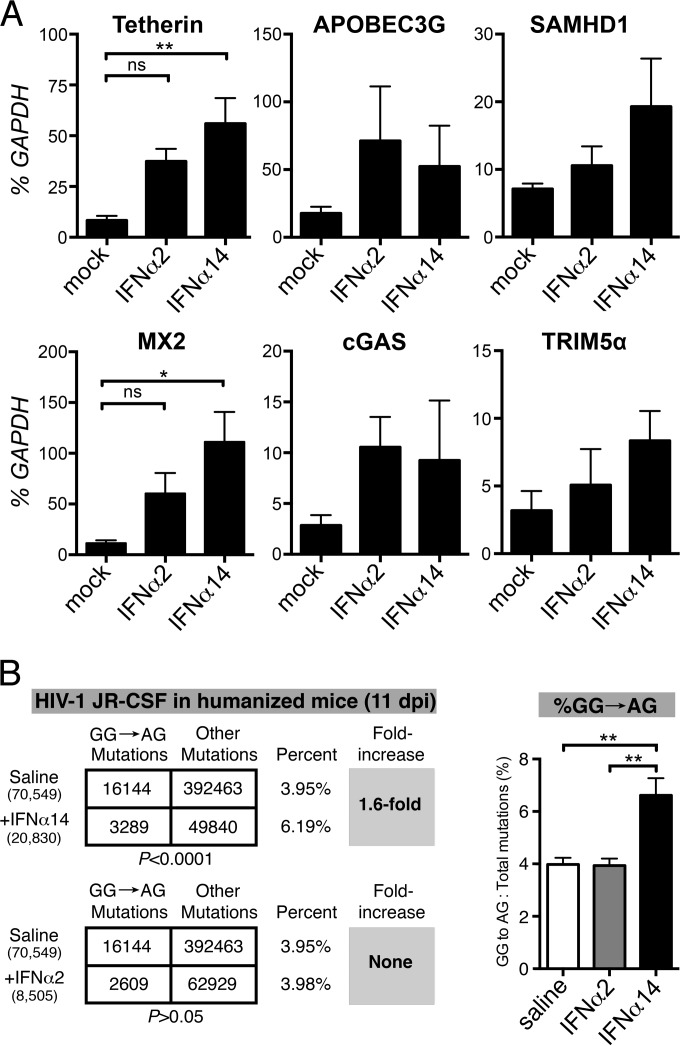
Although all 12 subtypes of human interferon alpha (IFN-α) bind the same receptor, recent results have demonstrated that they elicit unique host responses and display distinct efficacies in the control of different viral infections. The IFN-α2 subtype is currently in HIV-1 clinical trials, but it has not consistently reduced viral loads in HIV-1 patients and is not the most effective subtype against HIV-1 in vitro We now demonstrate in humanized mice that, when delivered at the same high clinical dose, the human IFN-α14 subtype has very potent anti-HIV-1 activity whereas IFN-α2 does not. In both postexposure prophylaxis and treatment of acute infections, IFN-α14, but not IFN-α2, significantly suppressed HIV-1 replication and proviral loads. Furthermore, HIV-1-induced immune hyperactivation, which is a prognosticator of disease progression, was reduced by IFN-α14 but not IFN-α2. Whereas ineffective IFN-α2 therapy was associated with CD8(+) T cell activation, successful IFN-α14 therapy was associated with increased intrinsic and innate immunity, including significantly higher induction of tetherin and MX2, increased APOBEC3G signature mutations in HIV-1 proviral DNA, and higher frequencies of TRAIL(+) NK cells. These results identify IFN-α14 as a potent new therapeutic that operates via mechanisms distinct from those of antiretroviral drugs. The ability of IFN-α14 to reduce both viremia and proviral loads in vivo suggests that it has strong potential as a component of a cure strategy for HIV-1 infections. The broad implication of these results is that the antiviral efficacy of each individual IFN-α subtype should be evaluated against the specific virus being treated.

Importance: The naturally occurring antiviral protein IFN-α2 is used to treat hepatitis viruses but has proven rather ineffective against HIV in comparison to triple therapy with the antiretroviral (ARV) drugs. Although ARVs suppress the replication of HIV, they fail to completely clear infections. Since IFN-α acts by different mechanism than ARVs and has been shown to reduce HIV proviral loads, clinical trials are under way to test whether IFN-α2 combined with ARVs might eradicate HIV-1 infections. IFN-α is actually a family of 12 distinct proteins, and each IFN-α subtype has different efficacies toward different viruses. Here, we use mice that contain a human immune system, so they can be infected with HIV. With this model, we demonstrate that while IFN-α2 is only weakly effective against HIV, IFN-α14 is extremely potent. This discovery identifies IFN-α14 as a more powerful IFN-α subtype for use in combination therapy trials aimed toward an HIV cure.


Figures

FIG 1
FIG 1
Inhibition of HIV-1 replication by IFN-α subtypes in vitro. (A and B) The infectivity of supernatants harvested from PBMCs exposed to X4-tropic HIV-1NL4-3_IRES_eGFP in the presence of different human IFN-α subtypes for 2 days was determined. (A) The supernatants were incubated with TZM-bl reporter cells, and β-galactosidase activity was compared to that of untreated supernatants after 3 days of incubation. (B) Additionally, the cells were lysed, and the cellular p24 protein content was analyzed by ELISA. Five healthy donors were used for the IFN-α inhibition assay, and the TZM-bl assay was measured in triplicate. Mean values plus standard errors of the mean (SEM) are shown, and individual donors are represented by dots. ***, P < 0.001; **, P < 0.01; *, P < 0.05; determined by one-way analysis of variance (ANOVA) with Dunnett's posttest. (C) The infectivities of IFN-α-treated X4- and R5-tropic viruses relative to untreated PBMCs were determined and compared using a Pearson correlation test. (D) Dose-response inhibition in mucosal immune cells. LPMCs (n = 6 donors) were infected with HIV-1BaL, resuspended with various doses of IFN-α2 and IFN-α14 (or mock infected), and evaluated for intracellular Gag p24+ expression in CD3+ CD8 cells at 4 dpi by flow cytometry. The data were normalized against mock infection for each donor. The dose-response curves were generated using a one-phase decay equation that was also used to evaluate the IC50.
FIG 2
FIG 2
IFN-α14 suppression of HIV-1 replication in vivo. (A) The in vivo experimental design consisted of intraperitoneal infection of TKO-BLT mice with 104 TCIU of HIV-1JR-CSF, followed by intravenous administration of either IFN-α2, IFN-α14, or mock saline within 2 h of infection. Treatment was administered daily for 10 consecutive days, followed by sample collection either 24 h after the final injection (11 dpi) or after an additional 10-day period of no treatment (21 dpi). (B) HIV-1 p24 levels detected by ELISA in plasma collected from HIV-1JR-CSF-infected TKO-BLT mice 24 h after the final IFN treatment (11 dpi). The dots represent individual mice reconstituted from three separate human donors. The results comparing controls to IFN-α2 and IFN-α2 to IFN-α14 (detectable p24 versus undetectable p24) were analyzed by chi-square analysis with a Bonferroni correction for multiple comparisons (**, P = 0.0019; ns, not significant). (C) HIV-1 RNA copies per milliliter of plasma at 11 dpi, detected by quantitative PCR (qPCR). (D) HIV-1 proviral copies detected in CD4 cell-enriched TKO-BLT splenocytes at 11 dpi. One of the samples from the IFN-α2 group did not provide data, as the PCR was inhibited. (B to D) The horizontal lines denote means. (C and D) Statistical analyses were done by one-way ANOVA with Dunnett's posttest for multiple comparisons. ***, P < 0.001; **, P < 0.01; *, P < 0.05. Each dot represents a separate mouse.
FIG 3
FIG 3
Cessation of IFN-α14 treatment. (A) HIV-1 p24 levels (means plus standard deviations [SD]) in plasma of mice 24 h after the final IFN injection (11 dpi) and after 10 additional days of no treatment (21 dpi). Limit, limit of detection within each assay. HIV, n = 7; HIV+, n = 7; HIV+ IFN-α2, n = 7; HIV+ IFN-α14, n = 6. Paired t tests between 11 and 21 dpi were done for each treatment group; one-way ANOVA with Tukey's posttest was used to compare treatment groups at 21 dpi. (B) CD4+ T cell counts in spleens of mice at 21 dpi. (C and D) Frequencies of activated (CD38+) and proliferating (Ki67+) (C) and central memory (CD45RA CCR7+) (D) CD4+ T cells at 21 dpi. The horizontal lines denote means. ns, not significant; *, P < 0.05 (one-way ANOVA with Tukey's posttest). Each dot represents a separate mouse.
FIG 4
FIG 4
IFN-α14 suppression of established HIV-1 infection. (A) The in vivo experimental design consisted of intraperitoneal infection of TKO-BLT mice with 104 TCIU of HIV-1JR-CSF, followed by 5 weeks of infection. At 35 dpi, plasma p24 levels were determined and the mice were assigned to similarly infected treatment groups for intravenous (IV) administration of IFN-α2, IFN-α14, or mock saline. Treatment was administered daily for 10 consecutive days, followed by sample collection 24 h after the final injection (45 dpi). (B) Levels of HIV-1 antigenemia as determined by p24 ELISA at the start (35 dpi) and 24 h after the final IFN injection (45 dpi). The percent reduction in plasma p24 was used to determine significance by one-way ANOVA with Tukey's posttest. (C) HIV-1 RNA copies per milliliter of plasma at 45 dpi, detected by qPCR. (D) HIV-1 proviral copies detected in CD4 cell-enriched TKO-BLT splenocytes at 45 dpi. The horizontal lines denote means. Statistical analyses were done by one-way ANOVA with Tukey's posttest. ns, not significant; ***, P < 0.001; **, P < 0.01; *, P < 0.05. Each dot represents a separate mouse.
FIG 5
FIG 5
Plasma cytokine analysis. (A) Plasma was collected 24 h after the final IFN-α injection in both the acute- and established-infection experiments and assayed for human cytokine and chemokine levels using a custom 11-plex bead assay. Data from 11 days postinfection are shown. (B) Comparison of CXCL10 levels in plasma collected from mice at 11 dpi (one-way ANOVA with Dunnet's posttest; *, P < 0.05) or 45 dpi (unpaired t test; *, P < 0.05). Analyte levels were quantified in picograms per milliliter of TKO-BLT plasma using standards provided with the assay. Each dot represents a separate mouse.
FIG 6
FIG 6
IFN-α-induced changes in cell-mediated responses. Flow cytometry was used to analyze activation and functional markers on T cells and NK cells. (A) Frequency of activated (HLA-DR+) CD4 and CD8 T cells in spleens of mice from each treatment group at 11 dpi. (B) Frequency of splenic CD8+ T cells positive for cytoplasmic Granzyme B and membrane-bound CD107a at 11 dpi. Statistical analyses were done by one-way ANOVA with Dunnet's posttest. ***, P < 0.001; *, P < 0.05. (C) Percentages of splenic NK cells expressing the cytotoxic effector molecule TRAIL at 11 dpi. *, P < 0.05 (t test between HIV-1+ mock-treated and IFN-α14-treated groups). The horizontal lines denote the means. Each dot represents a separate mouse.
FIG 7
FIG 7
Induction of ISGs. (A) The transcription levels of six ISGs encoding HIV-1 sensors or restriction factors were determined in splenocytes harvested from HIV-1-negative TKO-BLT mice 6 h after intravenous injection with a single 1.5 × 10⁵ U dose of the indicated IFN or mock saline control injection. RNA levels were determined by qPCR and are expressed as a percentage (means + SEM) of the human housekeeping GAPDH transcripts detected in the same sample. n = 5 mice per group. Statistical analyses were done by one-way ANOVA with Tukey's posttest. ns, not significant; **, P < 0.01; *, P < 0.05. (B) Evaluation of APOBEC3G signature mutations in IFN-α-treated mice. A 350-bp segment of the HIV-1 gp41/nef region was amplified from lymph node DNA from humanized mice treated with saline (n = 5), IFN-α14 (n = 4), and IFN-α2 (n = 3) at 11 dpi for next-generation sequencing. (Left) DNA sequences from all mice per cohort were pooled, and the relative numbers of GG→AG mutations relative to the total number of mutations were compared using a 2-by-2 contingency test with Yates' correction. The numbers of sequences analyzed are shown in parentheses, and the percentages of GG→AG mutations relative to the total number of mutations are shown. (Right) Percentages (means + SD) of GG→AG mutations relative to the total number of mutations computed per mouse. **, P < 0.01 (one-way ANOVA with Bonferroni's posttest).

Similar articles

Cited by

References

    1. Hardy MP, Owczarek CM, Jermiin LS, Ejdeback M, Hertzog PJ. 2004. Characterization of the type I interferon locus and identification of novel genes. Genomics 84:331–345. doi:10.1016/j.ygeno.2004.03.003. - DOI - PubMed
    1. Thomas C, Moraga I, Levin D, Krutzik PO, Podoplelova Y, Trejo A, Lee C, Yarden G, Vleck SE, Glenn JS, Nolan GP, Piehler J, Schreiber G, Garcia KC. 2011. Structural linkage between ligand discrimination and receptor activation by type I interferons. Cell 146:621–632. doi:10.1016/j.cell.2011.06.048. - DOI - PMC - PubMed
    1. Jaks E, Gavutis M, Uze G, Martal J, Piehler J. 2007. Differential receptor subunit affinities of type I interferons govern differential signal activation. J Mol Biol 366:525–539. doi:10.1016/j.jmb.2006.11.053. - DOI - PubMed
    1. Lavoie TB, Kalie E, Crisafulli-Cabatu S, Abramovich R, DiGioia G, Moolchan K, Pestka S, Schreiber G. 2011. Binding and activity of all human alpha interferon subtypes. Cytokine 56:282–289. doi:10.1016/j.cyto.2011.07.019. - DOI - PubMed
    1. Cull VS, Tilbrook PA, Bartlett EJ, Brekalo NL, James CM. 2003. Type I interferon differential therapy for erythroleukemia: specificity of STAT activation. Blood 101:2727–2735. doi:10.1182/blood-2002-05-1521. - DOI - PubMed

Publication types

MeSH terms