. 2016 Jun;15(6):2186-202.
doi: 10.1074/mcp.M115.057117. Epub 2016 Apr 20.

Quantitative Tagless Copurification: A Method to Validate and Identify Protein-Protein Interactions

Affiliations

Quantitative Tagless Copurification: A Method to Validate and Identify Protein-Protein Interactions

Maxim Shatsky et al. Mol Cell Proteomics. 2016 Jun.

Abstract

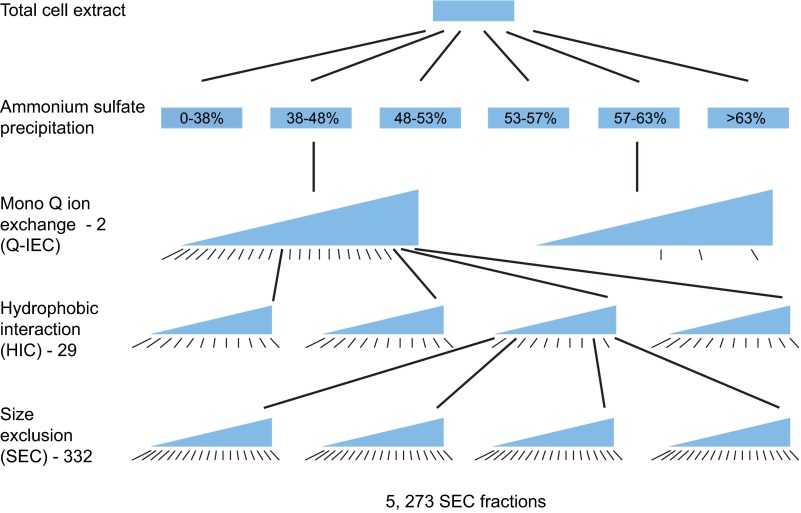
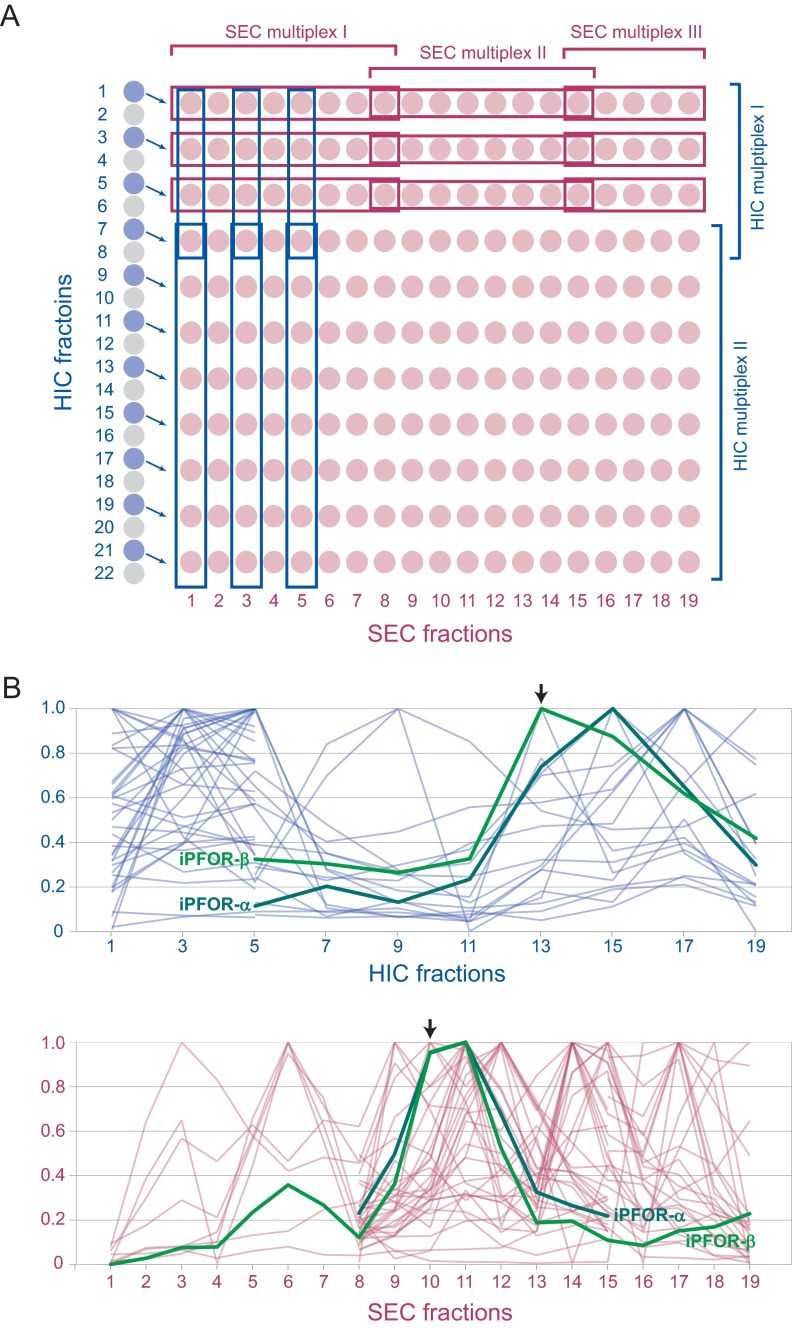
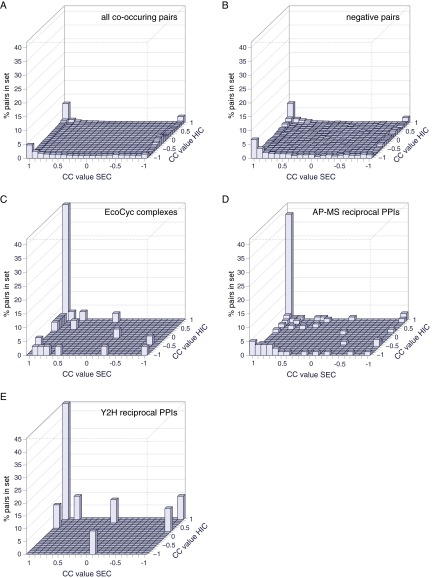
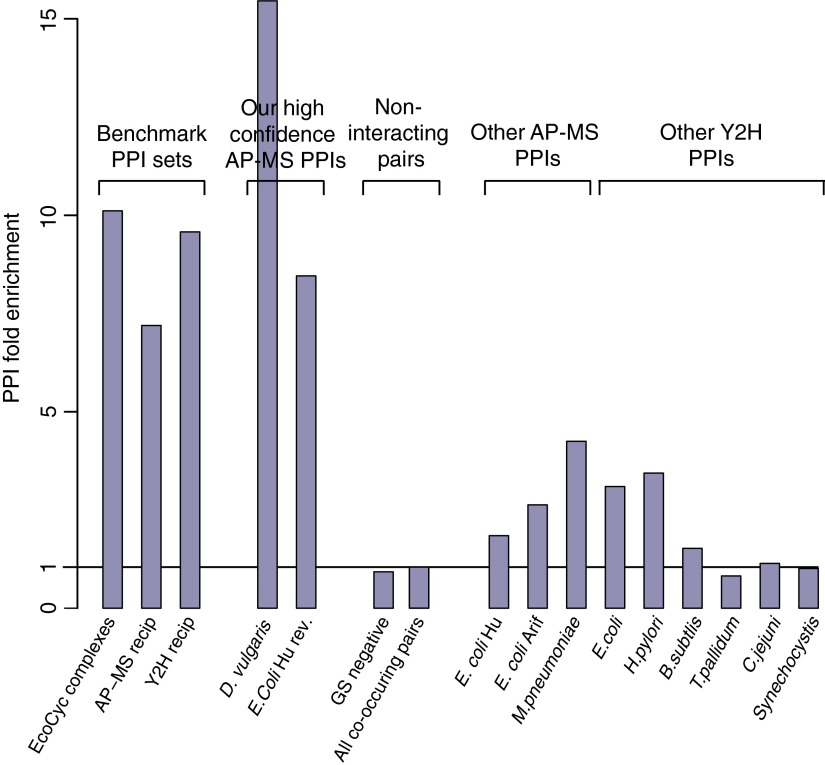
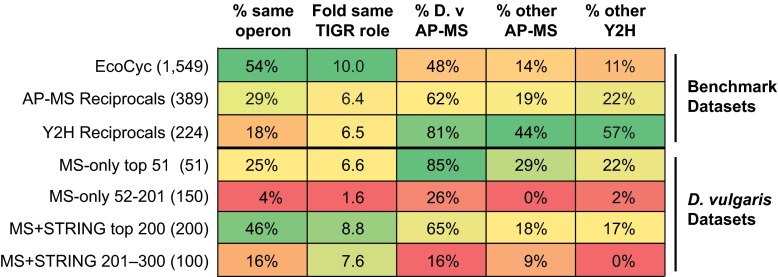
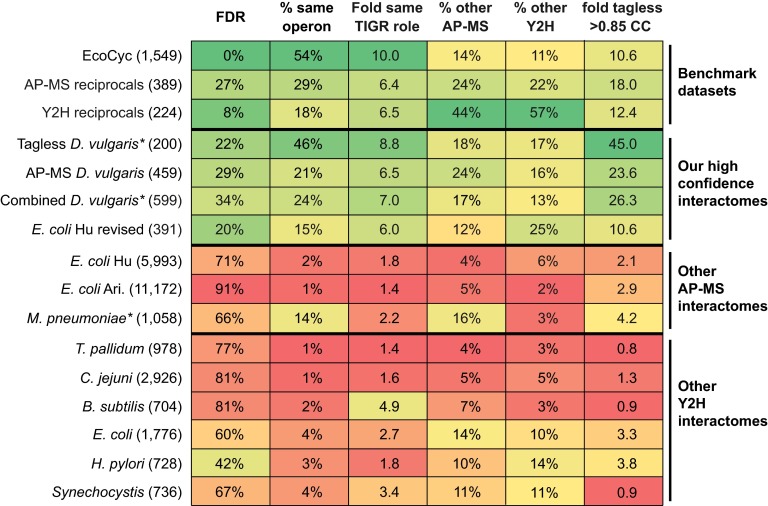
Identifying protein-protein interactions (PPIs) at an acceptable false discovery rate (FDR) is challenging. Previously we identified several hundred PPIs from affinity purification - mass spectrometry (AP-MS) data for the bacteria Escherichia coli and Desulfovibrio vulgaris These two interactomes have lower FDRs than any of the nine interactomes proposed previously for bacteria and are more enriched in PPIs validated by other data than the nine earlier interactomes. To more thoroughly determine the accuracy of ours or other interactomes and to discover further PPIs de novo, here we present a quantitative tagless method that employs iTRAQ MS to measure the copurification of endogenous proteins through orthogonal chromatography steps. 5273 fractions from a four-step fractionation of a D. vulgaris protein extract were assayed, resulting in the detection of 1242 proteins. Protein partners from our D. vulgaris and E. coli AP-MS interactomes copurify as frequently as pairs belonging to three benchmark data sets of well-characterized PPIs. In contrast, the protein pairs from the nine other bacterial interactomes copurify two- to 20-fold less often. We also identify 200 high confidence D. vulgaris PPIs based on tagless copurification and colocalization in the genome. These PPIs are as strongly validated by other data as our AP-MS interactomes and overlap with our AP-MS interactome for D.vulgaris within 3% of expectation, once FDRs and false negative rates are taken into account. Finally, we reanalyzed data from two quantitative tagless screens of human cell extracts. We estimate that the novel PPIs reported in these studies have an FDR of at least 85% and find that less than 7% of the novel PPIs identified in each screen overlap. Our results establish that a quantitative tagless method can be used to validate and identify PPIs, but that such data must be analyzed carefully to minimize the FDR.


Figures

Fig. 1.
Fig. 1.
Scheme for the tagless fractionation. Ten grams of soluble protein cellular extract was subject to Ammonium Sulfate (AS) precipitation. Two out of the resulting six fractions were then subject to MonoQ ion exchange (Q-IEC) chromatography. 26 fractions from the Q-IEC column from the 38–48% AS step were separated by Hydrophobic interaction chromatography (HIC), whereas only 3 Q-IEC fractions from the 57–63% AS step were separated by HIC. 332 fractions from the HIC dimension were then each subject to Size exclusion chromatography (SEC), generating a set of 5273 SEC fractions that were subject to two dimensional iTRAQ mass spectrometry as described in Fig. 2A. Only a small subset of the HIC and SEC columns run are shown. The black lines below each fractionation step show those fractions subject to further separation or, in the case of the SEC fractions, to iTRAQ MS/MS analysis.
Fig. 2.
Fig. 2.
Two dimensional iTRAQ labeling reveals elution profiles in SEC and HIC dimensions. A, Left are shown 22 fractions eluted from a single HIC column. Every other fraction (11 blue disks) was separated on an SEC column, each producing 19 SEC fractions (red disks). The resulting total of 11 × 19 = 228 SEC fractions were digested with trypsin and each digested sample split into several portions to be used for mapping protein elution across the SEC and HIC dimensions (see Experimental Procedures). Two or more portions of each fraction were labeled with an iTRAQ reagent and combined with other fractions labeled with different isobaric iTRAQ reagents to form multiplexes. Multiplexes of up to 8 fractions are allowed by iTRAQ, and thus several multiplexes are required to determine the elution profiles across each column. A common “joint” fraction was included in adjacent multiplexes. Fractions were combined to form multiplexes that track protein elution along the SEC dimension (horizontal) and, separately, along the HIC dimension (vertical). For simplicity only three joined series of multiplexes are shown for each dimension, but from a single HIC column typically 10 joined series would cover the HIC dimension and 10–12 the SEC dimension. B, The iTRAQ elution profiles of proteins across the HIC dimension (top) and the SEC dimension (bottom) are shown. Only one joined series is shown for each dimension out of the larger number of series obtained for every HIC column run and its associated SEC fractions. The black arrows indicate the particular HIC fraction that was separated to produce the SEC profiles and the SEC fractions that were joined into multiplexes to generate profiles of a subset of the proteins eluting on the HIC dimension. The profiles for the alpha and beta subunits of indolepyruvate ferredoxin oxidoreductase (DVU1950 and DVU1951) are shown in bold green. The profiles of all other proteins detected are shown in red (SEC dimension) and blue (HIC dimension).
Fig. 3.
Fig. 3.
Distribution of the Pearson cross correlation (CC) scores for the SEC and HIC dimensions. Each plot shows the percentage of protein pairs in a given set that have the indicated maximum CC values for the SEC and the HIC dimensions. The two rows at −1 show the CC values where protein pairs are only detected in one dimension only. A, The set of all 146,792 co-occurring protein pairs. B, 1496 negative protein pairs unlikely to interact. C, 31 EcoCyc complex PPIs. D, 28 reciprocally confirmed AP-MS PPIs. E, 11 reciprocally confirmed Y2H PPIs. D–E are largely interologs of protein pairs defined using data from other species, except that some of the reciprocally confirmed AP-MS PPIs in D are from our D. vulgaris AP-MS interactome.
Fig. 4.
Fig. 4.
Enrichment of highly correlated, co-occurring protein pairs. The PPI fold enrichment of co-occurring protein pairs with CC values in both HIC and SEC dimensions ≥0.85 (Experimental Procedures; supplemental Table S1)). PPI fold enrichments are shown for different sets of protein pairs. To the left are the three benchmark data sets, though in this case D. vulgaris pairs were not included in the reciprocal AP-MS PPIs. Next are our two AP-MS interactomes for D. vulgaris and E. coli; the set of negative pairs unlikely to interact and the set of all co occurring protein pairs; and finally the nine earlier Y2H and AP-MS interactomes. The set of all co occurring protein pairs by definition have a PPI fold enrichment of 1.
Fig. 5.
Fig. 5.
PPI quality metrics for benchmark data sets and high and low confidence D. vulgaris tagless protein pair sets. The top three rows show metrics for benchmark bacterial data sets: the EcoCyc complexes (41), and protein pairs that have been reciprocally confirmed in either four AP-MS studies, including ours, or in six Y2H studies (Experimental Procedures) (6). The remaining rows show metrics for sets of protein pairs identified by the MS-only and MS+STRING logistic regressions. The regression scores were used to rank and separate PPIs into a high and low scoring set in each case. The numbers of protein pairs in each set are given in brackets. The columns show from left to right: the percent of pairs whose members are encoded in the same operon; fold enrichment of pairs for which both members have the same TIGR role over that expected among randomly chosen pairs; percent overlap with PPIs from the D. vulgaris AP-MS interactome; percent overlap with a combined set of interologs from the three bacterial AP-MS interactomes for other bacterial species; and percent overlap with a combined set of interologs from the six bacterial Y2H interactomes (Experimental Procedures; supplemental Table S2).
Fig. 6.
Fig. 6.
Combined AP-MS and tagless interactome for D. vulgaris. All 599 interactions present in the union of our high confidence AP-MS and tagless interactomes are shown. PPIs in both the AP-MS and tagless interactomes are shown in blue; PPIs only present in the tagless interactome are shown in orange; and PPIs only in the AP-MS interactome are shown in gray. PPIs also supported by additional evidence from gold standard positives or from AP-MS or Y2H screens in other bacteria are shown by wavy lines. Green ellipses show examples of complexes annotated in other species, as labeled.
Fig. 7.
Fig. 7.
PPI quality metrics for benchmark data sets and proposed bacterial interactomes. The top three rows show metrics for the three benchmark data sets described in Fig. 5. The remaining rows show metrics for our tagless, AP-MS and combined interactomes; the three other AP-MS interactomes (–27); and the six Y2H data sets (–33), see Experimental Procedures. The numbers of protein pairs in each set are given in brackets. The left most column shows the FDR estimated using gold standard positive and negatives sets based only on complexes from the EcoCyc data set or, in the case of the non E. coli studies, their interologs. The right most column shows the fold enrichment of highly correlated co-occurring protein pairs found in our tagless assay (supplemental Table S1). The remaining columns are as in Fig. 5. Data sets for which genome location data was used in addition to interaction data to identify protein pairs are indicated with *.

Similar articles

Cited by

References

    1. Alberts B., Johnson A., Lewis J., Raff M., Roberts K., and Walter P. (2007) Molecular Biol. Cell, 5 edition ed., Garland Science, New York.
    1. Kristensen A. R., and Foster L. J. (2013) High throughput strategies for probing the different organizational levels of protein interaction networks. Mol. bioSystems 9, 2201–2212 - PubMed
    1. von Mering C., Krause R., Snel B., Cornell M., Oliver S. G., Fields S., and Bork P. (2002) Comparative assessment of large-scale data sets of protein-protein interactions. Nature 417, 399–403 - PubMed
    1. Edwards A. M., Kus B., Jansen R., Greenbaum D., Greenblatt J., and Gerstein M. (2002) Bridging structural biology and genomics: assessing protein interaction data with known complexes. Trends Gen. 18, 529–536 - PubMed
    1. Vidal M., Cusick M. E., and Barabasi A. L. (2011) Interactome networks and human disease. Cell 144, 986–998 - PMC - PubMed

MeSH terms

Substances