. 2016 Jun;15(6):2169-85.
doi: 10.1074/mcp.M116.059188. Epub 2016 Apr 20.

Molecular Signatures of Membrane Protein Complexes Underlying Muscular Dystrophy

Affiliations

Molecular Signatures of Membrane Protein Complexes Underlying Muscular Dystrophy

Rolf Turk et al. Mol Cell Proteomics. 2016 Jun.

Abstract

Mutations in genes encoding components of the sarcolemmal dystrophin-glycoprotein complex (DGC) are responsible for a large number of muscular dystrophies. As such, molecular dissection of the DGC is expected to both reveal pathological mechanisms, and provides a biological framework for validating new DGC components. Establishment of the molecular composition of plasma-membrane protein complexes has been hampered by a lack of suitable biochemical approaches. Here we present an analytical workflow based upon the principles of protein correlation profiling that has enabled us to model the molecular composition of the DGC in mouse skeletal muscle. We also report our analysis of protein complexes in mice harboring mutations in DGC components. Bioinformatic analyses suggested that cell-adhesion pathways were under the transcriptional control of NFκB in DGC mutant mice, which is a finding that is supported by previous studies that showed NFκB-regulated pathways underlie the pathophysiology of DGC-related muscular dystrophies. Moreover, the bioinformatic analyses suggested that inflammatory and compensatory mechanisms were activated in skeletal muscle of DGC mutant mice. Additionally, this proteomic study provides a molecular framework to refine our understanding of the DGC, identification of protein biomarkers of neuromuscular disease, and pharmacological interrogation of the DGC in adult skeletal muscle https://www.mda.org/disease/congenital-muscular-dystrophy/research.


Figures

Fig. 1.
Fig. 1.
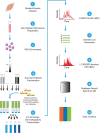
Schematic illustration of workflow. Skeletal muscle is dissected (1) and subjected to subcellular fractionation to enrich for membrane proteins (2). Glycoproteins and associated proteins are isolated using wheat-germ agglutinin (WGA) chromatography (3), and are separated by sucrose-gradient fractionation (4). Fractions of interest are spiked with cysteine carboxymethylated tryptic BSA peptides and subjected to ion-exchange chromatography to reduce sample volume; they are eluted using increasing salt concentrations (5). A first LC/MS run is performed on each elution fraction (6), and the peptides identified are used to generate a directed list (7). A directed LC-MS/MS run is then performed to provide quantitative data (8). Proteins are annotated based on queries of the Spectrum Mill database (9). The annotated quantitative data is then curated (10).
Fig. 2.
Fig. 2.
Disruption of the dystrophin-glycoprotein complex in DGC mutants. A, Sucrose-gradient sedimentation was used to analyze protein complexes in wheat-germ agglutinin-enriched, nonwashed microsomes from WT, Sgcd-null and mdx mice. A 5–30% sucrose gradient was run. Light-to-heavy fractions (1–13) were separated by SDS-PAGE, and the expression of α-DG, SGCA, and β-DG was detected by immunoblotting. Fractions depicted in red were subjected to proteomic analysis. B, Immunohistochemistry was used to detect DGC subunits in skeletal muscle cryosections from WT, Sgcd-null, and mdx mice.
Fig. 3.
Fig. 3.
Classification of data set. A, A Venn diagram shows the distribution and number of proteins detected in microsomes from WT mice and the Sgcd-null and mdx disease models. B, Bar graphs showing the percentages of the top six classifications for the combined protein expression data per mouse model listed below, along with the group “Unclassified.” For each gene ontology term, the percentage refers to the fraction of classified proteins per total number of proteins (all classes).
Fig. 4.
Fig. 4.
K-means clustering. A, Partitioning of the 1067 proteins detected in our screen into 14 clusters using K-means clustering. In all cases, the columns represent sucrose-gradient fractions from muscle taken from WT, Sgcd-null, and mdx mice (n = 5 per genotype). Heatmap intensities represent relative protein expression. B, Expanded view of K-means cluster 5 (K5), which contains known DGC components (red labels).
Fig. 5.
Fig. 5.
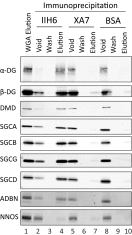
Co-immunoprecipitation of DGC subunits. Lane 1, input; lanes 2–4, anti-alpha-dystroglycan beads (IIH6); lanes 5–7, anti-ryanodine receptor beads (XA7); lanes 8–10, bovine serum albumin beads (BSA). Western blot analysis of α-DG, β-DG, DMD, SGCA, SGCB, SGCG, SGCD, ADBN, NNOS.
Fig. 6.
Fig. 6.
Quantitative analysis of expression of DGC components. Intensities of expression of DGC components present in cluster K5, for sucrose-gradient fractions 4–8 from the WT, Sgcd-null and mdx mice.
Fig. 7.
Fig. 7.
NFκB-regulated protein expression. A, NFκB-responsive proteins that are up-regulated twofold and more in mouse models of muscular dystrophy are shaded in red. Proteins that are associated with the network according to GeneGo are shaded in gray. B, NFκB-regulated proteins sorted according to K-means cluster.
Fig. 8.
Fig. 8.
Quantitative analysis of expression of components of the integrin-related network. A, The integrin-related PPI map was generated based on cluster K10, using GeneGo. Intensities of expression are depicted for each protein detected in sucrose-gradient fraction 7 for the WT, Sgcd-null and mdx mouse models. B, Transcriptional up-regulation of NFκB-regulated genes in Sgcd-null and mdx mouse models detected by quantitative RT-PCR.
Fig. 9.
Fig. 9.
Relationships among proteins associated with neuromuscular disorders. Hierarchical clustering of the relative levels of protein expression per sucrose gradient fraction for WT, Sgcd-null and mdx mice. Proteins are grouped based on their similar migration patterns across mouse models, and similar distributions through the sucrose gradient.

Similar articles

Cited by

References

    1. Mokri B., and Engel A. G. (1975) Duchenne dystrophy: electron microscopic findings pointing to a basic or early abnormality in the plasma membrane of the muscle fiber. Neurology 25, 1111–1120 - PubMed
    1. Ibraghimov-Beskrovnaya O., Ervasti J. M., Leveille C. J., Slaughter C. A., Sernett S. W., and Campbell K. P. (1992) Primary structure of dystrophin-associated glycoproteins linking dystrophin to the extracellular matrix. Nature 355, 696–702 - PubMed
    1. Hohenester E., Tisi D., Talts J. F., and Timpl R. (1999) The crystal structure of a laminin G-like module reveals the molecular basis of alpha-dystroglycan binding to laminins, perlecan, and agrin. Mol. Cell 4, 783–792 - PubMed
    1. Campbell K. P., and Kahl S. D. (1989) Association of dystrophin and an integral membrane glycoprotein. Nature 338, 259–262 - PubMed
    1. Ozawa E., Yoshida M., Suzuki A., Mizuno Y., Hagiwara Y., and Noguchi S. (1995) Dystrophin-associated proteins in muscular dystrophy. Human Mol. Genetics 4, 1711–1716 - PubMed

Publication types