

The Disappearing Sperms: Analysis of Reports Published Between 1980 and 2015
- PMID: 27099345
- PMCID: PMC5675356
- DOI: 10.1177/1557988316643383
The Disappearing Sperms: Analysis of Reports Published Between 1980 and 2015
Abstract
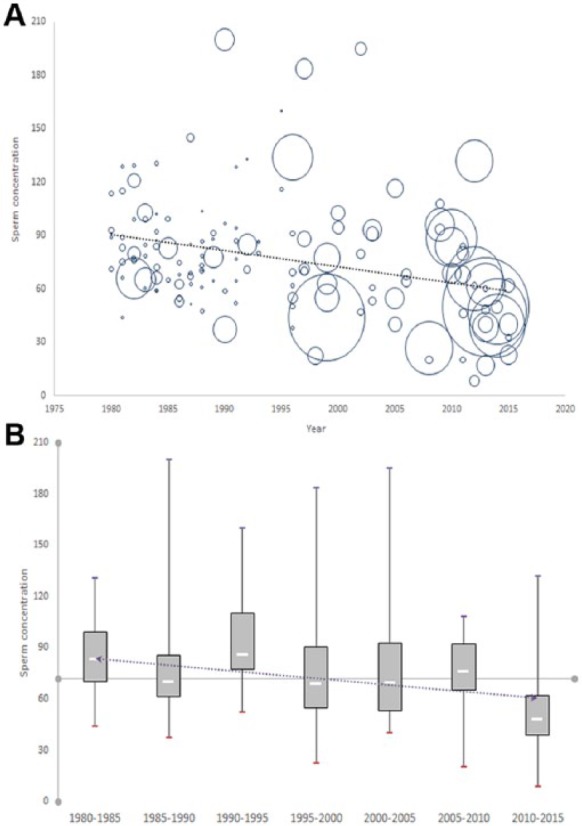
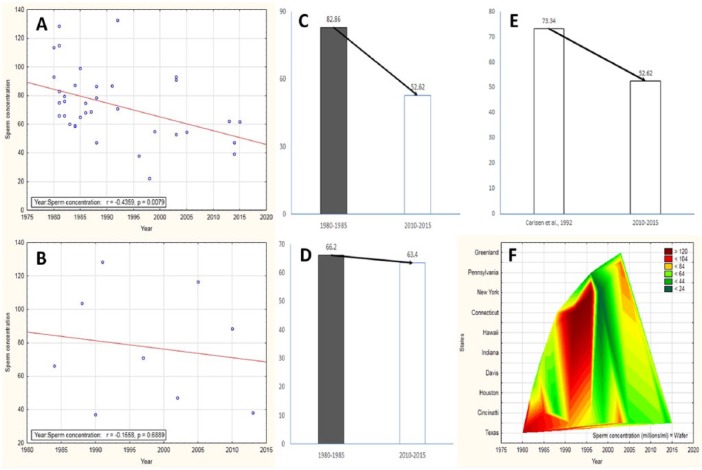
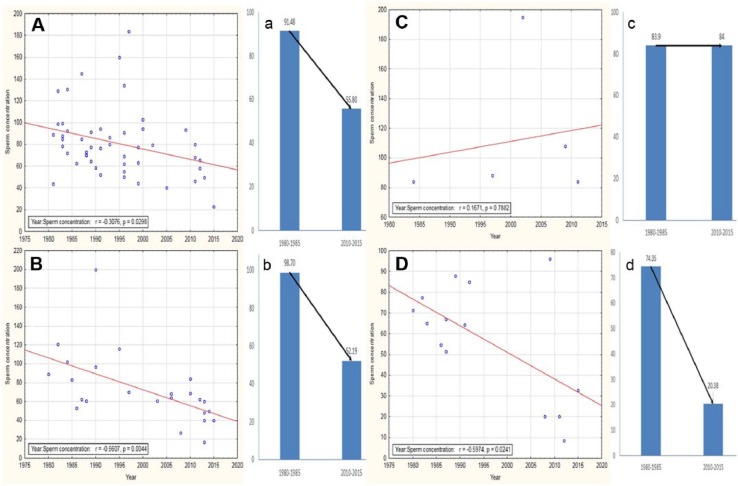
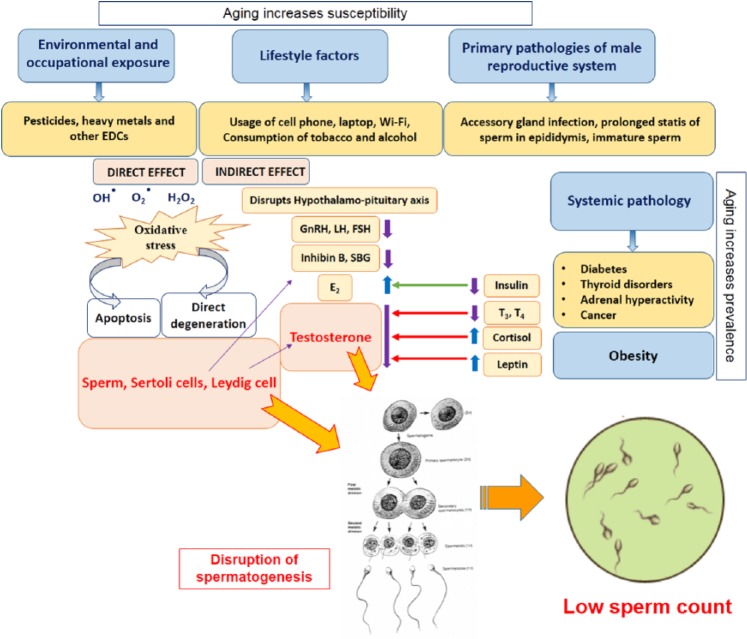
Reports regarding the changes in sperm concentration in different counties of the world are inconsistent. Furthermore, the reports that sprung up from specific epidemiological and experimental examinations did not include data of prior studies or geographical variations. The current study, following a previous report of massive fall in semen volume over the past 33 years, attempts to delineate the trend of altering sperm concentrations and factors responsible for this by reviewing article published from 1980 to July 2015 with geographic differences. The current study identified an overall 57% diminution in mean sperm concentration over the past 35 years ( r = -.313, p = .0002), which, when analyzed for each geographical region, identified a significant decline in North America, Europe, Asia, and Africa. An increasing trend of sperm concentration was identified only in Australia. The association of male age with such a trend ( R2 = .979) is reported. The authors also correlated male fertility with sperm concentration. Thus, this comprehensive, evidence-based literature review aims to concisely and systematically present the available data on sperm concentration from 1980 to 2015, as well as to statistically analyze the same and correlate male health with the declining pattern of sperm count in a single scientific review to serve the scientific research zone related to reproductive health. It points to the threat of male infertility in times ahead.
Keywords: semen quality; sperm concentration; sperm count.
Conflict of interest statement
Figures
References
-
- Aabyholm T. (1981). An andrological study of 51 fertile men. International Journal of Andrology, 4, 646-656. - PubMed
-
- Acacio B. D., Gottfried T., Israel R., Sokol R. Z. (2000). Evaluation of a large cohort of men presenting for a screening semen analysis. Fertility and Sterility, 73, 595-597. - PubMed
-
- Adami H. O., Bergström R., Möhner M., Zatoński W., Storm H., Ekbom A., . . . Rahu M. (1994). Testicular cancer in nine Northern European countries. International Journal of Cancer, 59, 33-38. - PubMed
-
- Agarwal A., Deepinder F., Sharma R. K., Ranga G., Li J. (2008). Effect of cell phone usage on semen analysis in men attending infertility clinic: An observational study. Fertility and Sterility, 89, 124-128. - PubMed
Publication types
MeSH terms
LinkOut - more resources
Full Text Sources
Other Literature Sources
Medical
Miscellaneous
