Review
. 2016 Jun;57(6):925-42.
doi: 10.1194/jlr.R066944. Epub 2016 Apr 19.

The Hybrid Mouse Diversity Panel: a resource for systems genetics analyses of metabolic and cardiovascular traits

Affiliations
Review

The Hybrid Mouse Diversity Panel: a resource for systems genetics analyses of metabolic and cardiovascular traits

Aldons J Lusis et al. J Lipid Res. 2016 Jun.

Abstract

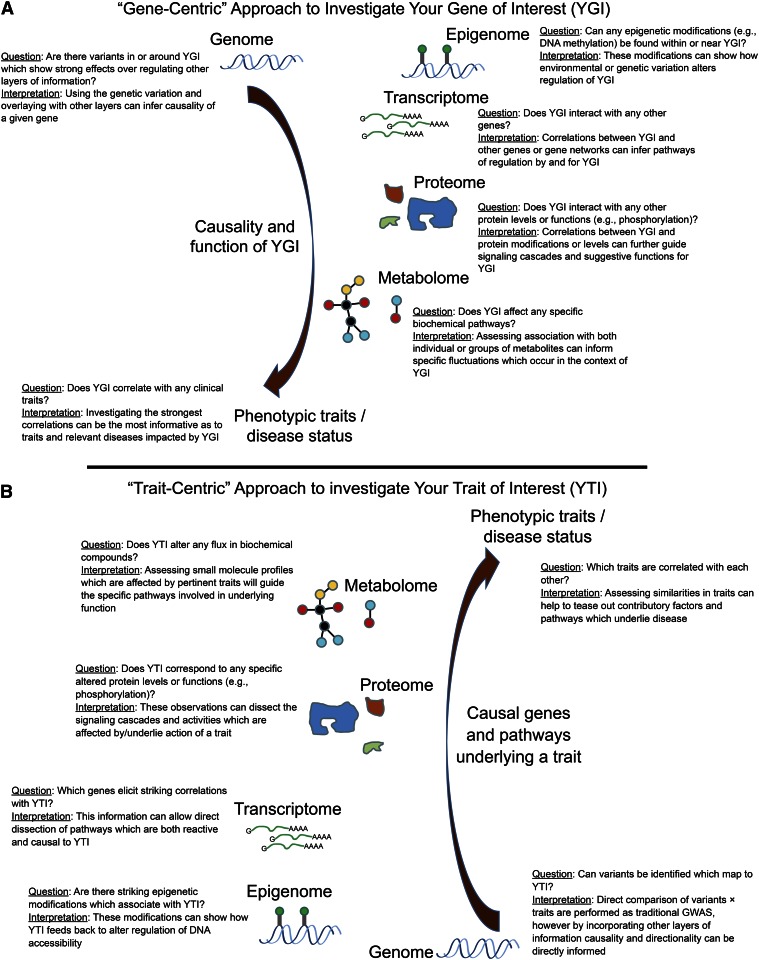
The Hybrid Mouse Diversity Panel (HMDP) is a collection of approximately 100 well-characterized inbred strains of mice that can be used to analyze the genetic and environmental factors underlying complex traits. While not nearly as powerful for mapping genetic loci contributing to the traits as human genome-wide association studies, it has some important advantages. First, environmental factors can be controlled. Second, relevant tissues are accessible for global molecular phenotyping. Finally, because inbred strains are renewable, results from separate studies can be integrated. Thus far, the HMDP has been studied for traits relevant to obesity, diabetes, atherosclerosis, osteoporosis, heart failure, immune regulation, fatty liver disease, and host-gut microbiota interactions. High-throughput technologies have been used to examine the genomes, epigenomes, transcriptomes, proteomes, metabolomes, and microbiomes of the mice under various environmental conditions. All of the published data are available and can be readily used to formulate hypotheses about genes, pathways and interactions.

Keywords: aherosclerosis; gene expression; gene mapping; gene-by-diet interaction; heart failure; insulin resistance; microbiota; obesity; osteoporosis.


Figures

Fig. 1.
Fig. 1.
Greatly increased mapping resolution in the HMDP as compared with a traditional cross between two inbred strains. Shown is the mapping of a strong cis-eQTL, for the gene Cyp2c37, by linkage in an F2 cross (blue line) or by association in the HMDP (black dots). The position of the gene is indicated by the red box. The F2 cross included about 300 mice and global transcript levels were determined using microarrays. The figure is reprinted from (44), with permission.
Fig. 2.
Fig. 2.
The flow of biologic information from liver DNA methylation to liver transcripts, proteins, and metabolites, and then clinical traits. The genomic positions of hypervariable CpGs are shown on the x axes and the y axes denote clinical traits (A), metabolites (B), proteins (C), or transcripts (D). In (C) and (D), the proteins or transcripts are plotted on the y axis according to the location of the encoding gene. Each dot is a significant association at the corresponding Bonferroni thresholds across CpGs tested with levels of clinical traits or levels of metabolites, proteins, or transcripts in liver. E, F: The association of percent methylation of a CpG on chromosome 1 at 173,115,750 base pairs (x axis) versus the levels of plasma HDL cholesterol (E) or apoAII (F). Reproduced from (63), with permission.
Fig. 3.
Fig. 3.
Network analysis predicts that Bicc1 plays a role in osteoblast differentiation. Bicc1 is a member of module 6 in a coexpression network based on global gene expression in bone tissue of the HMDP. The nodes represent genes and the lines indicate connections based on coexpression across the HMDP strains. The location of Bicc1 is highlighted and each node is colored based on gene ontology annotations listed in the top left corner. Reproduced from (20), with permission.
Fig. 4.
Fig. 4.
Genetic control of response to high-fat (HF) high-sucrose (HS) diet. Mice of the HMDP strains (six to eight male mice per group) were maintained on a low-fat chow diet until 8 weeks of age, when they were placed on a high-fat (32% kcal) and high-sucrose (25% kcal) diet for 8 weeks. The percent body fat on chow or on high-fat diet is shown in (A) and a GWAS of the percent body fat change following feeding of the diet is shown in (B). The red line in (B) indicates the threshold for genome-wide significance and likely candidate genes under each peak are indicated. The increase in percent body fat in response to the diet largely plateaus after about 4 weeks (C), consistent with a genetically controlled “setpoint” model of obesity (21). Reproduced from (21), with permission.
Fig. 5.
Fig. 5.
Abcc6 deficiency contributes to cardiac fibrosis following treatment with the β-adrenergic agonist, isoproterenol. A: Shows either wild-type C57BL/6J mice or C57BL/6J mice homozygous for a null (gene targeted) allele of Abcc6 (Abcc6−/−) following treatment with isoproterenol for 3 weeks. Neither strain developed significant calcification (stained with Alizarin Red) but the Abcc6−/− developed substantially increased fibrosis (stained blue with Masson’s trichrome). B: C3H/HeJ mice are naturally deficient in Abcc6 due to naturally occurring splicing mutation and when treated with isoproterenol develop extensive fibrosis and calcification in the heart. In contrast, C3H/HeJ mice carrying one copy of a genomic Abcc6 clone as a transgene (C3H/HeJ Abcc6−/−) were resistant to both fibrosis and calcification. Reproduced from (23), with permission.
Fig. 6.
Fig. 6.
Atherosclerosis in the HMDP. Atherosclerosis lesion size (μm2 ± SEM) in the proximal aorta was quantitated in 697 female (A) and 281 male (B) mice using oil red O staining. In each panel, stains are arranged in rank order by strain-average lesion area. As discussed in the text, the null mice were on an APOE-Leiden, CETP transgene background and were fed a Western diet for 16 weeks. Data from Bennett et al. (49) with permission.
Fig. 7.
Fig. 7.
Gene-by-environment interactions in response to a high-fat high-sucrose (HF/HS) diet. Shown are adipose transcript levels for two genes, sorbitol dehydrogenase (A) and histone deacetylase 1 (B), in mice fed either the chow diet (black dots) or the HF/HS diet (colored dots). The strains are rank ordered by transcript levels on the chow diet and the transcript levels on the HF/HS diet are colored according to the genotype of the peak cis-eQTL. In the case of sorbitol dehydrogenase, gene expression levels in mice with allele B are repressed by the diet, whereas those with allele A are induced. In the case of histone deacetylase 1, the induction is much larger in mice with genotype A than genotype B.
Fig. 8.
Fig. 8.
Sex differences in IR in the HMDP. HOMA-IR, a measure of IR based on glucose and insulin levels, was determined in the HMDP for males and females. In addition to large differences between strains, females clearly tended to be less insulin resistant than males. Reproduced from (12), with permission.
Fig. 9.
Fig. 9.
Application of the HMDP database to investigate genes or traits of interest. Hypothetical examples of how information from the HMDP can be utilized to explore relationships between genes (A) and traits (B) of interest and their relationships with multiple layers of information. For each layer, correlation analysis can be used to ask a specific question and interpret results which could elucidate novel functions and/or relationships of genes or traits of interest.

References

    1. Bennett B. J., Farber C. R., Orozco L., Kang H. M., Ghazalpour A., Siemers N., Neubauer M., Neuhaus I., Yordanova R., Guan B., et al. . 2010. A high-resolution association mapping panel for the dissection of complex traits in mice. Genome Res. 20: 281–290. - PMC - PubMed
    1. Andreux P. A., Williams E. G., Koutnikova H., Houtkooper R. H., Champy M. F., Henry H., Schoonjans K., Williams R. W., and Auwerx J.. 2012. Systems genetics of metabolism: the use of the BXD murine reference panel for multiscalar integration of traits. Cell. 150: 1287–1299. - PMC - PubMed
    1. Williams E. G., and Auwerx J.. 2015. The convergence of systems and reductionist approaches in complex trait analysis. Cell. 162: 23–32. - PMC - PubMed
    1. Nadeau J. H., Forejt J., Takada T., and Shiroishi T.. 2012. Chromosome substitution strains: gene discovery, functional analysis, and systems studies. Mamm. Genome. 23: 693–705. - PMC - PubMed
    1. Rau C. D., Parks B., Wang Y., Eskin E., Simecek P., Churchill G. A., and Lusis A. J.. 2015. High-density genotypes of inbred mouse strains: improved power and precision of association mapping. G3 (Bethesda). 5: 2021–2026. - PMC - PubMed