

Mir-30d increases intracellular survival of Helicobacter pylori through inhibition of autophagy pathway
- PMID: 27099441
- PMCID: PMC4823248
- DOI: 10.3748/wjg.v22.i15.3978
Mir-30d increases intracellular survival of Helicobacter pylori through inhibition of autophagy pathway
Abstract
Aim: To determine if mir-30d inhibits the autophagy response to Helicobacter pylori (H. pylori) invasion and increases H. pylori intracellular survival.
Methods: The expression of mir-30d was detected by quantitative polymerase chain reaction (PCR), and autophagy level was examined by transmission electron microscopy, western blot, and GFP-LC3 puncta assay in human AGS cells and GES-1 cells. Luciferase reporter assay was applied to confirm the specificity of mir-30d regulation on the expression of several core molecules involved in autophagy pathway. The expression of multiple core proteins were analyzed at both the mRNA and protein level, and the intracellular survival of H. pylori after different treatments was detected by gentamicin protection assay.
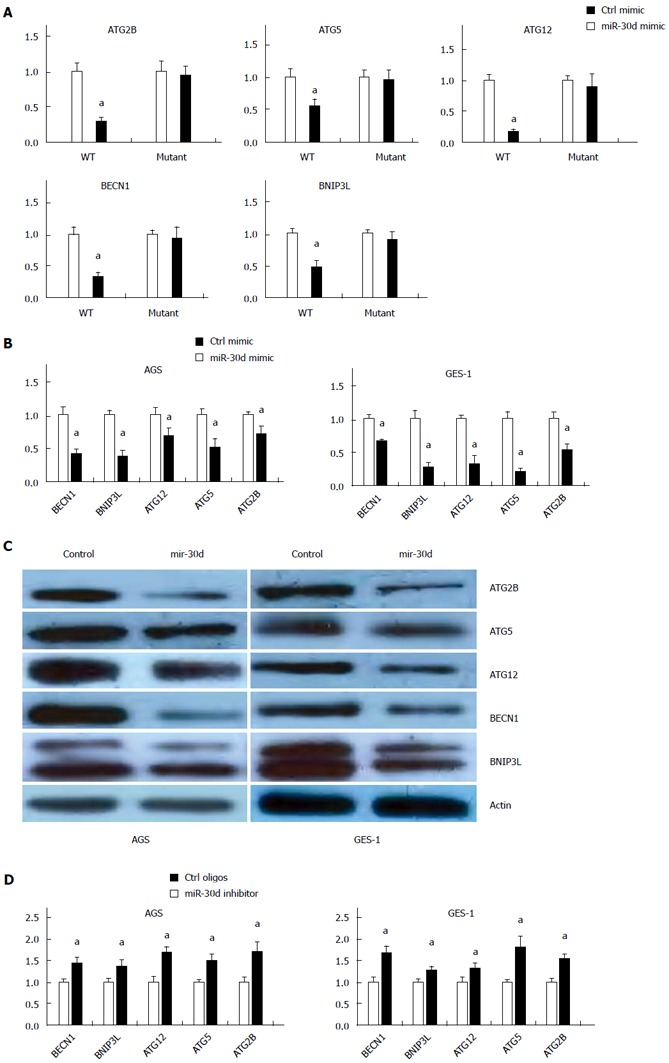
Results: Autophagy level was increased in AGS and GES-1 cells in response to H. pylori infection, which was accompanied by upregulation of mir-30d expression (P < 0.05, vs no H. pylori infection). In the two gastric epithelial cell lines, mimic mir-30d was found to repress the autophagy process, whereas mir-30d inhibitor increased autophagy response to H. pylori invasion. mir-30d mimic decreased the luciferase activity of wild type reporter plasmids carrying the 3' untranslated region (UTR) of all five tested genes (ATG2B, ATG5, ATG12, BECN1, and BNIP3L), whereas it had no effect on the mutant reporter plasmids. These five genes are core genes of autophagy pathway, and their expression was reduced significantly after mir-30d mimic transfection (P < 0.05, vs control cells without mir-30d mimic treatment). Mir-30d mimic transfection and direct inhibition of autophagy increased the intracellular survival of H. pylori in AGS cells.
Conclusion: Mir-30d increases intracellular survival of H. pylori in gastric epithelial cells through inhibition of multiple core proteins in the autophagy pathway.
Keywords: Autophagy; Gastric cancer; Gene expression; Helicobacter pylori; mir-30d.
Figures


Similar articles
-
mir-30d Regulates multiple genes in the autophagy pathway and impairs autophagy process in human cancer cells.Biochem Biophys Res Commun. 2013 Feb 15;431(3):617-22. doi: 10.1016/j.bbrc.2012.12.083. Epub 2012 Dec 27. Biochem Biophys Res Commun. 2013. PMID: 23274497 Free PMC article.
-
Helicobacter pylori-induced posttranscriptional regulation of H-K-ATPase α-subunit gene expression by miRNA.Am J Physiol Gastrointest Liver Physiol. 2014 Apr 1;306(7):G606-13. doi: 10.1152/ajpgi.00333.2013. Epub 2014 Feb 6. Am J Physiol Gastrointest Liver Physiol. 2014. PMID: 24503769 Free PMC article.
-
Loss of TFF1 promotes Helicobacter pylori-induced β-catenin activation and gastric tumorigenesis.Oncotarget. 2015 Jul 20;6(20):17911-22. doi: 10.18632/oncotarget.3772. Oncotarget. 2015. PMID: 25980439 Free PMC article.
-
Helicobacter pylori and mucosa-associated lymphoid tissue: what's new.Hematology Am Soc Hematol Educ Program. 2013;2013:109-17. doi: 10.1182/asheducation-2013.1.109. Hematology Am Soc Hematol Educ Program. 2013. PMID: 24319171 Review.
-
Relationship between VacA Toxin and Host Cell Autophagy in Helicobacter pylori Infection of the Human Stomach: A Few Answers, Many Questions.Toxins (Basel). 2016 Jul 1;8(7):203. doi: 10.3390/toxins8070203. Toxins (Basel). 2016. PMID: 27376331 Free PMC article. Review.
Cited by
-
Rab32 GTPase, as a direct target of miR-30b/c, controls the intracellular survival of Burkholderia pseudomallei by regulating phagosome maturation.PLoS Pathog. 2019 Jun 14;15(6):e1007879. doi: 10.1371/journal.ppat.1007879. eCollection 2019 Jun. PLoS Pathog. 2019. PMID: 31199852 Free PMC article.
-
Function of Non-coding RNA in Helicobacter pylori-Infected Gastric Cancer.Front Mol Biosci. 2021 May 11;8:649105. doi: 10.3389/fmolb.2021.649105. eCollection 2021. Front Mol Biosci. 2021. PMID: 34046430 Free PMC article. Review.
-
AutophagyNet: high-resolution data source for the analysis of autophagy and its regulation.Autophagy. 2024 Jan;20(1):188-201. doi: 10.1080/15548627.2023.2247737. Epub 2023 Aug 17. Autophagy. 2024. PMID: 37589496 Free PMC article.
-
Association of Interleukin-1B gene Polymorphism with H. pylori infected Dyspeptic Gastric Diseases and Healthy Population.Pak J Med Sci. 2020 May-Jun;36(4):825-830. doi: 10.12669/pjms.36.4.1883. Pak J Med Sci. 2020. PMID: 32494282 Free PMC article.
-
Molecular mechanism of Helicobacter pylori-induced autophagy in gastric cancer.Oncol Lett. 2019 Dec;18(6):6221-6227. doi: 10.3892/ol.2019.10976. Epub 2019 Oct 10. Oncol Lett. 2019. PMID: 31788098 Free PMC article. Review.
References
-
- Parkin DM, Bray F, Ferlay J, Pisani P. Estimating the world cancer burden: Globocan 2000. Int J Cancer. 2001;94:153–156. - PubMed
-
- Vogiatzi P, Cassone M, Luzzi I, Lucchetti C, Otvos L, Giordano A. Helicobacter pylori as a class I carcinogen: physiopathology and management strategies. J Cell Biochem. 2007;102:264–273. - PubMed
-
- Wang YH, Wu JJ, Lei HY. The autophagic induction in Helicobacter pylori-infected macrophage. Exp Biol Med (Maywood) 2009;234:171–180. - PubMed
-
- Allen LA. Phagocytosis and persistence of Helicobacter pylori. Cell Microbiol. 2007;9:817–828. - PubMed
MeSH terms
Substances
LinkOut - more resources
Full Text Sources
Other Literature Sources
Medical
