. 2016 Mar 8;9(4):565-82.
doi: 10.1111/eva.12361. eCollection 2016 Apr.

The implications of small stem cell niche sizes and the distribution of fitness effects of new mutations in aging and tumorigenesis

Affiliations

The implications of small stem cell niche sizes and the distribution of fitness effects of new mutations in aging and tumorigenesis

Vincent L Cannataro et al. Evol Appl. .

Abstract

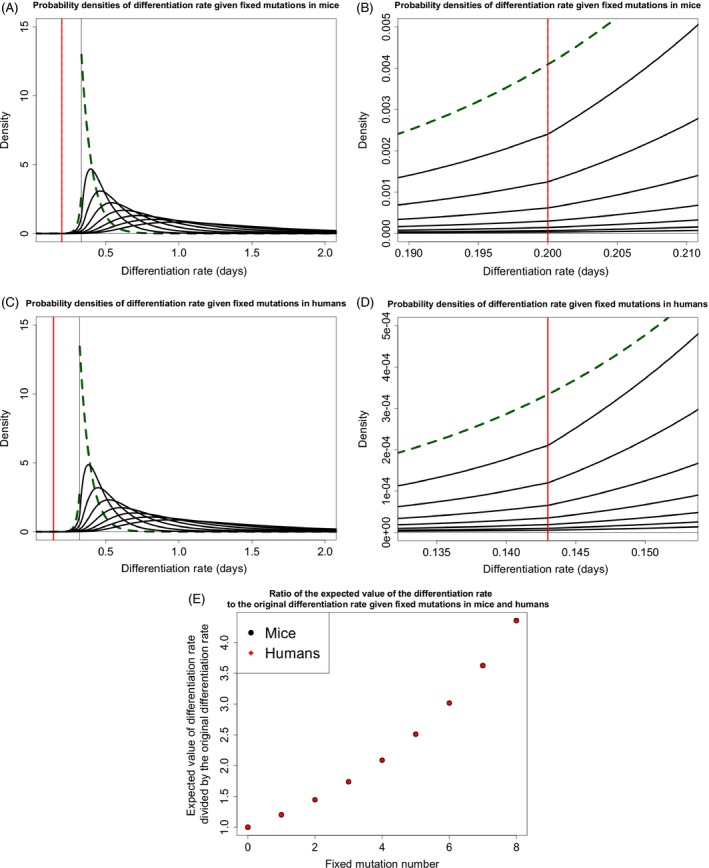
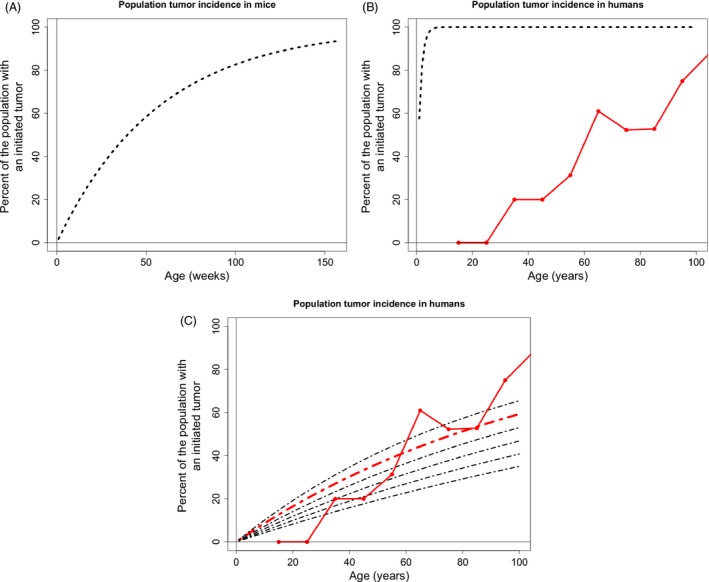
Somatic tissue evolves over a vertebrate's lifetime due to the accumulation of mutations in stem cell populations. Mutations may alter cellular fitness and contribute to tumorigenesis or aging. The distribution of mutational effects within somatic cells is not known. Given the unique regulatory regime of somatic cell division, we hypothesize that mutational effects in somatic tissue fall into a different framework than whole organisms; one in which there are more mutations of large effect. Through simulation analysis, we investigate the fit of tumor incidence curves generated using exponential and power-law distributions of fitness effects (DFE) to known tumorigenesis incidence. Modeling considerations include the architecture of stem cell populations, that is, a large number of very small populations, and mutations that do and do not fix neutrally in the stem cell niche. We find that the typically quantified DFE in whole organisms is sufficient to explain tumorigenesis incidence. Further, deleterious mutations are predicted to accumulate via genetic drift, resulting in reduced tissue maintenance. Thus, despite there being a large number of stem cells throughout the intestine, its compartmental architecture leads to the accumulation of deleterious mutations and significant aging, making the intestinal stem cell niche a prime example of Muller's Ratchet.

Keywords: aging; biomedicine; evolutionary theory; fitness; population genetics‐theoretical; stem cells; tumorigenesis.


Figures

Figure 1
Figure 1
A representation of our model. (A) A cross section of an intestinal crypt, blue circles at the base of the crypt represent stem cells, while yellow circles represent cells that have committed to differentiation. The oval cross section at the base encompasses the stem cell niche, while stem cells above this niche are destined to commit to differentiation. Taking a top‐down look at the oval, large circles represent a cross section of the intestinal crypt base, which houses the intestinal stem cells, represented by smaller blue and red circles. Mutations may occur to a single cell in the stem cell niche. These mutations alter the fitness of the cell according to a specified distribution of fitness effects. Given the new fitness, the mutated lineage has a certain probability, pfix(λ;λold), of reaching fixation within the stem cell niche. (B) Here, the rectangles represent a cross section of the intestinal epithelium with the numbers representing the locations of individual crypts and describing the number of fixed mutations for each crypt. An organism accumulates fixed mutations over its lifetime.
Figure 2
Figure 2
The accumulation of probability densities describing stem cell division rate. (A) Exponentially distributed fitness effects on division rate using the parameters in Table 1 for the mouse. The first density is a green dashed line. Each probability density represents the division rate of a fixed lineage after n fixed mutations, with n indicated by an arrow. (B) Zooming in on the tumorigenesis threshold, we see that the area of the division rate density that is over the tumorigenesis threshold increases at first and then decreases with subsequent mutation. There is a change in slope of the densities at the tumorigenesis threshold because subsequent densities are calculated from the previous density which has had the area to the right of the tumorigenesis threshold removed and the area to the left renormalized to 1. (C,D) are the same as (A) and (B), respectively, but are for the human scenario. The larger population size decreases the strength of drift. Order of mutations in (C) proceeds as in (A) and proceeds from 1 through 8 from bottom to top in (D). (E) The expected values of the probability densities in (A) and (B) divided by their original values over subsequent fixed mutations.
Figure 3
Figure 3
Tumorigenesis incidence in mice and humans using whole organism DFE parameters. (A) The population incidence of tumorigenesis throughout the entire intestinal tract of the mouse. (B) The population incidence of tumorigenesis throughout the large intestine in humans. The black dashed lines are generated from the species specific parameters listed in Table 1. The solid red line connects large intestine polyp incidence data found during autopsy (Chapman 1963).
Figure 4
Figure 4
Tumorigenesis incidence curves resulting from least squares parameter fitting. (A) Incidence curves derived from the assumption of an exponential beneficial DFE. The best fit to the data out of the explored parameter space has the same μ as the yeast reported in Table 1 and E[s+] = 0.064 (red dashed line). Black dashed lines derived from E[s+] = 0.064 and, from bottom to top, μ=7.5×10⁵ to 1.75×104 by 2.5×105. Blue dashed line is the predicted incidence curve with the best fit with E[s+] = 0.061 (initial DFE derived from yeast reported in Table 1), which had μ=1.75×10⁴. (B) Incidence curves derived from the assumption of a power‐law beneficial DFE. All parameters are the same as in Table 1, except E[s+] = 0.044 for each curve and, ranging from top to bottom, μ ranges from 4.5×10⁴ to 5.5×104 by 2.5×105, with 5×10⁴ providing the best fit.
Figure 5
Figure 5
The accumulation of probability densities describing stem cell differentiation rate. (A) Exponentially distributed fitness effects on differentiation rate using the parameters in Table 1 for the mouse. The first density is a green dashed line. Each probability density represents the differentiation rate of a fixed lineage after n fixed mutations, with subsequent mutations traveling away from the original differentiation rate. (B) Zooming in on the tumorigenesis threshold, we see that the area of the differentiation rate density that is over the tumorigenesis threshold decreases with subsequent mutation. There is a change in slope of the densities at the tumorigenesis threshold because subsequent densities are calculated from the previous density which has had the area to the left of the tumorigenesis threshold removed and the area to the right renormalized to 1. (C,D) are the same as (A) and (B), respectively, but are for the human scenario. Order of mutations in (C) proceeds as in (A). (E) The expected values of the probability densities in (A) and (B) divided by their original values over subsequent fixed mutations.
Figure 6
Figure 6
The tumorigenesis incidence resulting from stem cell mutational effects on differentiation rate. Calculations presented for tumor incidence in (A) mice, (B) humans, and (C) Best fit incidence curve in red; expected beneficial fitness effect of 0.057 and mutation rate of 2.5 ×10⁶. The other curves have the same mutation rate but vary around the expected beneficial fitness effect by increments of 0.001.

Similar articles

Cited by

References

    1. Bank, C. , Hietpas R. T., Wong A., Bolon D. N., and Jensen J. D. 2014. A bayesian MCMC approach to assess the complete distribution of fitness effects of new mutations: uncovering the potential for adaptive walks in challenging environments. Genetics 196:841–852. - PMC - PubMed
    1. Barker, N. 2014. Adult intestinal stem cells: critical drivers of epithelial homeostasis and regeneration. Nature Reviews Molecular Cell Biology 15:19–33. - PubMed
    1. Beckman, R. A. and Loeb L. A. 2005. Negative clonal selection in tumor evolution. Genetics 171:2123–2131. - PMC - PubMed
    1. Beerenwinkel, N. , Antal T., Dingli D., Traulsen A., Kinzler K. W., Velculescu V. E., Vogelstein B., and Nowak M. A. 2007. Genetic progression and the waiting time to cancer. PLoS Computational Biology 3:e225. - PMC - PubMed
    1. Bozic, I. , Antal T., Ohtsuki H., Carter H., Kim D., Chen S., Karchin R., Kinzler K. W., Vogelstein B., and Nowak M. A. 2010. Accumulation of driver and passenger mutations during tumor progression. Proceedings of the National Academy of Sciences of the United States of America 107:18545–18550. - PMC - PubMed

LinkOut - more resources