. 2016 Apr 21;11(4):e0150434.
doi: 10.1371/journal.pone.0150434. eCollection 2016.

CD45 Isoform Profile Identifies Natural Killer (NK) Subsets with Differential Activity

Affiliations

CD45 Isoform Profile Identifies Natural Killer (NK) Subsets with Differential Activity

Ewelina Krzywinska et al. PLoS One. .

Abstract

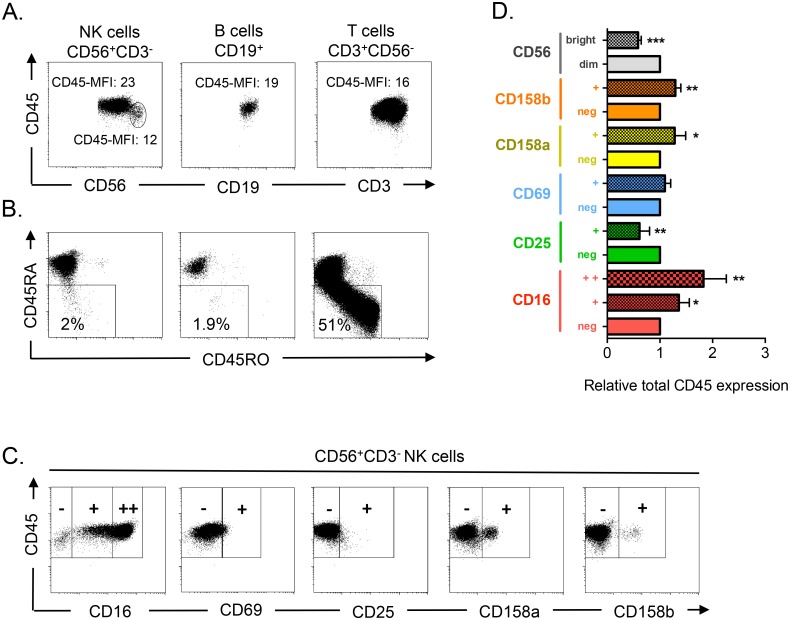
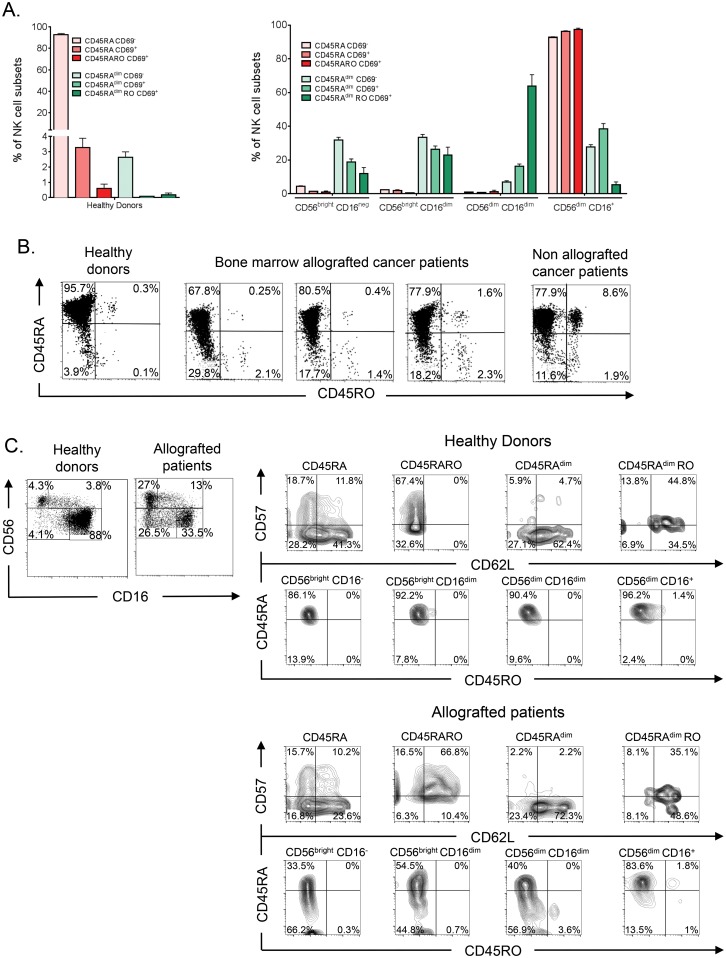
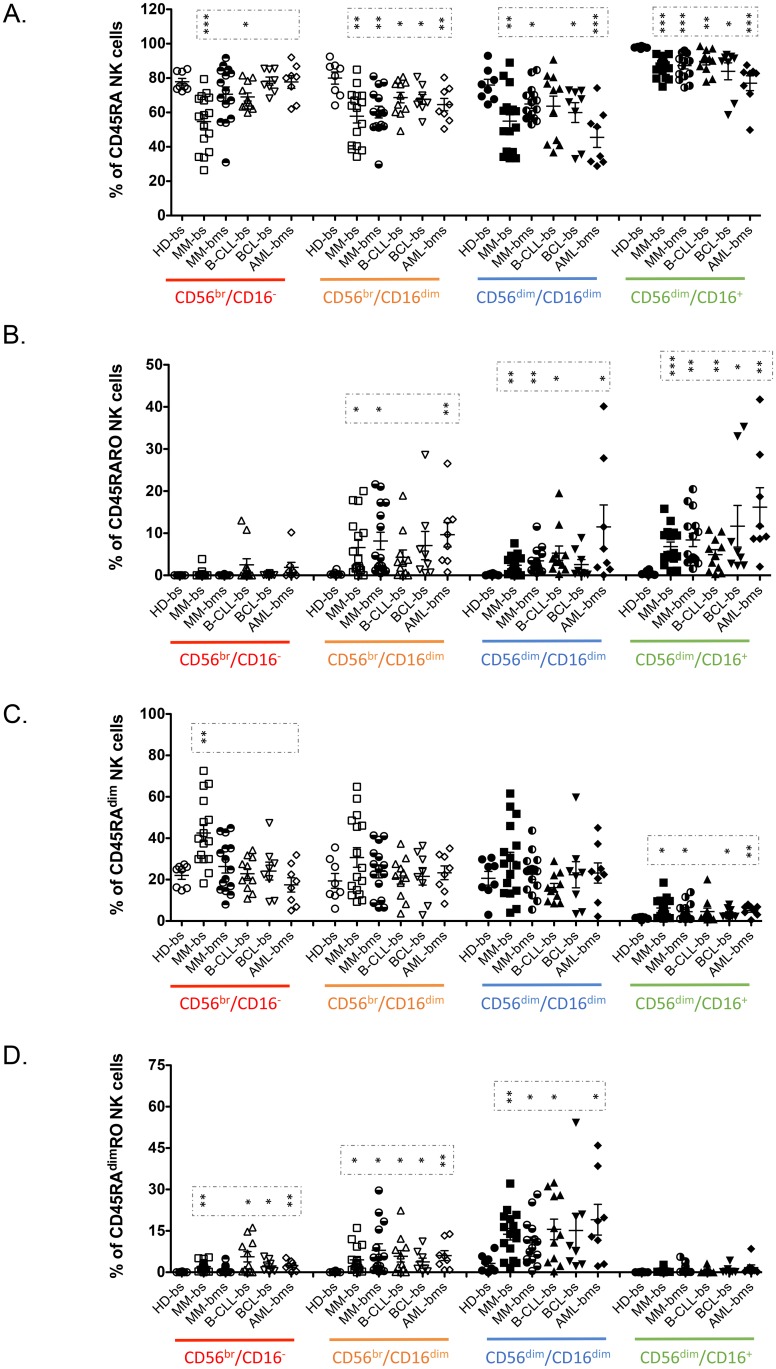
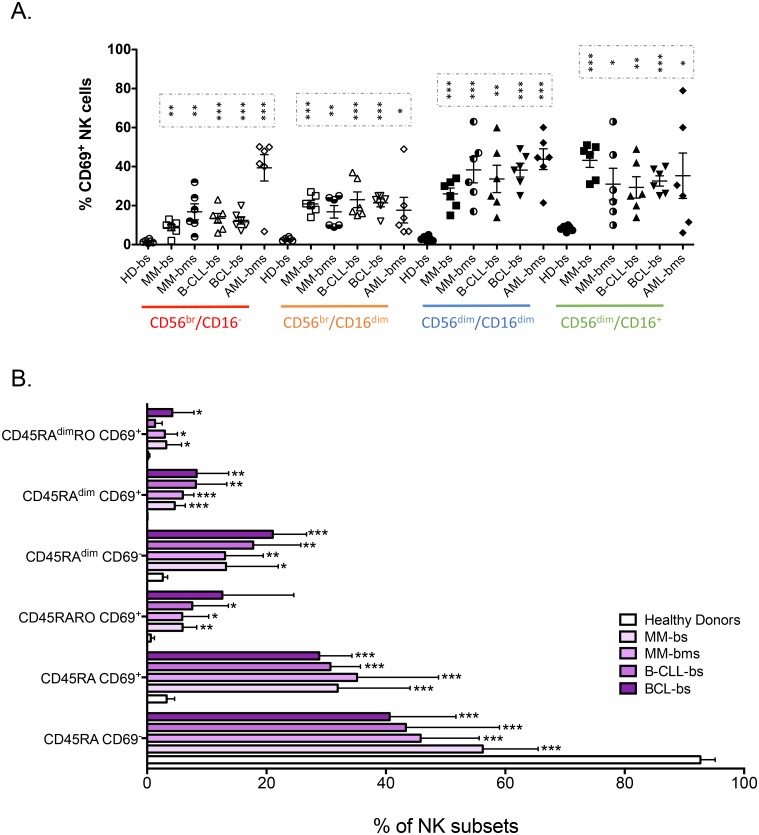
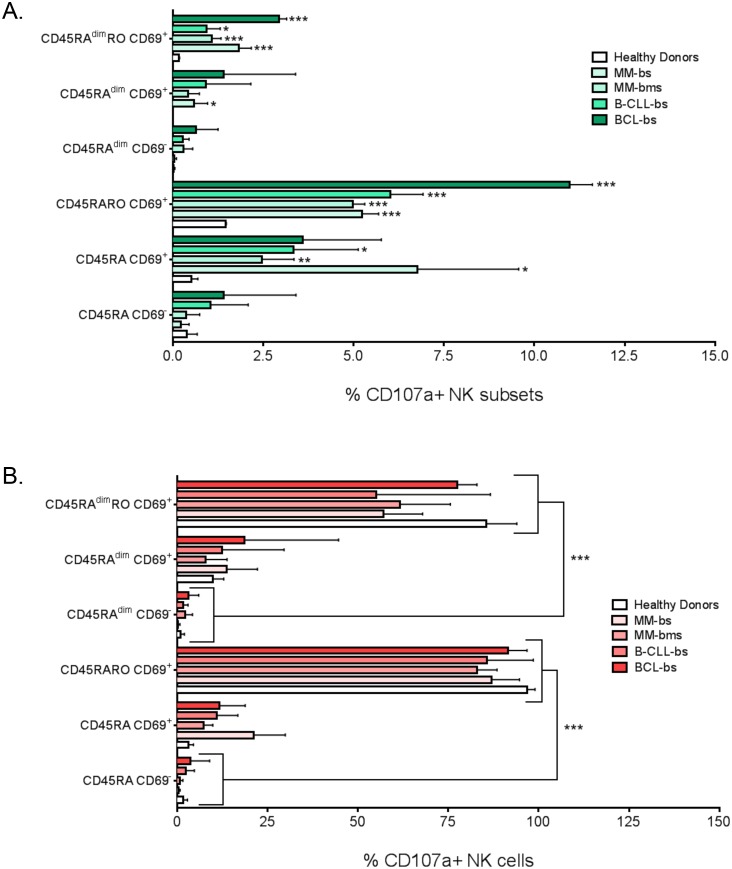
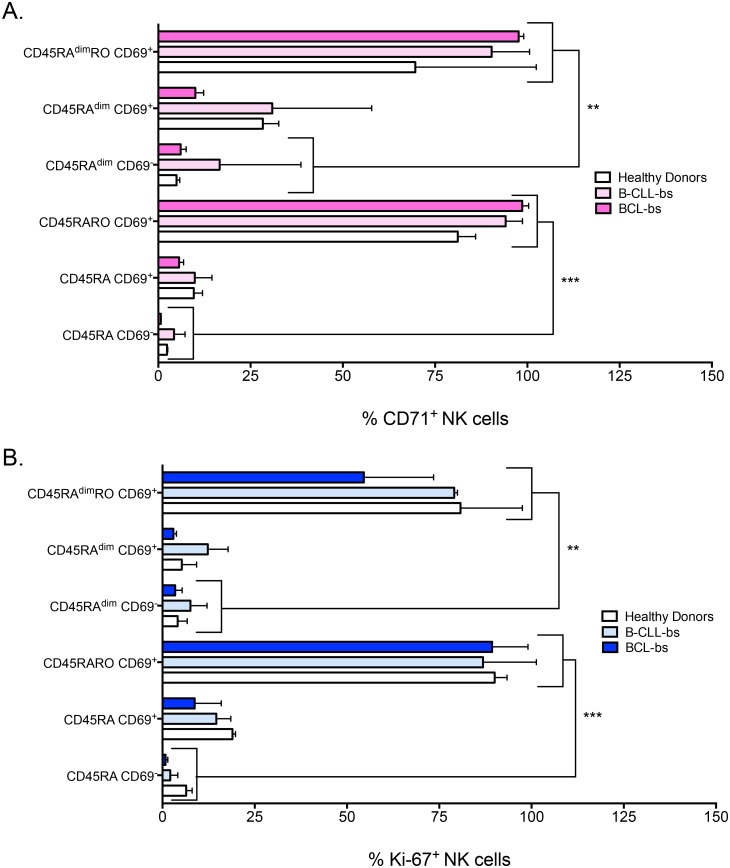
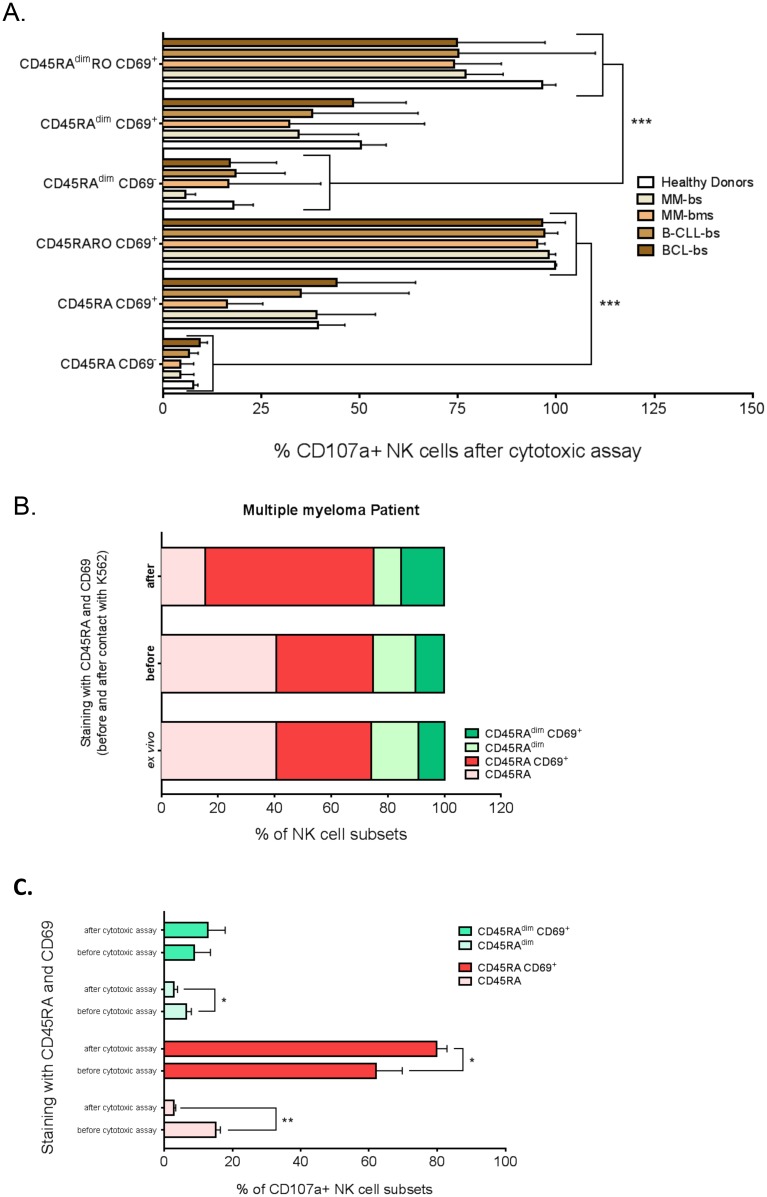
The leucocyte-specific phosphatase CD45 is present in two main isoforms: the large CD45RA and the short CD45RO. We have recently shown that distinctive expression of these isoforms distinguishes natural killer (NK) populations. For example, co-expression of both isoforms identifies in vivo the anti tumor NK cells in hematological cancer patients. Here we show that low CD45 expression associates with less mature, CD56bright, NK cells. Most NK cells in healthy human donors are CD45RA+CD45RO-. The CD45RA-RO+ phenotype, CD45RO cells, is extremely uncommon in B or NK cells, in contrast to T cells. However, healthy donors possess CD45RAdimRO- (CD45RAdim cells), which show immature markers and are largely expanded in hematopoietic stem cell transplant patients. Blood borne cancer patients also have more CD45RAdim cells that carry several features of immature NK cells. However, and in opposition to their association to NK cell progenitors, they do not proliferate and show low expression of the transferrin receptor protein 1/CD71, suggesting low metabolic activity. Moreover, CD45RAdim cells properly respond to in vitro encounter with target cells by degranulating or gaining CD69 expression. In summary, they are quiescent NK cells, with low metabolic status that can, however, respond after encounter with target cells.


Conflict of interest statement

Competing Interests: The authors have declared that no competing interests exist.

Figures

Fig 1
Fig 1. CD45 expression correlates with markers of NK cell maturation.
A) After purification, PBMCs from healthy donors were stained for FACS analysis with anti-CD19 (B cells, CD19+), -CD3 (T cells, CD3+CD56-) and -CD56 (NK cells, CD56+CD3-), to identify the different lymphocyte populations, and also with anti-CD45. CD45 mean fluorescence intensities (MFI) are given for each population and for CD56bright NK cells. B) PBMCs were stained as in (A) and with anti-CD45RA and -CD45RO antibodies. The percentage of CD45RAdim cells is given for each lymphocyte population. C) Cells were stained as in (A) and with antibodies against the NK cell markers CD16, CD25, CD69, CD158a and CD158b to assess their co-expression with CD45 in NK cells. D) The bars show the mean ± SD (n = 4) of the relative CD45 expression in different NK cell populations. To avoid inter-donor variations, the histogram shows the relative expression of CD45 in each NK cell subset, which was defined based on the positive or negative expression of a given marker. For comparison, CD45 expression in the populations that does not, or barely, expresses that marker was arbitrarily set to 1.
Fig 2
Fig 2. NK cell subsets in cancer patients allografted with HSC.
A) After purification, PBMCs from healthy donors were stained as in Fig 1 and also with anti-CD16, to identify NK cell subsets at different stage of maturation, and with -CD45RA, -CD45RO and -CD69 antibodies. The bars in the left panel show the percentage (mean ± SD) of the six NK cell subsets based on their CD45 and CD69 expression profile. The right panel depicts the abundance of these six populations at four NK cell maturation stages, based on CD56 and CD16 expression. B) PBMCs from healthy donors, allografted patients with hematological cancer and one non-allografted patient with multiple myeloma were stained as in (A) and CD45RA and CD45RO expression analyzed. C) Samples in (B) were also stained with anti- CD62L and -CD57 antibodies.
Fig 3
Fig 3. Patients with hematological malignancies have specific NK cell subset profiles that correlate with maturation status.
PBMCs from blood samples (bs) of healthy donors and of patient with different hematological cancers or from bone marrow (bms) of the patient with MM or AML were stained as in Fig 2. The percentage of CD45RA, CD45RARO, CD45RAdim and CD45RAdimRO cells at the different stage of NK maturation (CD56/16 expression) was depicted in the graphic. Each point represents a donor. The mean ± SD and the statistical analysis are also shown. HD, Healthy donor; MM, multiple myeloma; B-CLL, B-cell chronic lymphocytic leukemia; BCL, B-cell lymphoma; AML, acute myeloid leukemia; bs, blood samples; bms, bone marrow samples.
Fig 4
Fig 4. CD69, CD45RA and CD45RO identify different NK cell subsets.
A) PBMCs from healthy donors (HD) and patients with different hematological malignancies were purified as in Fig 1 and the percentage of CD69+ cells at different stages of NK cell maturation (CD56/CD16) was calculated. The mean ± SD is also depicted. B) Percentage of NK cells in the different NK cell populations based CD45RA, CD45RO and CD69 expressions in PBMCs from healthy donors (HD) and patients with different hematological malignancies. Bars represent the mean ± SD for each medical condition.
Fig 5
Fig 5. CD45RO identifies degranulating NK cells.
PBMCs from healthy donors (HD) and patients with different hematological malignancies were purified as in Fig 1. A) Percentage of the total NK cells that were CD107a+ and expressed the corresponding markers to be considered in one of the six NK cell subsets based on CD45RA/CD45RO/CD69 expression. B) Percentage of NK cells in the different subsets that were CD107a+. Bars represent the mean ± SD for each medical condition. To identify the function of the different NK cell subsets, we firstly assessed cell degranulation by ex vivo staining of PBMCs with anti-CD107a antibodies. Fig 5A depicted the % of CD107a+ NK cells and in which NK subset they were regarding expression of CD5RARO and CD69. For example in B-CLL there were 21% of CD107a+ NK cells; of those, 12% were CD5RARO CD69+, 3% CD45RA CD69+, 3% CD45RAdimRO CD69+, etc. Hematological cancer patients showed a large increase in CD107a+ cells. Most of these cells were CD69+. Fig 5B showed the % of NK cells in each of the 6 populations that are CD107a+, which was basically 100% for CD5RARO CD69+ cells. CD45RAdimRO CD69+ cells were also basically CD107a+. Overall, CD107a expression associated with CD45RO expression and was more related to CD69+ than to CD69- cells and CD45RA down-regulation did not affect CD107a expression.
Fig 6
Fig 6. Lost of CD45RA or gain of CD69 does not correlate with metabolically active and proliferating NK cells.
A-B) Percentage of NK cells that express CD71 or Ki-67 in the six different NK cell subsets (CD45/CD69) from blood samples of healthy donors (HD) and patients with B-cell chronic lymphocytic leukemia (B-CLL) or B-cell lymphoma (BCL). Bars represent the mean ± SD for each medical condition.
Fig 7
Fig 7. CD45RO- and CD69- cells can degranulate in vitro.
PBMCs from healthy donors (HD) and patients with different hematological malignancies were purified as in Fig 1 and were incubated for 4 hours with target K562 tumor cells at the effector:target ratio of 10:1. A) Percentage of CD107a+ NK cells in the six different NK cell subsets (CD45RA/CD45RO/CD69 expression) described in Fig 5B. Bars represent the mean ± SD for each medical condition. B) Cells were treated as in A, but they were labeled with anti-CD45RA and–CD69 antibodies ex vivo, at the end of the in vitro cytotoxicity assay (after) or before the assay (before). The figure shows the percentage of cells in each NK cell subset in a patient with MM. C) Percentage of CD107a+ cells in each NK cell subset, based on antibody labeling before or after the in vitro cytotoxicity assay. The results represent the mean ± SD of 3 healthy donors.

References

    1. Villalba M, Rathore MG, Lopez-Royuela N, Krzywinska E, Garaude J, Allende-Vega N. From tumor cell metabolism to tumor immune escape. Int J Biochem Cell Biol. 2013;45(1):106–13. 10.1016/j.biocel.2012.04.024 . - DOI - PubMed
    1. Baier C, Fino A, Sanchez C, Farnault L, Rihet P, Kahn-Perles B, et al. Natural Killer Cells Modulation in Hematological Malignancies. Frontiers in immunology. 2013;4:459 10.3389/fimmu.2013.00459 - DOI - PMC - PubMed
    1. Villalba M, Lopez-Royuela N, Krzywinska E, Rathore MG, Hipskind RA, Haouas H, et al. Chemical metabolic inhibitors for the treatment of blood-borne cancers. Anti-cancer agents in medicinal chemistry. 2014;14(2):223–32. . - PMC - PubMed
    1. Catalán E, Charni S, Jaime P, Aguiló J-I, Enríquez J-A, Naval J, et al. MHC-I modulation due to metabolic changes regulates tumor sensitivity to CTL and NK cells. Oncoimmunology. 2015;4(1):e985924 10.4161/2162402X.2014.985924 - DOI - PMC - PubMed
    1. McKenna DH Jr, Sumstad D, Bostrom N, Kadidlo DM, Fautsch S, McNearney S, et al. Good manufacturing practices production of natural killer cells for immunotherapy: a six-year single-institution experience. Transfusion. 2007;47(3):520–8. . - PubMed

Publication types

MeSH terms